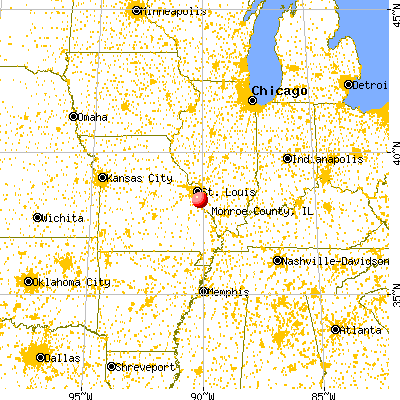
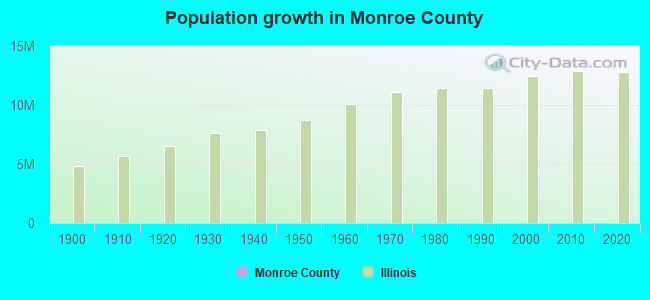
Monroe County, Illinois (IL)
County owner-occupied free and clear houses and condos in 2010: 2,936
County owner-occupied houses and condos in 2000: 8,241
Renter-occupied apartments: 2,309 (it was 2,034 in 2000)
| % of renters here: | 20% |
| State: | 33% |
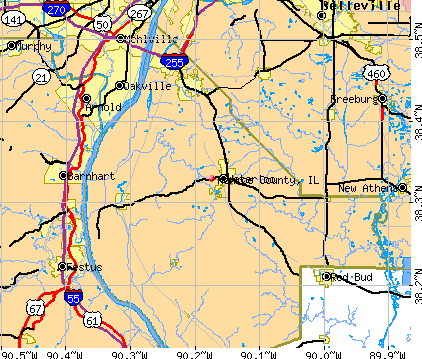
Land area: 388 sq. mi.
Water area: 9.4 sq. mi.
Population density: 89 people per square mile (average).
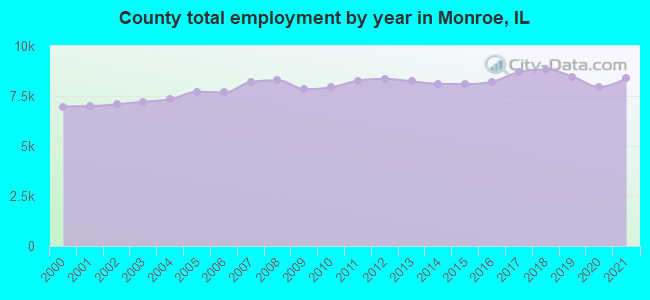
Industries providing employment: Educational, health and social services (24.0%), Retail trade (10.9%), Manufacturing (10.7%), Professional, scientific, management, administrative, and waste management services (10.3%).
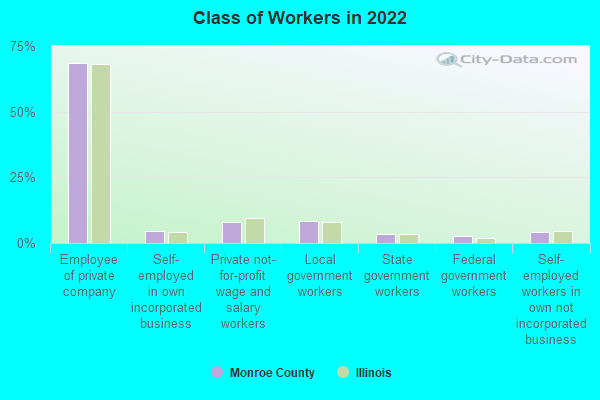
Type of workers:
- Private wage or salary: 81%
- Government: 15%
- Self-employed, not incorporated: 4%
- Unpaid family work: 0%
- OSM Map
- General Map
- Google Map
- MSN Map

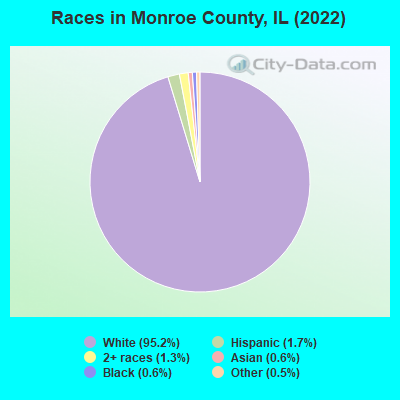
- 32,30895.2%White Non-Hispanic Alone
- 5871.7%Hispanic or Latino
- 4401.3%Two or more races
- 2180.6%Asian alone
- 2060.6%Black Non-Hispanic Alone
- 1620.5%Some other race alone
- 250.07%American Indian and Alaska Native alone
| Median resident age: | 42.9 years |
| Illinois median age: | 39.1 years |
| Males: 17,296 | |
| Females: 17,128 |

 | Retiring in IL - LIBERAL! (24 replies) |
| Illinois......are you staying or leaving? (277 replies) |
| Chicago 2030….and the pecking order (89 replies) |
| US Census Migration Data By County - Who's Moving to Chicago? (54 replies) |
| How's St. Louis's Metro East? (6 replies) |
| Fortune Magazine’s Ten Most Corrupt States: Illinois # 4 (22 replies) |
| Monroe County: | 2.0 people |
| Illinois: | 3 people |
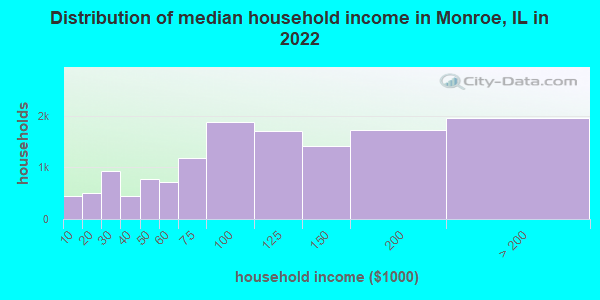
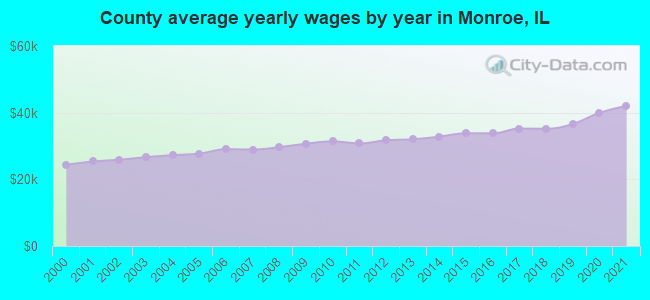
Estimated median household income in 2022: $98,470 ($55,320 in 1999)
| This county: | $98,470 |
| Illinois: | $76,708 |
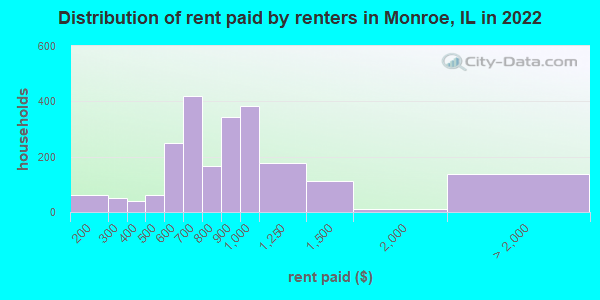
Median contract rent in 2022 for apartments: $801 (lower quartile is $618, upper quartile is $954)
| This county: | $801 |
| State: | $1008 |
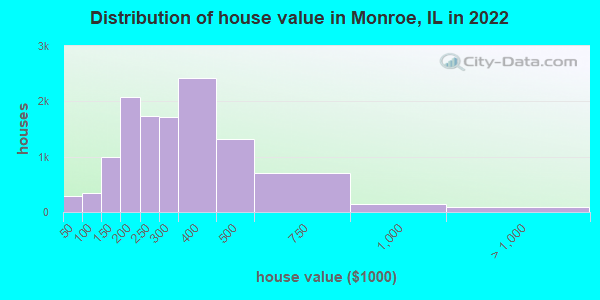
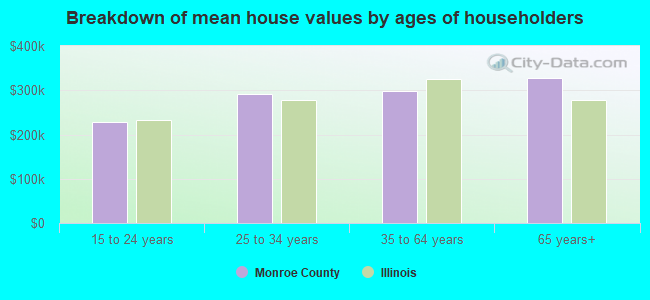
Estimated median house or condo value in 2022: $267,384 (it was $125,900 in 2000)
| Monroe: | $267,384 |
| Illinois: | $251,600 |
Median monthly housing costs for homes and condos with a mortgage: $1,788
Median monthly housing costs for units without a mortgage: $720
Institutionalized population: 327
Crime in 2021 (reported by the sheriff's office or county police, not the county total):
- Murders: 0
- Rapes: 2
- Robberies: 0
- Assaults: 8
- Burglaries: 12
- Thefts: 26
- Auto thefts: 5
Crime in 2020 (reported by the sheriff's office or county police, not the county total):
- Murders: 0
- Rapes: 1
- Robberies: 0
- Assaults: 14
- Burglaries: 18
- Thefts: 31
- Auto thefts: 9
Health of residents in Monroe County based on CDC Behavioral Risk Factor Surveillance System Survey Questionnaires from 2013 to 2021:
General health status score of residents in this county from 1 (poor) to 5 (excellent) is 3.4. This is about average.71.9% of residents exercised in the past month. This is about average.
45.2% of residents smoked 100+ cigarettes in their lives. This is about average.
53.7% of adult residents drank alcohol in the past 30 days. This is less than average.
67.3% of residents visited a dentist within the past year. This is about average.
Average weight of males is 200 pounds. This is more than average.
Average weight of females is 167 pounds. This is more than average.
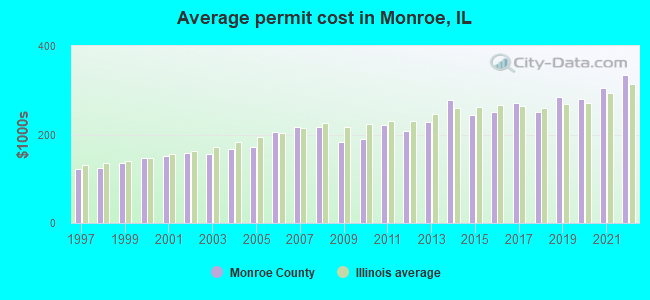
Single-family new house construction building permits:
- 2022: 87 buildings, average cost: $334,400
- 2021: 111 buildings, average cost: $304,500
- 2020: 110 buildings, average cost: $281,000
- 2019: 92 buildings, average cost: $285,400
- 2018: 118 buildings, average cost: $250,300
- 2017: 157 buildings, average cost: $270,600
- 2016: 136 buildings, average cost: $250,400
- 2015: 133 buildings, average cost: $243,900
- 2014: 110 buildings, average cost: $277,500
- 2013: 121 buildings, average cost: $227,900
- 2012: 102 buildings, average cost: $208,200
- 2011: 92 buildings, average cost: $221,700
- 2010: 131 buildings, average cost: $188,800
- 2009: 110 buildings, average cost: $181,500
- 2008: 104 buildings, average cost: $217,200
- 2007: 168 buildings, average cost: $217,300
- 2006: 249 buildings, average cost: $206,400
- 2005: 329 buildings, average cost: $170,600
- 2004: 328 buildings, average cost: $168,300
- 2003: 330 buildings, average cost: $154,800
- 2002: 301 buildings, average cost: $157,500
- 2001: 253 buildings, average cost: $151,600
- 2000: 252 buildings, average cost: $146,400
- 1999: 242 buildings, average cost: $135,200
- 1998: 217 buildings, average cost: $125,000
- 1997: 209 buildings, average cost: $123,100

Median real estate property taxes paid for housing units with mortgages in 2022: $4,572 (1.7%)
Median real estate property taxes paid for housing units with no mortgage in 2022: $3,989 (1.6%)
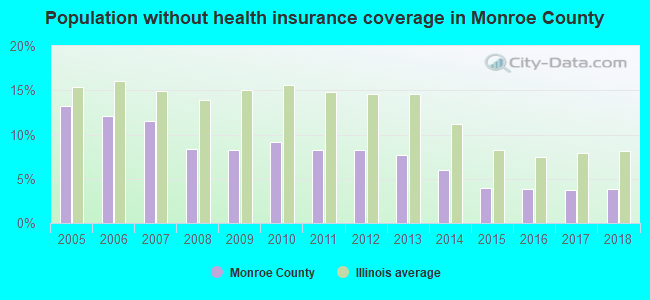
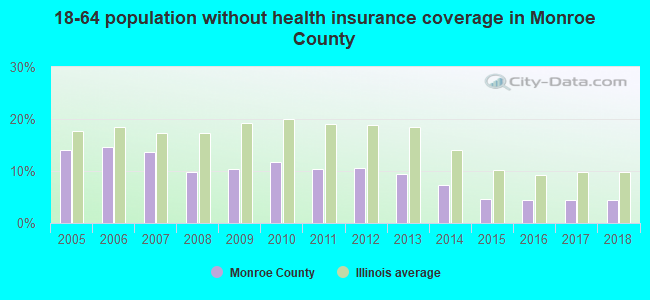
| Monroe County: | 4.4% |
| Illinois: | 11.9% |
Median age of residents in 2022: 42.9 years old
(Males: 42.2 years old, Females: 44.1 years old)
(Median age for: White residents: 43.6 years old, Black residents: 21.5 years old, American Indian residents: 12.0 years old, Asian residents: 37.2 years old, Hispanic or Latino residents: 29.5 years old, Other race residents: 37.5 years old)
Area name: St. Louis, MO-IL HUD Metro FMR Area
Fair market rent in 2006 for a 1-bedroom apartment in Monroe County is $526 a month.
Fair market rent for a 2-bedroom apartment is $654 a month.
Fair market rent for a 3-bedroom apartment is $842 a month.
Cities in this county include: Columbia, Waterloo, Valmeyer, Hecker, Maeystown, Fults.
Notable locations in this county outside city limits:
Notable locations in Monroe County: Ponderosa Picnic Area (A), The Pines Picnic Area (B), Venedy Station (C), Lake View Picnic Area (D), Lazy L Picnic Area (E), Little Bear Camping Area (F), Lookout Point Picnic Area (G), Unverfehrt Stock Farm (H), Bolo Townhall (I), Lively Grove Townhall (J), Pilot Knob Townhall (K), Black Diamond Vineyards (L). Display/hide their locations on the map
Churches in Monroe County include: Saint Anthonys Church (A), Saint Pauls Church (B), Olive Branch Lutheran Church (C). Display/hide their locations on the map
Cemeteries: Verner Family Cemetery (1), Beaucoup Cemetery (2), Bethel Cemetery (3), Brick Cemetery (4), Zetsche Cemetery (5), Zion Cemetery (6), Kennedy Cemetery (7). Display/hide their locations on the map
Lakes and reservoirs: Ashley Lake (A), Grewe Lake (B), Turkey Lake (C), Muddy Lake (D), Swan Lake (E), Lanes Lake (F), Clear Lake (G), Temmes Pond (H). Display/hide their locations on the map
Streams, rivers, and creeks: Coon Creek (A), Sipple Slough (B), Sewer Creek (C), Carson Branch (D), Buckingham Branch (E), Brushy Creek (F), Beaver Pond Creek (G), Back Creek (H), Archie Creek (I). Display/hide their locations on the map
Parks in Monroe County include: Posen Woods Nature Preserve (1), Washington County State Conservation Area (2). Display/hide their locations on the map
Neighboring counties: Bates County, Missouri  , Clay County, West Virginia
  , Bracken County, Kentucky , Posey County, Indiana , Prince William County, Virginia , St. Clair County, Missouri .
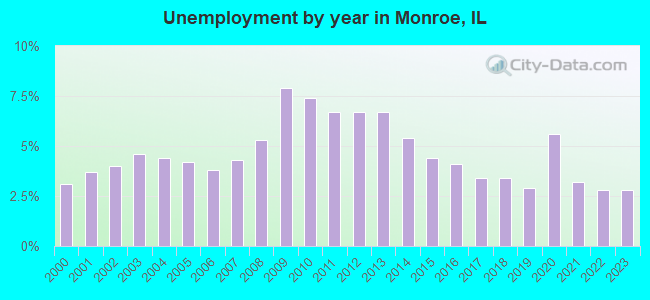
| Here: | 2.8% |
| Illinois: | 4.2% |
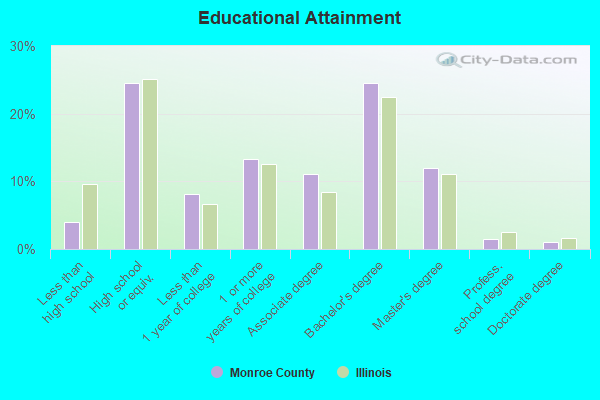
Current college students: 1,344
People 25 years of age or older with a high school degree or higher: 95.7%
People 25 years of age or older with a bachelor's degree or higher: 37.9%
Number of foreign born residents: 405 (86.7% naturalized citizens)
| Monroe County: | 1.2% |
| Whole state: | 14.4% |
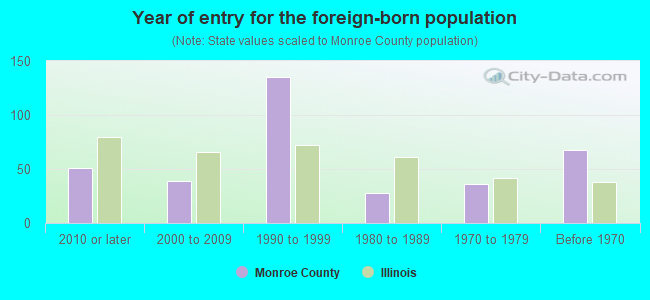
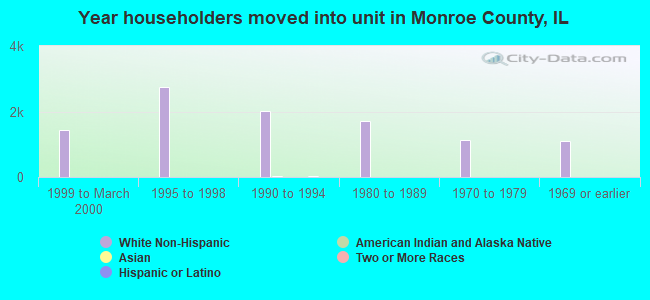
- Year of entry for the foreign-born population
- 512010 or later
- 392000 to 2009
- 1351990 to 1999
- 281980 to 1989
- 361970 to 1979
- 68Before 1970
Mean travel time to work (commute): minutes
Percentage of county residents living and working in this county: 60.2%
Housing units in structures:
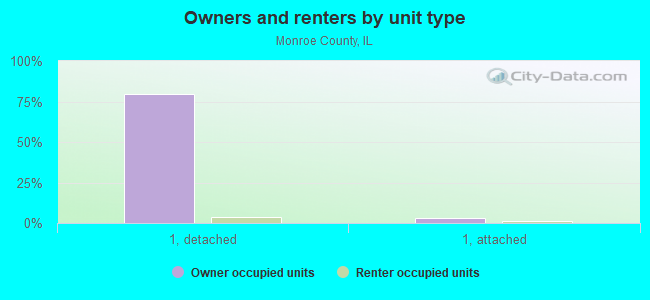
- One, detached: 12,145
- One, attached: 610
- Two: 329
- 3 or 4: 198
- 5 to 9: 699
- 10 to 19: 150
- 20 to 49: 109
- 50 or more: 130
- Mobile homes: 223
Housing units in Monroe County with a mortgage: 6,927 (645 second mortgage, 33 home equity loan, 515 both second mortgage and home equity loan)
Houses without a mortgage: 139
| Here: | 4.1% with mortgage |
| State: | 97.4% with mortgage |
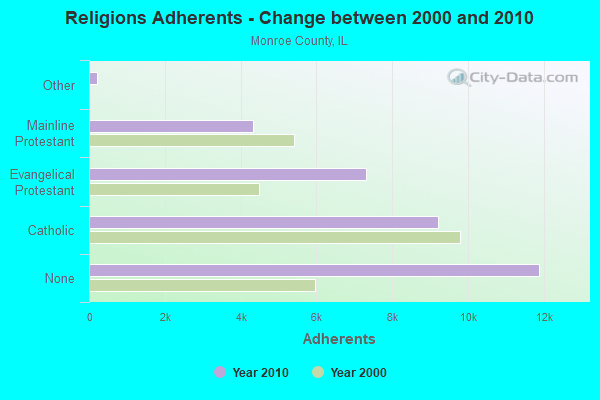
Religion statistics for Monroe County
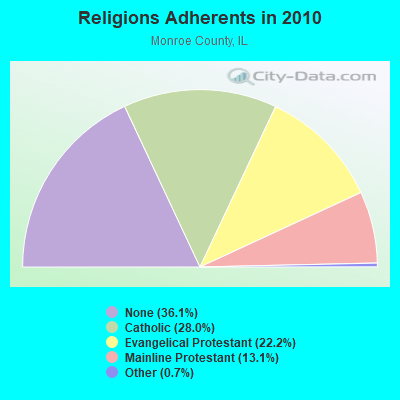
| Religion | Adherents | Congregations |
|---|---|---|
| Catholic | 9,218 | 7 |
| Evangelical Protestant | 7,306 | 19 |
| Mainline Protestant | 4,327 | 9 |
| Other | 217 | 2 |
| None | 11,889 | - |
Source: Clifford Grammich, Kirk Hadaway, Richard Houseal, Dale E.Jones, Alexei Krindatch, Richie Stanley and Richard H.Taylor. 2012. 2010 U.S.Religion Census: Religious Congregations & Membership Study. Association of Statisticians of American Religious Bodies. Jones, Dale E., et al. 2002. Congregations and Membership in the United States 2000. Nashville, TN: Glenmary Research Center.
Food Environment Statistics:
| Monroe County: | 1.24 / 10,000 pop. |
| State: | 2.24 / 10,000 pop. |
| Here: | 0.31 / 10,000 pop. |
| Illinois: | 0.08 / 10,000 pop. |
| This county: | 0.31 / 10,000 pop. |
| Illinois: | 0.75 / 10,000 pop. |
| Monroe County: | 3.09 / 10,000 pop. |
| Illinois: | 2.61 / 10,000 pop. |
| This county: | 7.42 / 10,000 pop. |
| State: | 6.86 / 10,000 pop. |
| Monroe County: | 8.0% |
| Illinois: | 8.3% |
| Monroe County: | 27.1% |
| State: | 25.2% |
| Here: | 14.5% |
| State: | 14.5% |
Agriculture in Monroe County:
Average size of farms: 334 acresAverage value of agricultural products sold per farm: $72,589
Average value of crops sold per acre for harvested cropland: $188.63
The value of nursery, greenhouse, floriculture, and sod as a percentage of the total market value of agricultural products sold: 4.07%
The value of livestock, poultry, and their products as a percentage of the total market value of agricultural products sold: 33.73%
Average total farm production expenses per farm: $63,875
Harvested cropland as a percentage of land in farms: 76.32%
Average market value of all machinery and equipment per farm: $89,100
The percentage of farms operated by a family or individual: 86.82%
Average age of principal farm operators: 54 years
Average number of cattle and calves per 100 acres of all land in farms: 5.55
Milk cows as a percentage of all cattle and calves: 13.72%
Corn for grain: 44678 harvested acres
All wheat for grain: 28480 harvested acres
Soybeans for beans: 64569 harvested acres
Land in orchards: 57 acres
Tornado activity:
Monroe County historical area-adjusted tornado activity is significantly below Illinois state average. It is 1575519.4 times below overall U.S. average.Tornadoes in this county have caused one fatality and 4 injuries recorded between 1950 and 2004.
On 4/5/1985, a category 2 (max. wind speeds 113-157 mph) tornado killed one person and injured 3 people and caused between $50,000 and $500,000 in damages.
Earthquake activity:
Monroe County-area historical earthquake activity is significantly above Illinois state average. It is 330% greater than the overall U.S. average.On 4/18/2008 at 09:36:59, a magnitude 5.4 (5.1 MB, 4.8 MS, 5.4 MW, 5.2 MW, Class: Moderate, Intensity: VI - VII) earthquake occurred 124.4 miles away from Monroe County center
On 4/18/2008 at 09:36:59, a magnitude 5.2 (5.2 MW, Depth: 8.9 mi) earthquake occurred 124.4 miles away from the county center
On 9/26/1990 at 13:18:51, a magnitude 5.0 (4.7 MB, 4.8 LG, 5.0 LG, Depth: 7.7 mi) earthquake occurred 87.7 miles away from the county center
On 6/10/1987 at 23:48:54, a magnitude 5.1 (4.9 MB, 4.4 MS, 4.6 MS, 5.1 LG) earthquake occurred 128.4 miles away from the county center
On 5/4/1991 at 01:18:54, a magnitude 5.0 (4.4 MB, 4.6 LG, 5.0 LG, Depth: 3.1 mi) earthquake occurred 123.6 miles away from Monroe County center
On 6/18/2002 at 17:37:15, a magnitude 5.0 (4.3 MB, 4.6 MW, 5.0 LG) earthquake occurred 132.4 miles away from the county center
Magnitude types: regional Lg-wave magnitude (LG), body-wave magnitude (MB), surface-wave magnitude (MS), moment magnitude (MW)
Most recent natural disasters:
- Illinois Covid-19 Pandemic, Incident Period: January 20, 2020, FEMA Id: 4489, Natural disaster type: Other
- Illinois Severe Storms And Flooding, Incident Period: February 24, 2019 - July 3, 2019, FEMA Id: 4461, Natural disaster type: Storm, Flood
- Illinois Severe Storms, Straight-Line Winds and Flooding, Incident Period: April 16, 2013 to May 05, 2013, Major Disaster (Presidential) Declared DR-4116: May 10, 2013, FEMA Id: 4116, Natural disaster type: Storm, Flood, Wind
- Illinois Severe Storms and Flooding, Incident Period: June 01, 2008 to July 22, 2008, Major Disaster (Presidential) Declared DR-1771: June 24, 2008, FEMA Id: 1771, Natural disaster type: Storm, Flood
- Illinois Severe Winter Storm, Incident Period: November 30, 2006 to December 01, 2006, Major Disaster (Presidential) Declared DR-1681: February 09, 2007, FEMA Id: 1681, Natural disaster type: Winter Storm
- Illinois Hurricane Katrina Evacuation, Incident Period: August 29, 2005 to October 01, 2005, Emergency Declared EM-3230: September 07, 2005, FEMA Id: 3230, Natural disaster type: Hurricane
- Illinois Severe Storms, Tornadoes, and Flooding, Incident Period: April 21, 2002 to May 23, 2002, Major Disaster (Presidential) Declared DR-1416: May 21, 2002, FEMA Id: 1416, Natural disaster type: Storm, Tornado, Flood
- Illinois Severe Storms/Flooding, Incident Period: April 28, 1996 to May 17, 1996, Major Disaster (Presidential) Declared DR-1112: May 06, 1996, FEMA Id: 1112, Natural disaster type: Storm, Flood
- Illinois Severe Storm, Flooding, Incident Period: May 15, 1995 to June 15, 1995, Major Disaster (Presidential) Declared DR-1053: May 30, 1995, FEMA Id: 1053, Natural disaster type: Storm, Flood
- Illinois Severe Storms, Flooding, Incident Period: April 09, 1994 to May 04, 1994, Major Disaster (Presidential) Declared DR-1025: April 26, 1994, FEMA Id: 1025, Natural disaster type: Storm, Flood
- 8 other natural disasters have been reported since 1953.
The number of natural disasters in Monroe County (18) is near the US average (15).
Major Disasters (Presidential) Declared: 15
Emergencies Declared: 1
Causes of natural disasters: Floods: 15, Storms: 14, Tornadoes: 3, Heavy Rain: 1, Hurricane: 1, Wind: 1, Winter Storm: 1, Other: 1 (Note: some incidents may be assigned to more than one category).
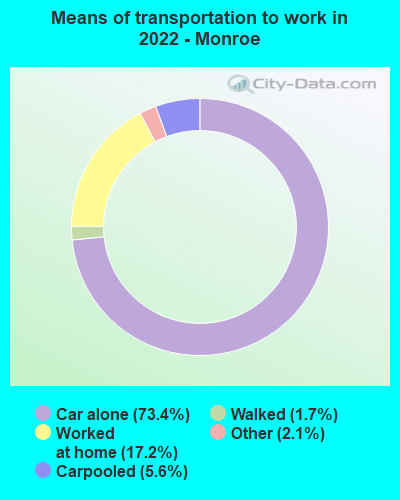
Means of transportation to work:
- Drove a car alone: 7,329 (70.7%)
- Carpooled: 600 (5.8%)
- Taxicab, motorcycle, or other means: 236 (2.3%)
- Walked: 170 (1.6%)
- Worked at home: 2,329 (22.5%)
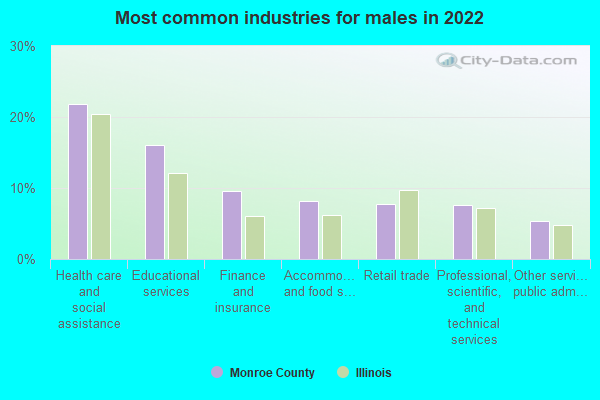
- Health care and social assistance (22%)
- Educational services (16%)
- Finance and insurance (10%)
- Accommodation and food services (8%)
- Retail trade (8%)
- Professional, scientific, and technical services (8%)
- Other services, except public administration (5%)

- Health care and social assistance (24%)
- Educational services (17%)
- Finance and insurance (10%)
- Accommodation and food services (9%)
- Retail trade (8%)
- Professional, scientific, and technical services (8%)
- Other services, except public administration (6%)
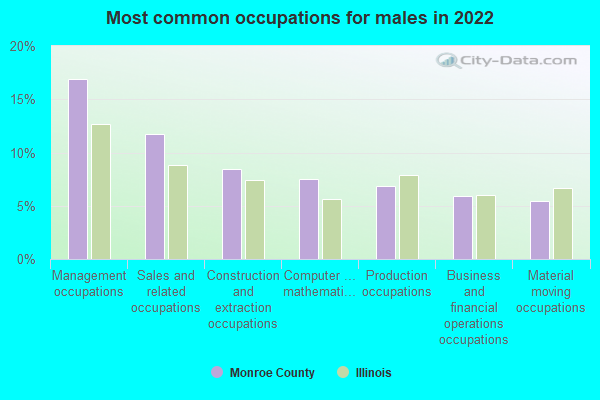
- Management occupations (17%)
- Sales and related occupations (12%)
- Construction and extraction occupations (8%)
- Computer and mathematical occupations (8%)
- Production occupations (7%)
- Business and financial operations occupations (6%)
- Material moving occupations (5%)
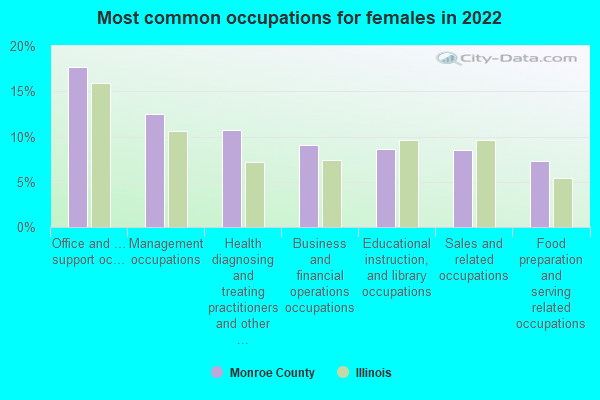
- Office and administrative support occupations (18%)
- Management occupations (12%)
- Health diagnosing and treating practitioners and other technical occupations (11%)
- Business and financial operations occupations (9%)
- Educational instruction, and library occupations (9%)
- Sales and related occupations (9%)
- Food preparation and serving related occupations (7%)
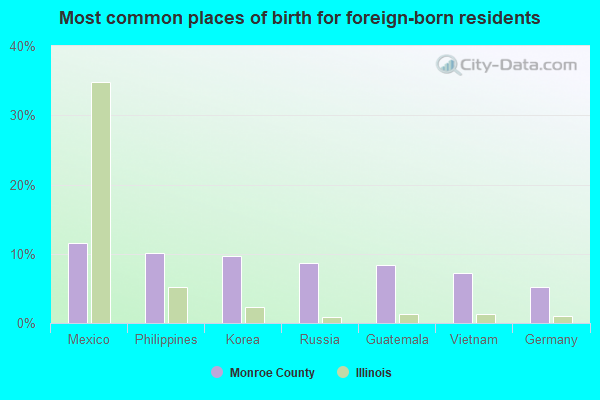
- Mexico (12%)
- Philippines (10%)
- Korea (10%)
- Russia (9%)
- Guatemala (8%)
- Vietnam (7%)
- Germany (5%)
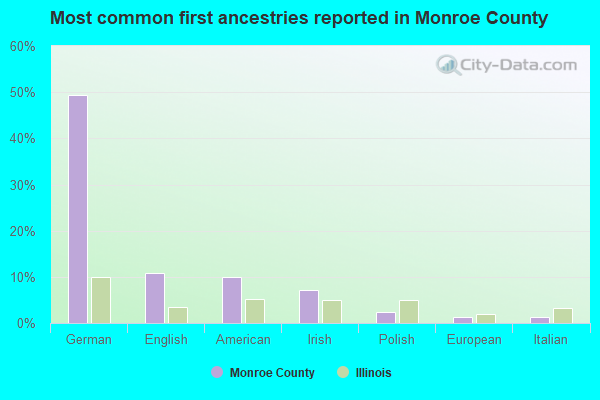
- German (49%)
- English (11%)
- American (10%)
- Irish (7%)
- Polish (2%)
- European (1%)
- Italian (1%)
16 people in group homes intended for adults
People in group quarters in Monroe County, Illinois in 2000:
- 364 people in nursing homes
- 15 people in homes for the mentally retarded
- 5 people in agriculture workers' dormitories on farms
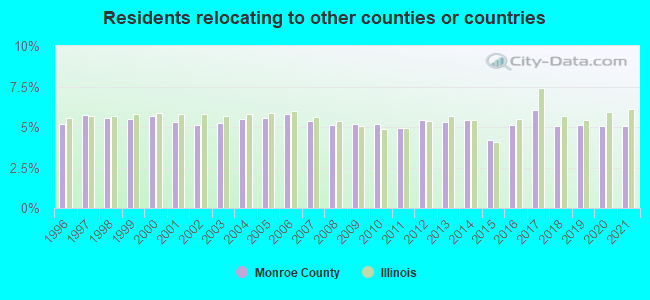
5.20% of this county's 2021 resident taxpayers lived in other counties in 2020 ($69,810 average adjusted gross income)
| Here: | 5.20% |
| Illinois average: | 5.09% |
10 or fewer of this county's residents moved from foreign countries.
2.70% relocated from other counties in Illinois ($33,584 average AGI)
2.51% relocated from other states ($36,227 average AGI)
Monroe County: 2.51% Illinois average: 2.01%

Top counties from which taxpayers relocated into this county between 2020 and 2021:
| from St. Clair County, IL | |
| from St. Louis County, MO | |
| from Madison County, IL | |
| from Randolph County, IL | |
| from St. Louis city, MO | |
| from Jefferson County, MO |
5.05% of this county's 2020 resident taxpayers moved to other counties in 2021 ($72,378 average adjusted gross income)
| Here: | 5.05% |
| Illinois average: | 6.10% |
10 or fewer of this county's residents moved to foreign countries.
2.32% relocated to other counties in Illinois ($26,056 average AGI)
2.73% relocated to other states ($46,323 average AGI)
Monroe County: 2.73% Illinois average: 3.06%
Top counties to which taxpayers relocated from this county between 2020 and 2021:
| to St. Clair County, IL | |
| to St. Louis County, MO | |
| to Randolph County, IL | |
| to St. Louis city, MO | |
| to Jefferson County, MO | |
| to Madison County, IL |
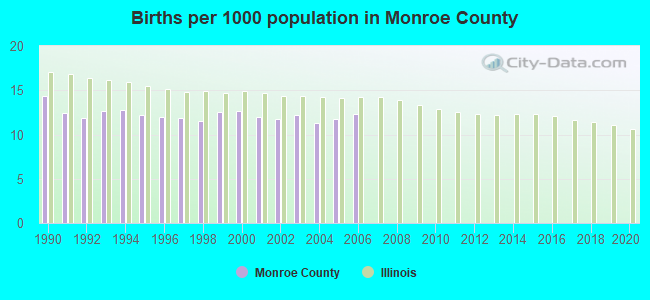
Births per 1000 population from 1990 to 1999: 12.4
Births per 1000 population from 2000 to 2006: 12.0
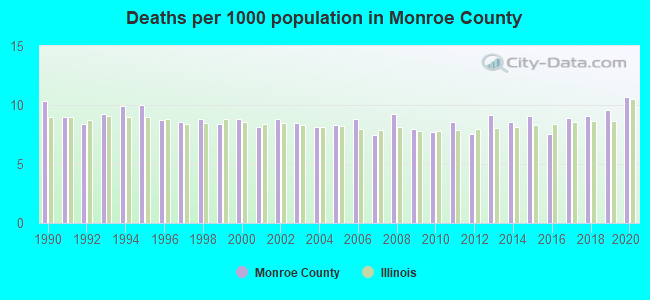
Deaths per 1000 population from 1990 to 1999: 9.1
Deaths per 1000 population from 2000 to 2009: 8.4
Deaths per 1000 population from 2010 to 2020: 8.8
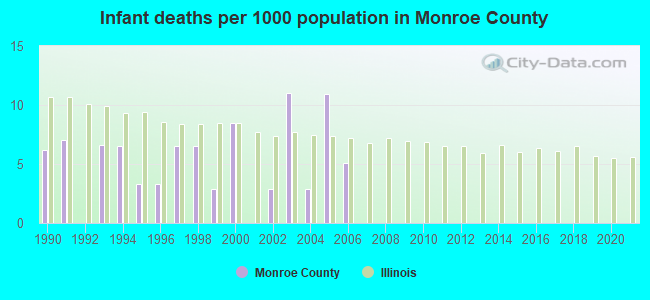
Infant deaths per 1000 live births from 1990 to 1999: 4.9
Infant deaths per 1000 live births from 2000 to 2006: 5.9
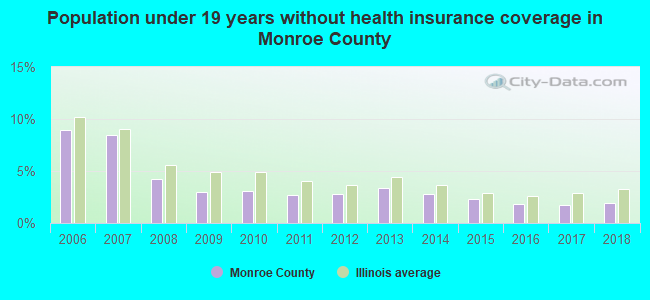
Persons under 19 years old without health insurance coverage in 2018: 1.9%
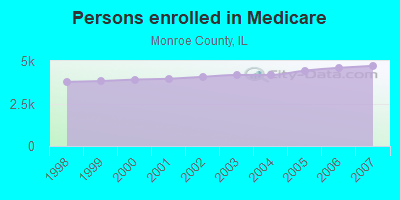
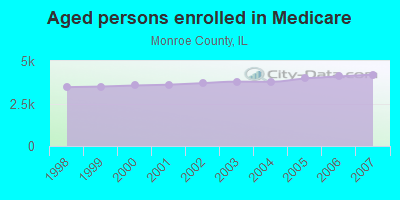
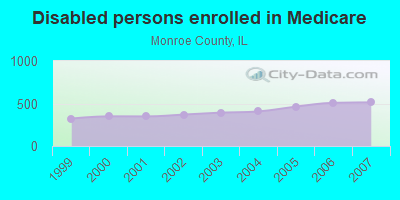
Persons enrolled in hospital insurance and/or supplemental medical insurance (Medicare) in July 1, 2007: 4,715 (4,202 aged, 513 disabled)
Children under 18 without health insurance coverage in 2007: 438 (5%)
Most common underlying causes of death in Monroe County, Illinois in 1999 - 2019:
- Unspecified dementia (402)
- Atherosclerotic heart disease (375)
- Acute myocardial infarction, unspecified (362)
- Bronchus or lung, unspecified - Malignant neoplasms (310)
- Chronic obstructive pulmonary disease, unspecified (219)
- Congestive heart failure (109)
- Alzheimer disease, unspecified (84)
- Stroke, not specified as haemorrhage or infarction (81)
- Breast, unspecified - Malignant neoplasms (20)
- Colon, unspecified - Malignant neoplasms (11)
Population without health insurance coverage in 2000: 7%
Children under 18 without health insurance coverage in 2000: 7%
Medical specialist MDs per 100,000 population in 2005: 796
Dentists per 100,000 population in 1998: 6
Total births per 100,000 population, July 2005 - July 2006 : 38
Total deaths per 100,000 population, July 2005 - July 2006: 84
Limited-service eating places per 100,000 population in 2005 : 19
Beer, wine & liquor stores per 100,000 population in 2005: 1
Household type by relationship:
Households: 34,424- Male householders: 6,833 (1,322 living alone), Female householders: 6,969 (2,005 living alone)
8,162 spouses (8,162 opposite-sex spouses), 778 unmarried partners, (756 opposite-sex unmarried partners), 10,180 children (9,337 natural, 360 adopted, 488 stepchildren), 250 grandchildren, 154 brothers or sisters, 309 parents, 57 foster children, 236 other relatives, 314 non-relatives
- In group quarters: 262
Size of family households: 4,663 2-persons, 2,431 3-persons, 1,859 4-persons, 607 5-persons, 277 6-persons, 83 7-or-more-persons.
Size of nonfamily households: 3,323 1-person, 492 2-persons, 22 3-persons.
5,622 married couples with children.
1,383 single-parent households (410 men, 973 women).
97.3% of residents of Monroe speak English at home.
1.2% of residents speak Spanish at home (75% speak English very well, 19% speak English well, 6% speak English not well).
0.6% of residents speak other Indo-European language at home (100% speak English very well).
0.4% of residents speak Asian or Pacific Island language at home (51% speak English very well, 23% speak English well, 26% speak English not well).
In fiscal year 2004:
Federal Government expenditure: $116,521,000 ($3,821 per capita)
Department of Defense expenditure: $5,569,000
Federal direct payments to individuals for retirement and disability: $68,452,000
Federal other direct payments to individuals: $23,723,000
Federal direct payments not to individuals: $4,515,000
Federal grants: $11,313,000
Federal procurement contracts: $3,949,000 ($2,820,000 Department of Defense)
Federal salaries and wages: $4,569,000 ($0,000 Department of Defense)
Federal Government direct loans: $20,000
Federal guaranteed/insured loans: $22,055,000
Federal Government insurance: $33,302,000
Population change from April 1, 2000 to July 1, 2005:
Births: 1,843| Here: | 59 per 1000 residents |
| State: | 75 per 1000 residents |
Deaths: 1,280
| Here: | 41 per 1000 residents |
| State: | 43 per 1000 residents |
Net international migration: +31
| Here: | +1 per 1000 residents |
| State: | +26 per 1000 residents |
Net internal migration: +2,875
| Here: | |
| State: |
Total withdrawal of fresh water for public supply: 0.17 millions of gallons per day (all from ground)
| Here: | 6.6 |
| State: | 6.4 |
| Here: | 4.2 |
| State: | 4.1 |
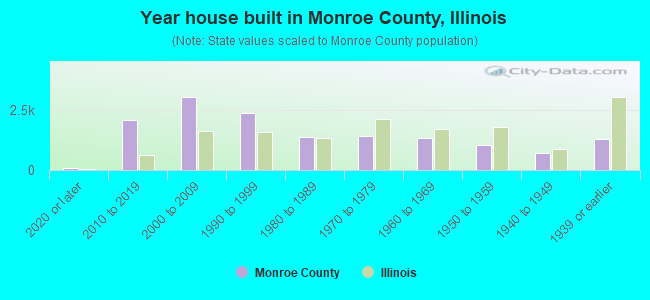
- Year house built in Monroe County, Illinois
- 802020 or later
- 2,1162010 to 2019
- 3,0502000 to 2009
- 2,3881990 to 1999
- 1,3681980 to 1989
- 1,4251970 to 1979
- 1,3561960 to 1969
- 1,0621950 to 1959
- 6931940 to 1949
- 1,2821939 or earlier
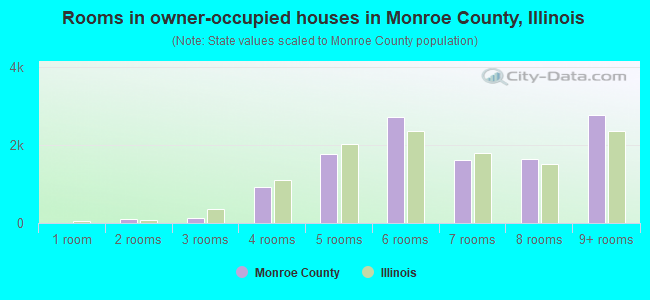
- Rooms in owner-occupied houses in Monroe County, Illinois
- 31 room
- 932 rooms
- 1293 rooms
- 9174 rooms
- 1,7765 rooms
- 2,7106 rooms
- 1,6277 rooms
- 1,6378 rooms
- 2,7719+ rooms
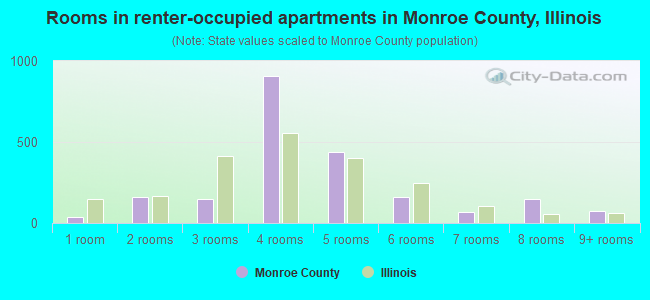
- Rooms in renter-occupied apartments in Monroe County, Illinois
- 401 room
- 1582 rooms
- 1473 rooms
- 9084 rooms
- 4415 rooms
- 1616 rooms
- 657 rooms
- 1488 rooms
- 749+ rooms
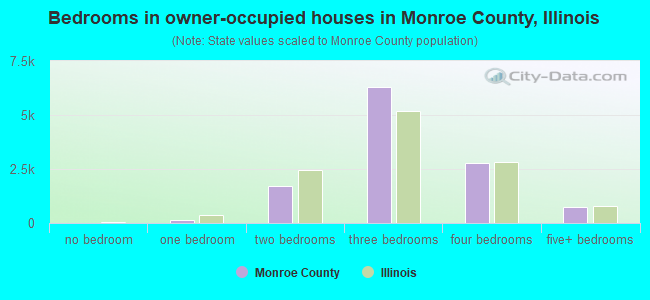
- Bedrooms in owner-occupied houses in Monroe County, Illinois
- 3no bedroom
- 1611 bedroom
- 1,6982 bedrooms
- 6,2823 bedrooms
- 2,7754 bedrooms
- 7435+ bedrooms
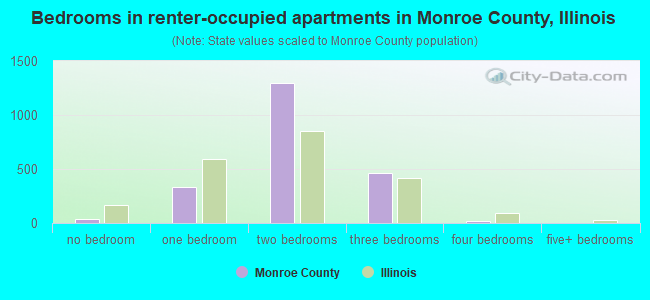
- Bedrooms in renter-occupied apartments in Monroe County, Illinois
- 40no bedroom
- 3301 bedroom
- 1,3002 bedrooms
- 4623 bedrooms
- 224 bedrooms
- 05+ bedrooms
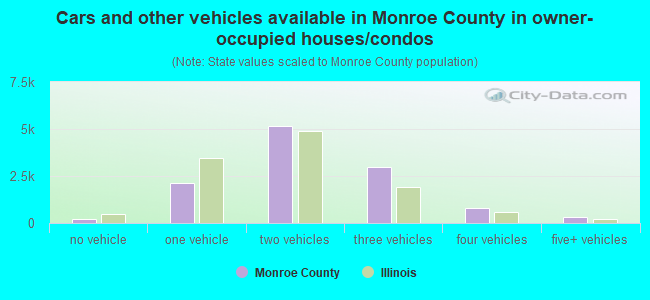
- Cars and other vehicles available in Monroe County in owner-occupied houses/condos
- 209no vehicle
- 2,1111 vehicle
- 5,1702 vehicles
- 2,9923 vehicles
- 7794 vehicles
- 3155+ vehicles
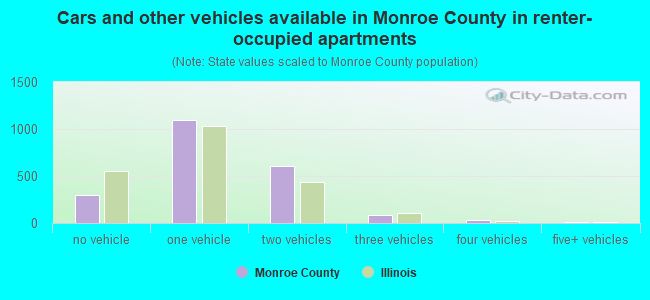
- Cars and other vehicles available in Monroe County in renter-occupied apartments
- 296no vehicle
- 1,0981 vehicle
- 6112 vehicles
- 893 vehicles
- 354 vehicles
- 155+ vehicles
93.6% of Monroe County residents lived in the same house 1 years ago.
Out of people who lived in different houses, 30% lived in this county.
Out of people who lived in different counties, 49% lived in Illinois.
| Monroe County: | 93.6% |
| State average: | 88.3% |
Place of birth for U.S.-born residents:
- This state: 18,738
- Other state: 15,136
- Northeast: 375
- Midwest: 12,481
- South: 1,721
- West: 640
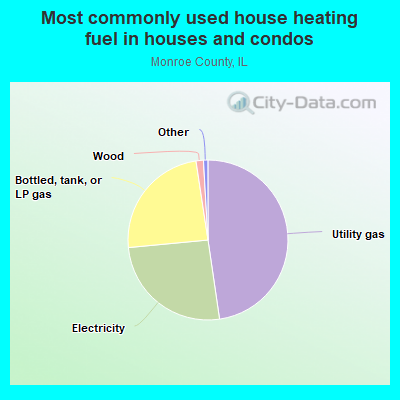
- 47.7%Utility gas
- 25.8%Electricity
- 24.1%Bottled, tank, or LP gas
- 1.5%Wood
- 0.4%No fuel used
- 0.4%Other fuel
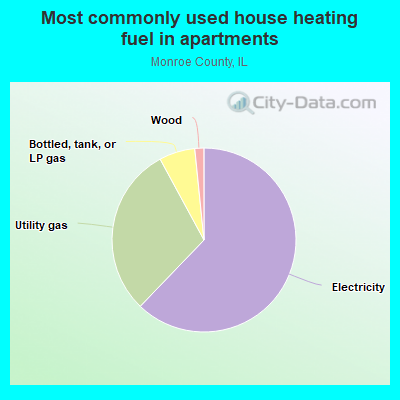
- 62.2%Electricity
- 29.9%Utility gas
- 6.3%Bottled, tank, or LP gas
- 1.6%Wood
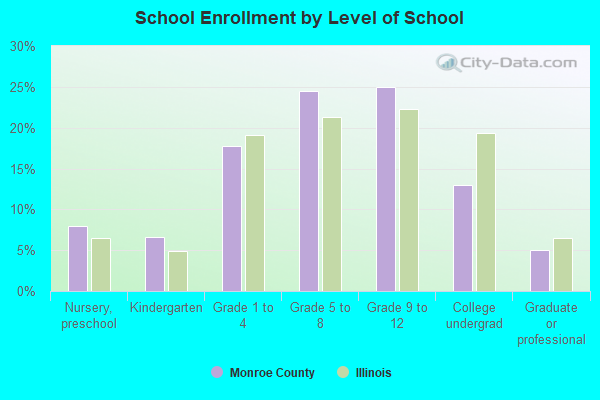
Private vs. public school enrollment:
| Here: | 16.5% |
| Illinois: | 13.3% |
| Here: | 14.8% |
| Illinois: | 9.9% |
| Here: | 33.5% |
| Illinois: | 27.4% |
Monroe County government finances - Expenditure in 2018:
- Charges - Other: $13,923,000
- Construction - Regular Highways: $827,000
- Current Operations - Health - Other: $9,774,000
Police Protection: $4,740,000
General - Other: $4,686,000
Regular Highways: $3,254,000
Central Staff Services: $2,921,000
General Public Buildings: $1,760,000
Judicial and Legal Services: $814,000
Financial Administration: $25,000
- General - Interest on Debt: $207,000
- Intergovernmental to Local - Other - General - Other: $2,125,000
Other - Regular Highways: $14,000
- Local Intergovernmental - Other: $704,000
Highways: $542,000
- Long Term Debt - Beginning Outstanding - Unspecified Public Purpose: $9,060,000
Outstanding Unspecified Public Purpose: $7,795,000
Retired Unspecified Public Purpose: $1,272,000
Issue, Unspecified Public Purpose: $7,000
- Miscellaneous - General Revenue - Other: $1,857,000
Fines and Forfeits: $160,000
Interest Earnings: $41,000
Sale of Property: $13,000
- Other Capital Outlay - Regular Highways: $112,000
- Other Funds - Cash and Securities: $19,381,000
- State Intergovernmental - General Local Government Support: $3,483,000
Highways: $613,000
- Tax - Property: $7,982,000
Other: $81,000
- Total Salaries and Wages: $12,115,000
Monroe County government finances - Revenue in 2018:
- Charges - Other: $13,923,000
- Construction - Regular Highways: $827,000
- Current Operations - Health - Other: $9,774,000
Police Protection: $4,740,000
General - Other: $4,686,000
Regular Highways: $3,254,000
Central Staff Services: $2,921,000
General Public Buildings: $1,760,000
Judicial and Legal Services: $814,000
Financial Administration: $25,000
- General - Interest on Debt: $207,000
- Intergovernmental to Local - Other - General - Other: $2,125,000
Other - Regular Highways: $14,000
- Local Intergovernmental - Other: $704,000
Highways: $542,000
- Long Term Debt - Beginning Outstanding - Unspecified Public Purpose: $9,060,000
Outstanding Unspecified Public Purpose: $7,795,000
Retired Unspecified Public Purpose: $1,272,000
Issue, Unspecified Public Purpose: $7,000
- Miscellaneous - General Revenue - Other: $1,857,000
Fines and Forfeits: $160,000
Interest Earnings: $41,000
Sale of Property: $13,000
- Other Capital Outlay - Regular Highways: $112,000
- Other Funds - Cash and Securities: $19,381,000
- State Intergovernmental - General Local Government Support: $3,483,000
Highways: $613,000
- Tax - Property: $7,982,000
Other: $81,000
- Total Salaries and Wages: $12,115,000
Monroe County government finances - Debt in 2018:
- Charges - Other: $13,923,000
- Construction - Regular Highways: $827,000
- Current Operations - Health - Other: $9,774,000
Police Protection: $4,740,000
General - Other: $4,686,000
Regular Highways: $3,254,000
Central Staff Services: $2,921,000
General Public Buildings: $1,760,000
Judicial and Legal Services: $814,000
Financial Administration: $25,000
- General - Interest on Debt: $207,000
- Intergovernmental to Local - Other - General - Other: $2,125,000
Other - Regular Highways: $14,000
- Local Intergovernmental - Other: $704,000
Highways: $542,000
- Long Term Debt - Beginning Outstanding - Unspecified Public Purpose: $9,060,000
Outstanding Unspecified Public Purpose: $7,795,000
Retired Unspecified Public Purpose: $1,272,000
Issue, Unspecified Public Purpose: $7,000
- Miscellaneous - General Revenue - Other: $1,857,000
Fines and Forfeits: $160,000
Interest Earnings: $41,000
Sale of Property: $13,000
- Other Capital Outlay - Regular Highways: $112,000
- Other Funds - Cash and Securities: $19,381,000
- State Intergovernmental - General Local Government Support: $3,483,000
Highways: $613,000
- Tax - Property: $7,982,000
Other: $81,000
- Total Salaries and Wages: $12,115,000
Monroe County government finances - Cash and Securities in 2018:
- Charges - Other: $13,923,000
- Construction - Regular Highways: $827,000
- Current Operations - Health - Other: $9,774,000
Police Protection: $4,740,000
General - Other: $4,686,000
Regular Highways: $3,254,000
Central Staff Services: $2,921,000
General Public Buildings: $1,760,000
Judicial and Legal Services: $814,000
Financial Administration: $25,000
- General - Interest on Debt: $207,000
- Intergovernmental to Local - Other - General - Other: $2,125,000
Other - Regular Highways: $14,000
- Local Intergovernmental - Other: $704,000
Highways: $542,000
- Long Term Debt - Beginning Outstanding - Unspecified Public Purpose: $9,060,000
Outstanding Unspecified Public Purpose: $7,795,000
Retired Unspecified Public Purpose: $1,272,000
Issue, Unspecified Public Purpose: $7,000
- Miscellaneous - General Revenue - Other: $1,857,000
Fines and Forfeits: $160,000
Interest Earnings: $41,000
Sale of Property: $13,000
- Other Capital Outlay - Regular Highways: $112,000
- Other Funds - Cash and Securities: $19,381,000
- State Intergovernmental - General Local Government Support: $3,483,000
Highways: $613,000
- Tax - Property: $7,982,000
Other: $81,000
- Total Salaries and Wages: $12,115,000
Supplemental Security Income (SSI) in 2006:
- Total number of recipients: 153
- Number of aged recipients: 7
- Number of blind and disabled recipients: 146
- Number of recipients under 18: 25
- Number of recipients between 18 and 64: 110
- Number of recipients older than 64: 18
- Number of recipients also receiving OASDI: 55
- Amount of payments (thousands of dollars): 65
| Most common first names in Monroe County, IL among deceased individuals | ||
| Name | Count | Lived (average) |
|---|---|---|
| William | 156 | 77.1 years |
| Mary | 131 | 80.9 years |
| John | 127 | 76.2 years |
| Robert | 97 | 72.1 years |
| Charles | 96 | 77.3 years |
| Henry | 87 | 80.5 years |
| George | 82 | 78.1 years |
| Anna | 77 | 84.5 years |
| Helen | 77 | 81.8 years |
| Walter | 72 | 79.1 years |
| Most common last names in Monroe County, IL among deceased individuals | ||
| Last name | Count | Lived (average) |
|---|---|---|
| Mueller | 82 | 79.9 years |
| Schmidt | 59 | 78.9 years |
| Schneider | 51 | 80.9 years |
| Stumpf | 46 | 82.7 years |
| Vogt | 43 | 81.0 years |
| Hoffmann | 37 | 80.5 years |
| Miller | 35 | 72.5 years |
| Goeddel | 31 | 79.6 years |
| Meyer | 30 | 82.2 years |
| Hoffman | 27 | 82.0 years |
| Businesses in Monroe County, IL | ||||
| Name | Count | Name | Count | |
|---|---|---|---|---|
| AT&T | 3 | MasterBrand Cabinets | 4 | |
| Ace Hardware | 2 | McDonald's | 2 | |
| Applebee's | 1 | Payless | 1 | |
| Arby's | 1 | Pizza Hut | 2 | |
| AutoZone | 1 | Quiznos | 2 | |
| Burger King | 1 | RadioShack | 1 | |
| CVS | 1 | SONIC Drive-In | 2 | |
| Chevrolet | 1 | Sears | 1 | |
| Circle K | 1 | Sprint Nextel | 1 | |
| Curves | 1 | Subway | 2 | |
| Dairy Queen | 2 | Super 8 | 1 | |
| Dennys | 1 | T-Mobile | 2 | |
| Fashion Bug | 1 | Taco Bell | 2 | |
| FedEx | 3 | The Room Place | 1 | |
| H&R Block | 2 | U-Haul | 3 | |
| Hardee's | 1 | UPS | 4 | |
| Hilton | 1 | Walgreens | 2 | |
| Jimmy John's | 1 | Walmart | 1 | |
| KFC | 1 | YMCA | 1 | |
| Lane Furniture | 1 | |||