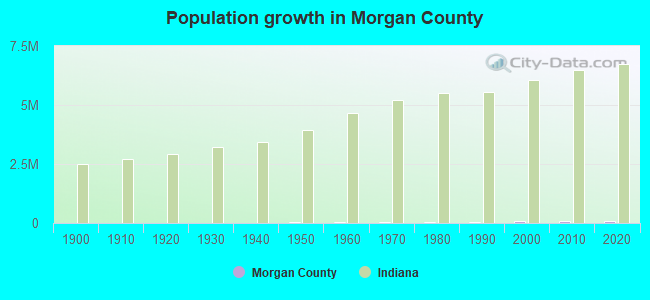
Morgan County, Indiana (IN)
County owner-occupied free and clear houses and condos in 2010: 5,092
County owner-occupied houses and condos in 2000: 19,472
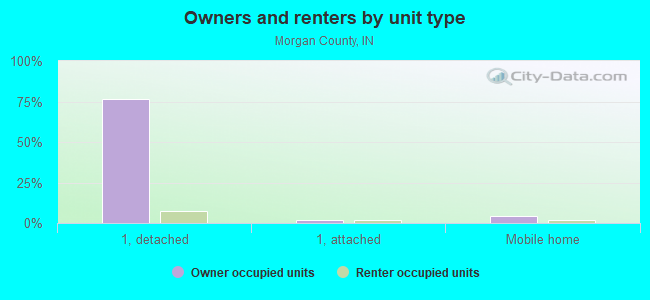
Renter-occupied apartments: 5,743 (it was 4,965 in 2000)
| % of renters here: | 20% |
| State: | 30% |
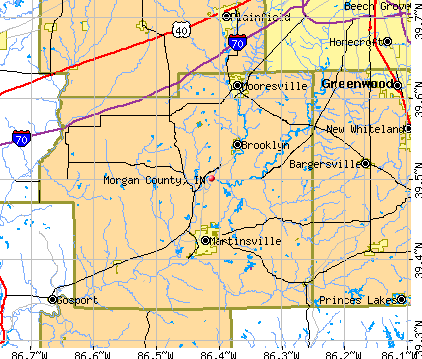
Land area: 406 sq. mi.
Water area: 2.9 sq. mi.
Population density: 178 people per square mile (high).
Industries providing employment: Educational, health and social services (18.8%), Manufacturing (13.8%), Construction (11.6%), Transportation and warehousing,and utilities (11.2%), Professional, scientific, management, administrative, and waste management services (11.1%).
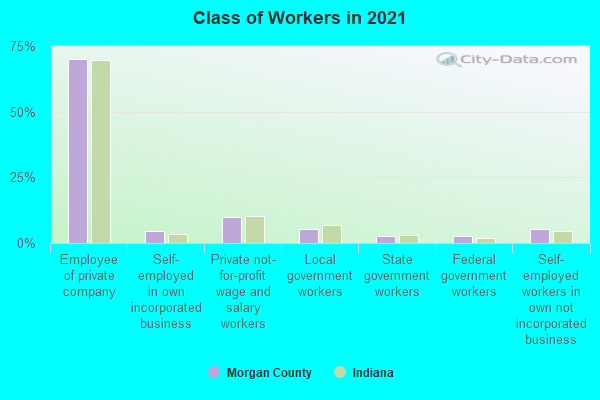
Type of workers:
- Private wage or salary: 83%
- Government: 11%
- Self-employed, not incorporated: 6%
- Unpaid family work: 0%
- OSM Map
- General Map
- Google Map
- MSN Map

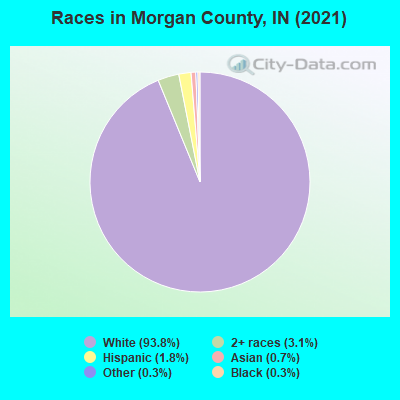
- 67,31693.8%White Non-Hispanic Alone
- 1,9462.7%Two or more races
- 1,3801.9%Hispanic or Latino
- 4430.6%Asian alone
- 3340.5%Black Non-Hispanic Alone
- 3310.5%Some other race alone
- 110.02%American Indian and Alaska Native alone
| Median resident age: | 41.8 years |
| Indiana median age: | 38.2 years |
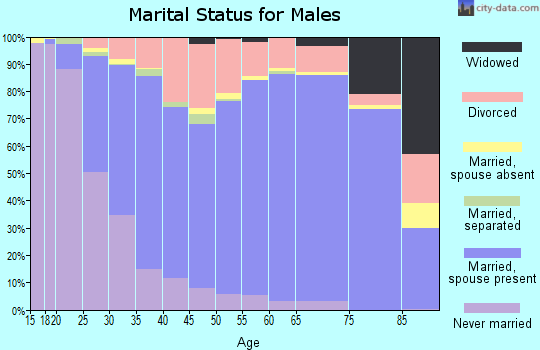
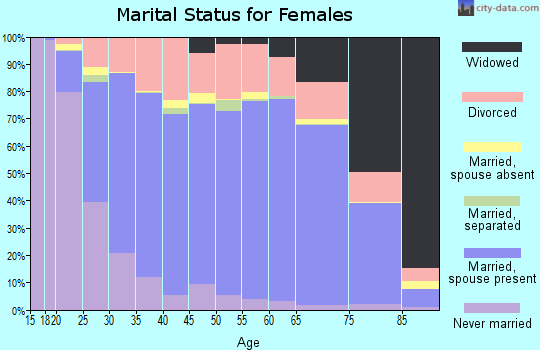
| Males: 36,001 | |
| Females: 36,235 |

 | Indiana Pictures. (6 replies) |
| Best Part Of Rural Indiana To Live? (28 replies) |
| What To Do In Indiana (13 replies) |
| Bloomington Indiana (30 replies) |
| Considering a job transfer from Anchorage airport to Indianapolis airport (13 replies) |
| Indianapolis's population estimates are out! (154 replies) |
| Morgan County: | 2.0 people |
| Indiana: | 3 people |
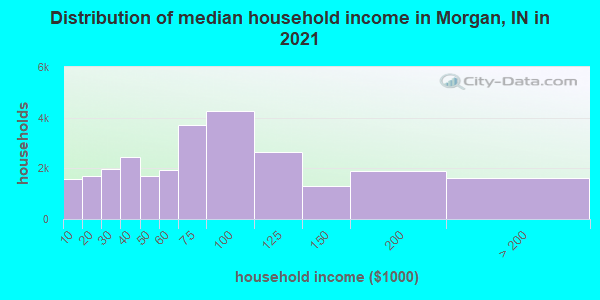
Estimated median household income in 2022: $75,344 ($47,739 in 1999)
| This county: | $75,344 |
| Indiana: | $66,785 |
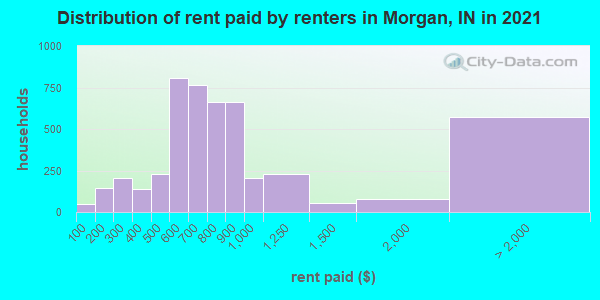
Median contract rent in 2022 for apartments: $770 (lower quartile is $561, upper quartile is $905)
| This county: | $770 |
| State: | $780 |
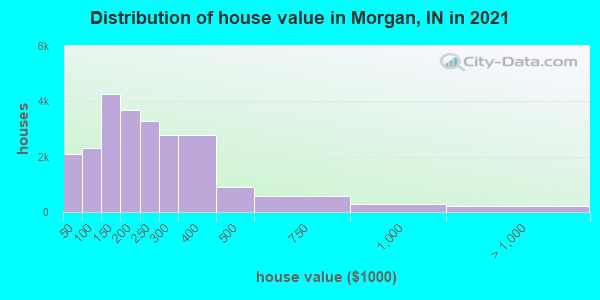
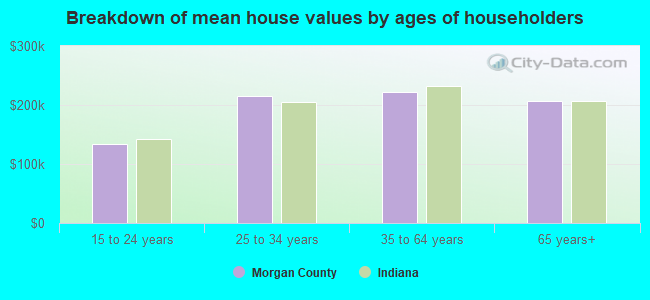
Estimated median house or condo value in 2022: $228,900 (it was $114,400 in 2000)
| Morgan: | $228,900 |
| Indiana: | $208,700 |
Median monthly housing costs for homes and condos with a mortgage: $1,380
Median monthly housing costs for units without a mortgage: $490
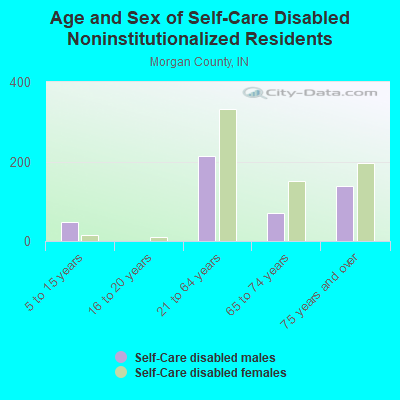
Institutionalized population: 512
Crime in 1996 (reported by the sheriff's office or county police, not the county total):
- Murders: 0
- Rapes: 0
- Robberies: 0
- Assaults: 8
- Burglaries: 32
- Thefts: 46
- Auto thefts: 4
Health of residents in Morgan County based on CDC Behavioral Risk Factor Surveillance System Survey Questionnaires from 2013 to 2021:
General health status score of residents in this county from 1 (poor) to 5 (excellent) is 3.4. This is about average.69.9% of residents exercised in the past month. This is less than average.
43.0% of residents smoked 100+ cigarettes in their lives. This is about average.
49.9% of adult residents drank alcohol in the past 30 days. This is less than average.
68.8% of residents visited a dentist within the past year. This is about average.
Average weight of males is 200 pounds. This is more than average.
Average weight of females is 166 pounds. This is about average.
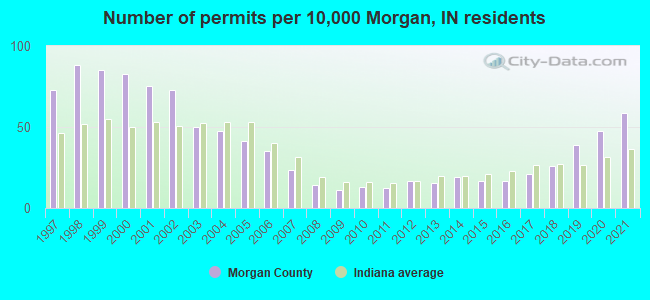
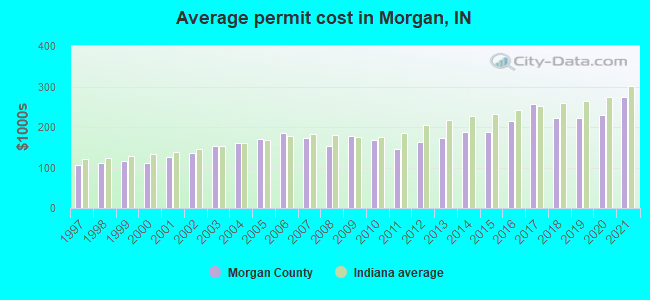
Single-family new house construction building permits:
- 2022: 302 buildings, average cost: $278,300
- 2021: 392 buildings, average cost: $274,400
- 2020: 319 buildings, average cost: $229,900
- 2019: 261 buildings, average cost: $220,800
- 2018: 173 buildings, average cost: $221,900
- 2017: 142 buildings, average cost: $257,400
- 2016: 112 buildings, average cost: $215,200
- 2015: 110 buildings, average cost: $187,700
- 2014: 127 buildings, average cost: $188,400
- 2013: 102 buildings, average cost: $171,500
- 2012: 112 buildings, average cost: $162,700
- 2011: 84 buildings, average cost: $145,400
- 2010: 85 buildings, average cost: $166,600
- 2009: 75 buildings, average cost: $177,100
- 2008: 95 buildings, average cost: $152,400
- 2007: 155 buildings, average cost: $173,000
- 2006: 233 buildings, average cost: $184,600
- 2005: 275 buildings, average cost: $169,800
- 2004: 317 buildings, average cost: $160,200
- 2003: 332 buildings, average cost: $153,000
- 2002: 485 buildings, average cost: $137,100
- 2001: 502 buildings, average cost: $124,700
- 2000: 551 buildings, average cost: $112,200
- 1999: 570 buildings, average cost: $115,800
- 1998: 589 buildings, average cost: $109,500
- 1997: 486 buildings, average cost: $107,300
Median real estate property taxes paid for housing units with mortgages in 2022: $1,122 (0.5%)
Median real estate property taxes paid for housing units with no mortgage in 2022: $956 (0.4%)
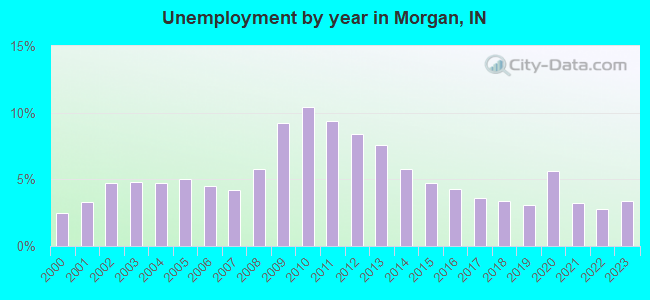
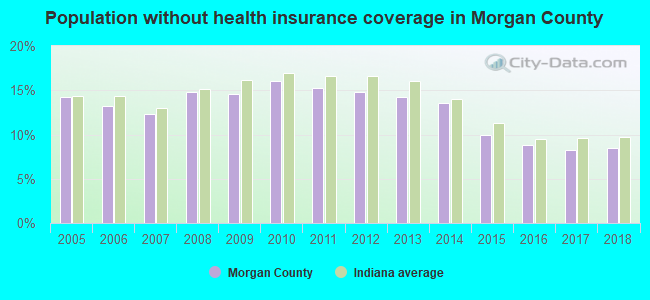
| Morgan County: | 8.2% |
| Indiana: | 12.6% |
Median age of residents in 2022: 41.8 years old
(Males: 41.0 years old, Females: 42.8 years old)
(Median age for: White residents: 42.7 years old, Black residents: 14.1 years old, Asian residents: 33.6 years old, Hispanic or Latino residents: 34.6 years old, Other race residents: 54.2 years old)
Area name: Indianapolis, IN HUD Metro FMR Area
Fair market rent in 2006 for a 1-bedroom apartment in Morgan County is $567 a month.
Fair market rent for a 2-bedroom apartment is $673 a month.
Fair market rent for a 3-bedroom apartment is $871 a month.
Cities in this county include: Martinsville, Mooresville, Brooklyn, Morgantown, Painted Hills, Paragon, Monrovia, Bethany.
Neighboring counties: Rush County  .
.
| Here: | 2.5% |
| Indiana: | 2.8% |
Current college students: 1,800
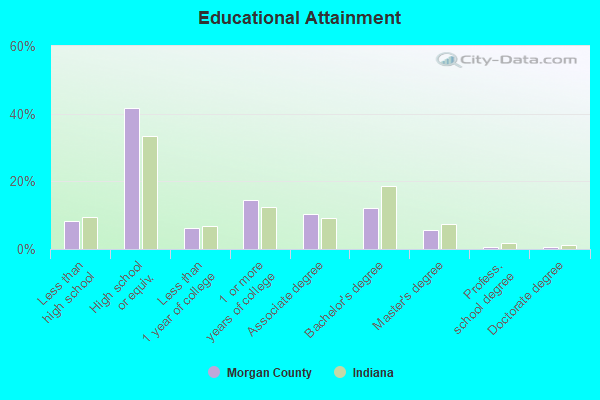
People 25 years of age or older with a high school degree or higher: 92.1%
People 25 years of age or older with a bachelor's degree or higher: 23.5%
Number of foreign born residents: 852 (49.1% naturalized citizens)
| Morgan County: | 1.2% |
| Whole state: | 6.1% |
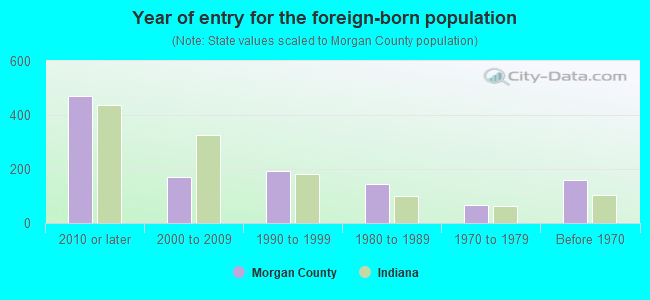
- Year of entry for the foreign-born population
- 3062010 or later
- 2052000 to 2009
- 1811990 to 1999
- 1451980 to 1989
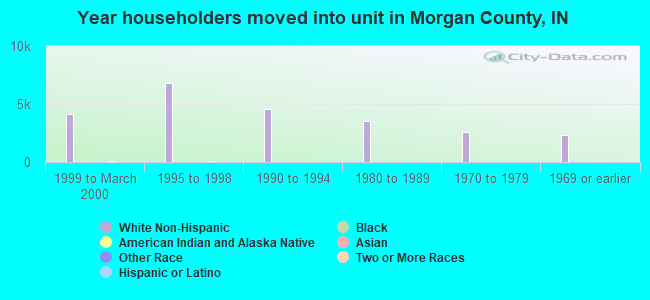
- 681970 to 1979
- 161Before 1970
Mean travel time to work (commute): minutes
Percentage of county residents living and working in this county: 99.6%
Housing units in structures:
- One, detached: 25,260
- One, attached: 539
- Two: 691
- 3 or 4: 1,214
- 5 to 9: 267
- 10 to 19: 272
- 20 to 49: 82
- 50 or more: 189
- Mobile homes: 1,607
Housing units in Morgan County with a mortgage: 13,482 (1,273 second mortgage, 145 home equity loan, 987 both second mortgage and home equity loan)
Houses without a mortgage: 587
| Here: | 2.2% with mortgage |
| State: | 96.6% with mortgage |
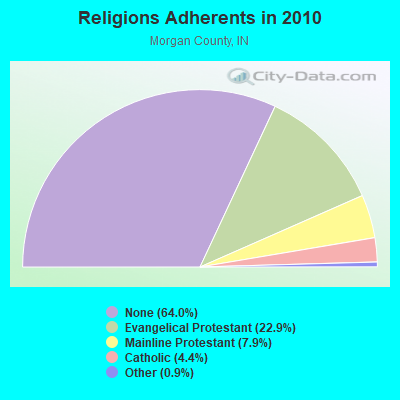
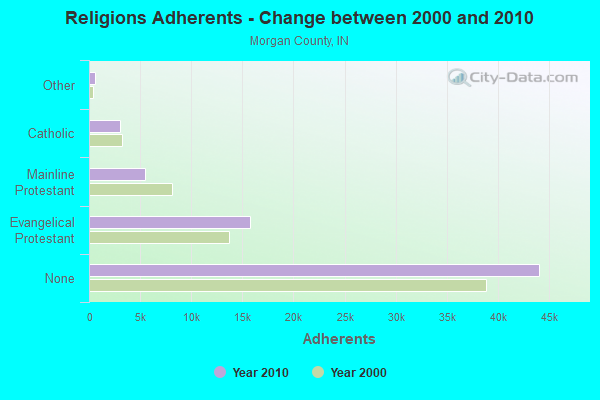
Religion statistics for Morgan County
| Religion | Adherents | Congregations |
|---|---|---|
| Evangelical Protestant | 15,772 | 72 |
| Mainline Protestant | 5,458 | 25 |
| Catholic | 3,003 | 2 |
| Other | 602 | 3 |
| None | 44,059 | - |
Source: Clifford Grammich, Kirk Hadaway, Richard Houseal, Dale E.Jones, Alexei Krindatch, Richie Stanley and Richard H.Taylor. 2012. 2010 U.S.Religion Census: Religious Congregations & Membership Study. Association of Statisticians of American Religious Bodies. Jones, Dale E., et al. 2002. Congregations and Membership in the United States 2000. Nashville, TN: Glenmary Research Center.
Food Environment Statistics:
| Morgan County: | 1.15 / 10,000 pop. |
| State: | 1.73 / 10,000 pop. |
| This county: | 0.29 / 10,000 pop. |
| Indiana: | 0.50 / 10,000 pop. |
| Morgan County: | 4.30 / 10,000 pop. |
| Indiana: | 3.57 / 10,000 pop. |
| This county: | 3.87 / 10,000 pop. |
| State: | 6.78 / 10,000 pop. |
| Morgan County: | 8.9% |
| Indiana: | 9.2% |
| Morgan County: | 29.2% |
| State: | 29.0% |
| Here: | 13.7% |
| State: | 14.3% |
Agriculture in Morgan County:
Average size of farms: 162 acresAverage value of agricultural products sold per farm: $36,679
Average value of crops sold per acre for harvested cropland: $243.83
The value of nursery, greenhouse, floriculture, and sod as a percentage of the total market value of agricultural products sold: 0.09%
The value of livestock, poultry, and their products as a percentage of the total market value of agricultural products sold: 22.14%
Average total farm production expenses per farm: $41,954
Harvested cropland as a percentage of land in farms: 72.41%
Average market value of all machinery and equipment per farm: $55,085
The percentage of farms operated by a family or individual: 89.13%
Average age of principal farm operators: 55 years
Average number of cattle and calves per 100 acres of all land in farms: 5.22
Milk cows as a percentage of all cattle and calves: 4.47%
Corn for grain: 36447 harvested acres
All wheat for grain: 1036 harvested acres
Soybeans for beans: 37113 harvested acres
Vegetables: 173 harvested acres
Land in orchards: 328 acres
Earthquake activity:
Morgan County-area historical earthquake activity is significantly above Indiana state average. It is 98% greater than the overall U.S. average.On 4/18/2008 at 09:36:59, a magnitude 5.4 (5.1 MB, 4.8 MS, 5.4 MW, 5.2 MW, Class: Moderate, Intensity: VI - VII) earthquake occurred 107.3 miles away from Morgan County center
On 4/18/2008 at 09:36:59, a magnitude 5.2 (5.2 MW, Depth: 8.9 mi) earthquake occurred 107.4 miles away from the county center
On 6/10/1987 at 23:48:54, a magnitude 5.1 (4.9 MB, 4.4 MS, 4.6 MS, 5.1 LG) earthquake occurred 91.8 miles away from the county center
On 7/27/1980 at 18:52:21, a magnitude 5.2 (5.1 MB, 4.7 MS, 5.0 UK, 5.2 UK) earthquake occurred 160.3 miles away from the county center
On 6/18/2002 at 17:37:15, a magnitude 5.0 (4.3 MB, 4.6 MW, 5.0 LG) earthquake occurred 128.0 miles away from Morgan County center
On 4/18/2008 at 15:14:16, a magnitude 4.8 (4.5 MB, 4.8 MW, 4.6 MW, Class: Light, Intensity: IV - V) earthquake occurred 104.7 miles away from the county center
Magnitude types: regional Lg-wave magnitude (LG), body-wave magnitude (MB), surface-wave magnitude (MS), moment magnitude (MW)
Most recent natural disasters:
- Indiana Covid-19 Pandemic, Incident Period: January 31, 2020, FEMA Id: 4515, Natural disaster type: Other
- Indiana Severe Winter Storm and Snowstorm, Incident Period: January 05, 2014 to January 09, 2014, Major Disaster (Presidential) Declared DR-4173: April 22, 2014, FEMA Id: 4173, Natural disaster type: Snowstorm, Winter Storm
- Indiana Severe Storms and Flooding, Incident Period: May 30, 2008 to June 27, 2008, Major Disaster (Presidential) Declared DR-1766: June 08, 2008, FEMA Id: 1766, Natural disaster type: Storm, Flood
- Indiana Hurricane Katrina Evacuation, Incident Period: August 29, 2005 to October 01, 2005, Emergency Declared EM-3238: September 10, 2005, FEMA Id: 3238, Natural disaster type: Hurricane
- Indiana Severe Winter Storms and Flooding, Incident Period: January 01, 2005 to February 11, 2005, Major Disaster (Presidential) Declared DR-1573: January 21, 2005, FEMA Id: 1573, Natural disaster type: Winter Storm, Flood
- Indiana Snow, Incident Period: December 21, 2004 to December 23, 2004, Emergency Declared EM-3197: January 11, 2005, FEMA Id: 3197, Natural disaster type: Snow
- Indiana Severe Storms, Tornadoes, and Flooding, Incident Period: May 25, 2004 to June 25, 2004, Major Disaster (Presidential) Declared DR-1520: June 03, 2004, FEMA Id: 1520, Natural disaster type: Storm, Tornado, Flood
- Indiana Severe Storms, Tornadoes, and Flooding, Incident Period: August 26, 2003 to September 15, 2003, Major Disaster (Presidential) Declared DR-1487: September 05, 2003, FEMA Id: 1487, Natural disaster type: Storm, Tornado, Flood
- Indiana Severe Storms, Tornadoes, and Flooding, Incident Period: July 04, 2003 to August 06, 2003, Major Disaster (Presidential) Declared DR-1476: July 11, 2003, FEMA Id: 1476, Natural disaster type: Storm, Tornado, Flood
- Indiana Severe Storms and Tornadoes, Incident Period: September 20, 2002, Major Disaster (Presidential) Declared DR-1433: September 25, 2002, FEMA Id: 1433, Natural disaster type: Storm, Tornado
- 4 other natural disasters have been reported since 1953.
The number of natural disasters in Morgan County (14) is near the US average (15).
Major Disasters (Presidential) Declared: 10
Emergencies Declared: 3
Causes of natural disasters: Floods: 7, Storms: 7, Tornadoes: 4, Winter Storms: 3, Blizzard: 1, Hurricane: 1, Snow: 1, Snowstorm: 1, Other: 1 (Note: some incidents may be assigned to more than one category).
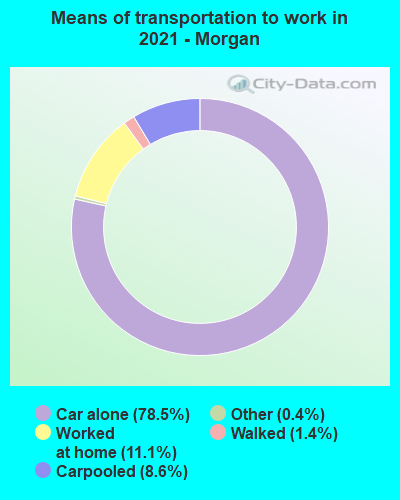
Means of transportation to work:
- Drove a car alone: 15,129 (73.2%)
- Carpooled: 1,905 (9.2%)
- Bus: 8 (0.0%)
- Subway or elevated rail: 3 (0.0%)
- Taxicab, motorcycle, or other means: 89 (0.4%)
- Bicycle: 6 (0.0%)
- Walked: 207 (1.0%)
- Worked at home: 3,630 (17.6%)
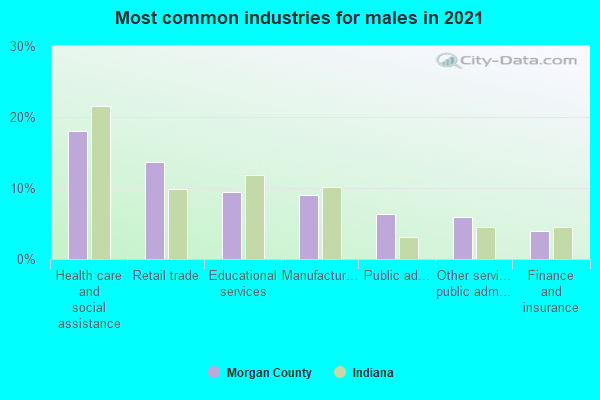
- Health care and social assistance (26%)
- Educational services (10%)
- Retail trade (10%)
- Manufacturing (9%)
- Professional, scientific, and technical services (7%)
- Public administration (6%)
- Finance and insurance (6%)
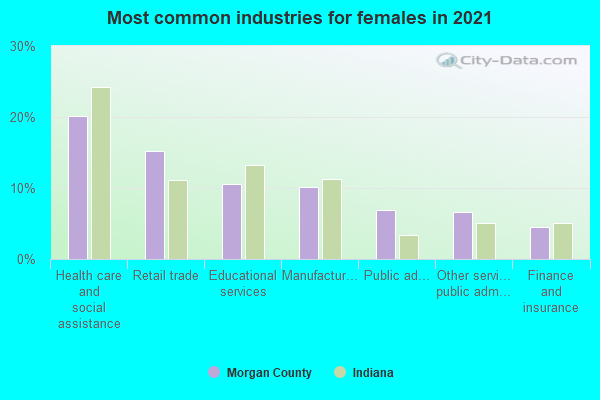
- Health care and social assistance (28%)
- Educational services (10%)
- Retail trade (10%)
- Manufacturing (10%)
- Professional, scientific, and technical services (7%)
- Public administration (6%)
- Finance and insurance (6%)
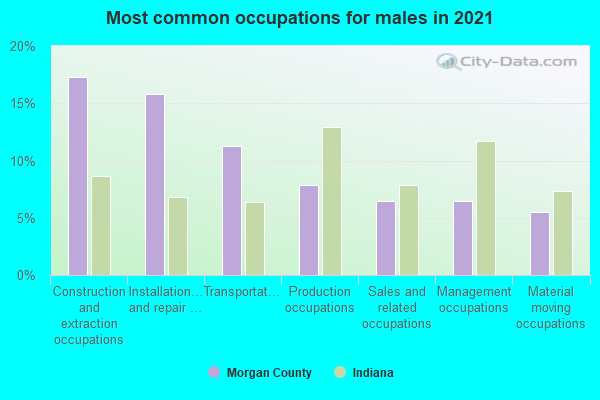
- Installation, maintenance, and repair occupations (13%)
- Construction and extraction occupations (11%)
- Management occupations (10%)
- Transportation occupations (10%)
- Sales and related occupations (9%)
- Production occupations (8%)
- Computer and mathematical occupations (6%)
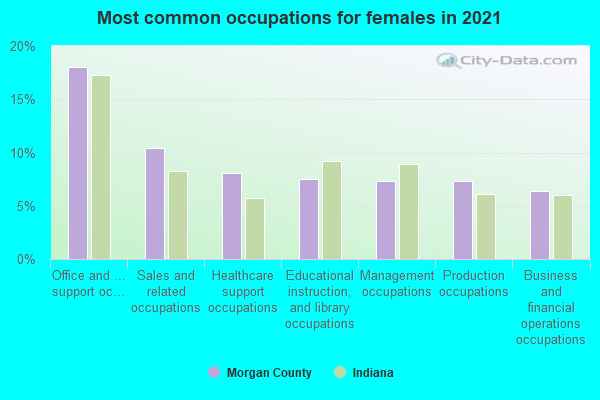
- Office and administrative support occupations (20%)
- Sales and related occupations (11%)
- Management occupations (9%)
- Educational instruction, and library occupations (9%)
- Health diagnosing and treating practitioners and other technical occupations (7%)
- Healthcare support occupations (7%)
- Production occupations (6%)
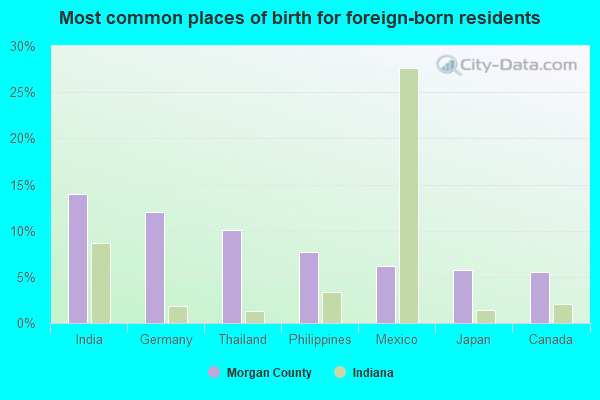
- Philippines (12%)
- Thailand (10%)
- Other Western Africa (9%)
- Mexico (9%)
- Germany (8%)
- China, excluding Hong Kong and Taiwan (7%)
- El Salvador (5%)
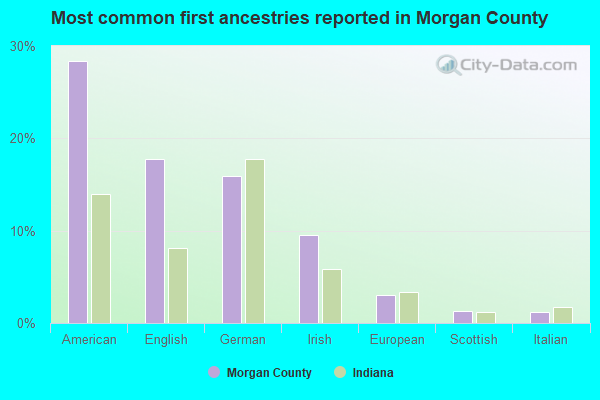
- American (31%)
- German (14%)
- English (14%)
- Irish (9%)
- European (4%)
- Scottish (2%)
- Dutch (1%)
People in group quarters in Morgan County, Indiana in 2010:
- 259 people in nursing facilities/skilled-nursing facilities
- 227 people in local jails and other municipal confinement facilities
- 63 people in emergency and transitional shelters (with sleeping facilities) for people experiencing homelessness
- 18 people in hospitals with patients who have no usual home elsewhere
- 9 people in other noninstitutional facilities
- 8 people in mental (psychiatric) hospitals and psychiatric units in other hospitals
- 8 people in college/university student housing
People in group quarters in Morgan County, Indiana in 2000:
- 387 people in nursing homes
- 174 people in local jails and other confinement facilities (including police lockups)
- 37 people in other noninstitutional group quarters
- 26 people in orthopedic wards and institutions for the physically handicapped
- 22 people in wards in general hospitals for patients who have no usual home elsewhere
- 22 people in college dormitories (includes college quarters off campus)
- 21 people in homes or halfway houses for drug/alcohol abuse
- 5 people in other group homes
- 2 people in religious group quarters
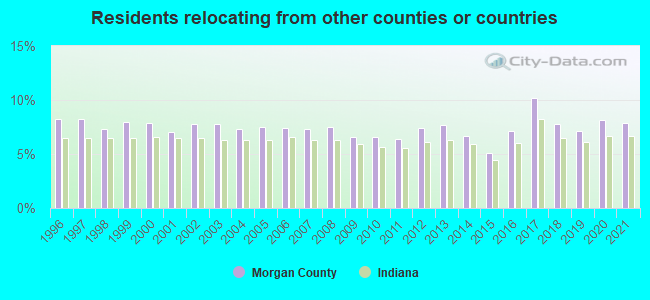
7.89% of this county's 2021 resident taxpayers lived in other counties in 2020 ($58,623 average adjusted gross income)
| Here: | 7.89% |
| Indiana average: | 6.66% |
10 or fewer of this county's residents moved from foreign countries.
6.62% relocated from other counties in Indiana ($49,356 average AGI)
1.28% relocated from other states ($9,267 average AGI)
Morgan County: 1.28% Indiana average: 2.58%
Top counties from which taxpayers relocated into this county between 2020 and 2021:
| from Marion County, IN | |
| from Hendricks County, IN | |
| from Johnson County, IN | |
| from Monroe County, IN | |
| from Brown County, IN | |
| from Owen County, IN | |
| from Putnam County, IN |
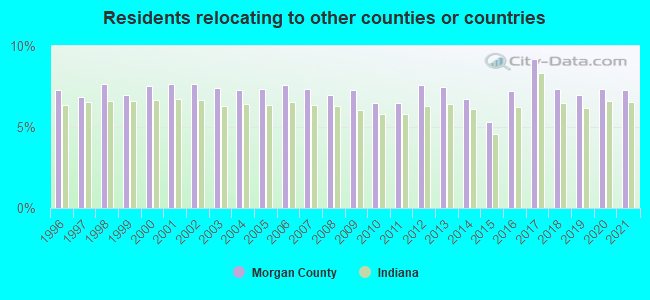
7.29% of this county's 2020 resident taxpayers moved to other counties in 2021 ($57,574 average adjusted gross income)
| Here: | 7.29% |
| Indiana average: | 6.55% |
10 or fewer of this county's residents moved to foreign countries.
5.85% relocated to other counties in Indiana ($44,890 average AGI)
1.44% relocated to other states ($12,684 average AGI)
Morgan County: 1.44% Indiana average: 2.46%
Top counties to which taxpayers relocated from this county between 2020 and 2021:
| to Marion County, IN | |
| to Hendricks County, IN | |
| to Johnson County, IN | |
| to Monroe County, IN | |
| to Putnam County, IN | |
| to Owen County, IN | |
| to Brown County, IN |
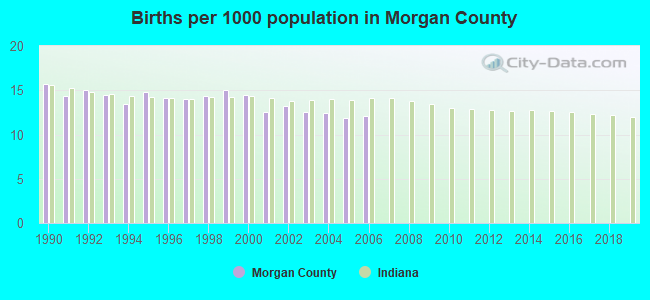
Births per 1000 population from 1990 to 1999: 14.5
Births per 1000 population from 2000 to 2006: 12.7
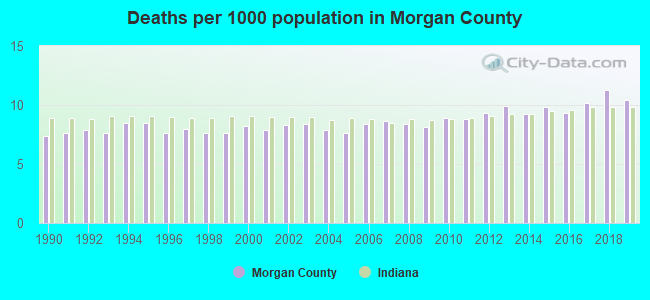
Deaths per 1000 population from 1990 to 1999: 7.8
Deaths per 1000 population from 2000 to 2009: 8.2
Deaths per 1000 population from 2010 to 2020: 9.9
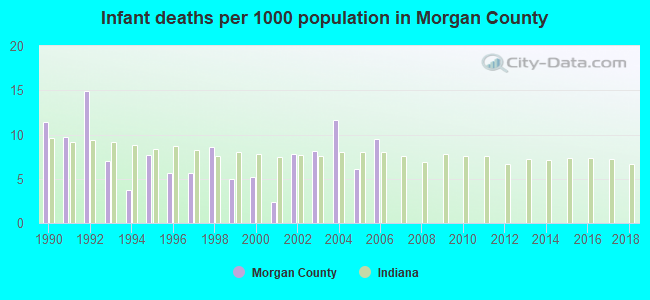
Infant deaths per 1000 live births from 1990 to 1999: 7.9
Infant deaths per 1000 live births from 2000 to 2006: 7.2
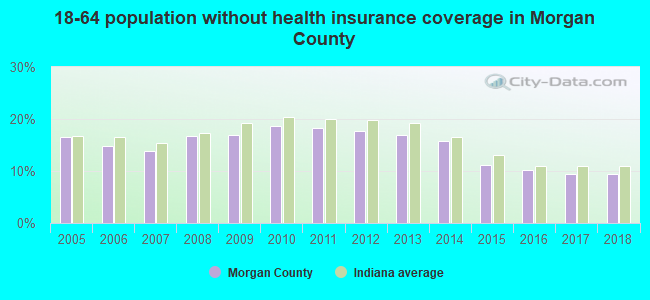
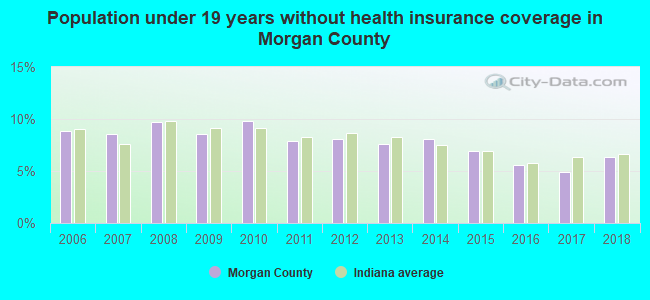
Persons under 19 years old without health insurance coverage in 2018: 6.3%
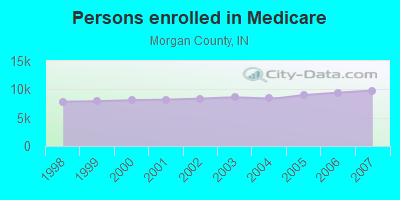
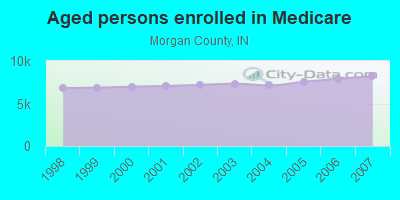
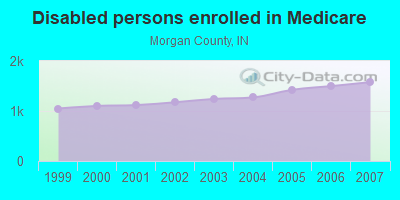
Persons enrolled in hospital insurance and/or supplemental medical insurance (Medicare) in July 1, 2007: 9,789 (8,212 aged, 1,577 disabled)
Children under 18 without health insurance coverage in 2007: 1,472 (8%)
Most common underlying causes of death in Morgan County, Indiana in 1999 - 2019:
- Acute myocardial infarction, unspecified (1,077)
- Bronchus or lung, unspecified - Malignant neoplasms (998)
- Atherosclerotic heart disease (911)
- Chronic obstructive pulmonary disease, unspecified (760)
- Unspecified dementia (473)
- Congestive heart failure (400)
- Stroke, not specified as haemorrhage or infarction (295)
- Alzheimer disease, unspecified (239)
- Pneumonia, unspecified (187)
- Breast, unspecified - Malignant neoplasms (127)
Population without health insurance coverage in 2000: 9%
Children under 18 without health insurance coverage in 2000: 8%
Short term general hospital admissions per 100,000 population in 2004: 5,481
Short term general hospital beds per 100,000 population in 2004: 202
Emergency room visits per 100,000 population in 2004: 27,462
General practice office based MDs per 100,000 population in 2005: 1,218
Medical specialist MDs per 100,000 population in 2005: 824
Dentists per 100,000 population in 1998: 10
Total births per 100,000 population, July 2005 - July 2006 : 31
Total deaths per 100,000 population, July 2005 - July 2006: 70
Limited-service eating places per 100,000 population in 2005 : 7
Beer, wine & liquor stores per 100,000 population in 2005: 1
Suicides per 1,000,000 population from 2000 to 2006: 138.1. This is more than state average.
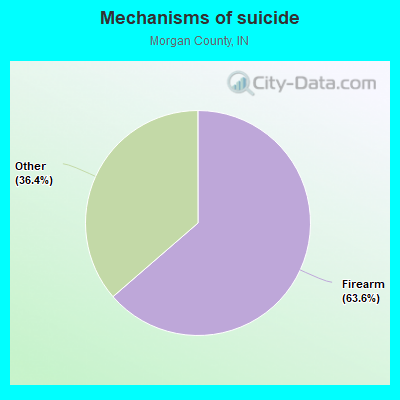
- Firearm - 87.9
- Other - 50.2
Household type by relationship:
Households: 72,236- Male householders: 13,012 (3,287 living alone), Female householders: 15,522 (3,691 living alone)
15,626 spouses (15,230 opposite-sex spouses), 1,440 unmarried partners, (1,423 opposite-sex unmarried partners), 19,913 children (19,031 natural, 499 adopted, 383 stepchildren), 2,031 grandchildren, 429 brothers or sisters, 1,041 parents, 105 foster children, 1,130 other relatives, 1,251 non-relatives
- In group quarters: 736
Size of family households: 8,953 2-persons, 4,572 3-persons, 4,645 4-persons, 1,115 5-persons, 497 6-persons, 596 7-or-more-persons.
Size of nonfamily households: 6,978 1-person, 1,178 2-persons.
10,604 married couples with children.
2,958 single-parent households (179 men, 2,779 women).
97.3% of residents of Morgan speak English at home.
1.0% of residents speak Spanish at home (62% speak English very well, 22% speak English well, 16% speak English not well).
0.3% of residents speak other Indo-European language at home (68% speak English very well, 16% speak English well, 16% don't speak English at all).
0.5% of residents speak Asian or Pacific Island language at home (48% speak English very well, 52% speak English well).
0.1% of residents speak other language at home (12% speak English well, 88% speak English not well).
In fiscal year 2004:
Federal Government expenditure: $266,098,000 ($3,833 per capita)
Department of Defense expenditure: $8,990,000
Federal direct payments to individuals for retirement and disability: $137,953,000
Federal other direct payments to individuals: $57,928,000
Federal direct payments not to individuals: $4,643,000
Federal grants: $51,513,000
Federal procurement contracts: $3,552,000 ($1,711,000 Department of Defense)
Federal salaries and wages: $10,510,000 ($3,059,000 Department of Defense)
Federal Government direct loans: $408,000
Federal guaranteed/insured loans: $57,826,000
Federal Government insurance: $35,202,000
Population change from April 1, 2000 to July 1, 2005:
Births: 4,610| Here: | 66 per 1000 residents |
| State: | 72 per 1000 residents |
Deaths: 2,967
| Here: | 43 per 1000 residents |
| State: | 47 per 1000 residents |
Net international migration: +87
| Here: | +1 per 1000 residents |
| State: | +9 per 1000 residents |
Net internal migration: +1,440
| Here: | |
| State: |
Total withdrawal of fresh water for public supply: 5.54 millions of gallons per day (all from ground)
| Here: | 6.4 |
| State: | 6.6 |
| Here: | 4.6 |
| State: | 4.3 |
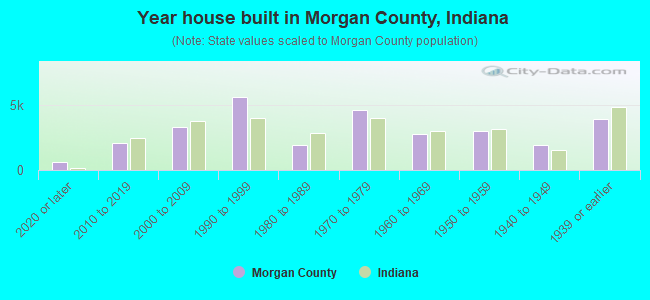
- Year house built in Morgan County, Indiana
- 4882020 or later
- 2,5222010 to 2019
- 4,7632000 to 2009
- 6,2671990 to 1999
- 1,8291980 to 1989
- 2,8481970 to 1979
- 4,5311960 to 1969
- 2,1031950 to 1959
- 1,3171940 to 1949
- 3,4531939 or earlier
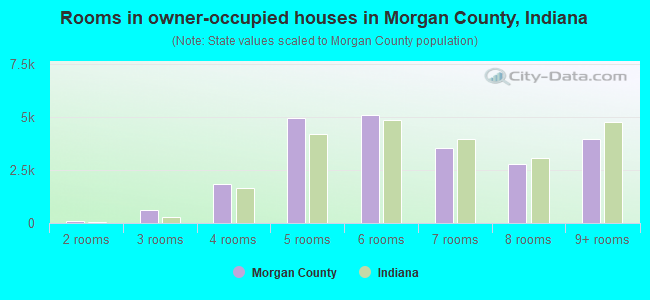
- Rooms in owner-occupied houses in Morgan County, Indiana
- 611 room
- 02 rooms
- 313 rooms
- 1,3294 rooms
- 4,3775 rooms
- 5,9436 rooms
- 3,6197 rooms
- 2,8008 rooms
- 4,0059+ rooms
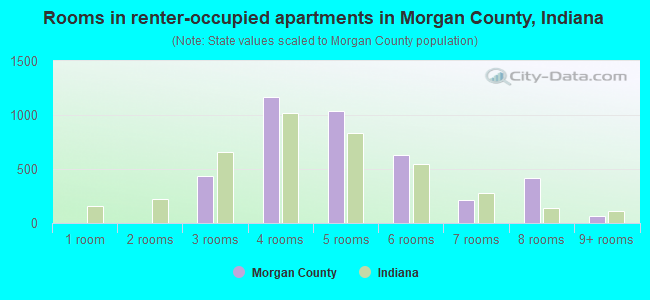
- Rooms in renter-occupied apartments in Morgan County, Indiana
- 01 room
- 3902 rooms
- 8273 rooms
- 1,8674 rooms
- 1,6555 rooms
- 1,0036 rooms
- 2587 rooms
- 2778 rooms
- 929+ rooms
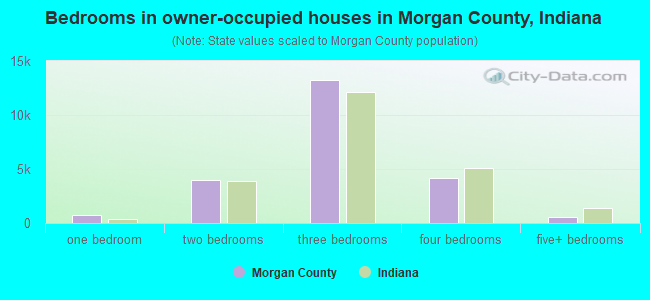
- Bedrooms in owner-occupied houses in Morgan County, Indiana
- 61no bedroom
- 2301 bedroom
- 3,5172 bedrooms
- 13,2343 bedrooms
- 4,2744 bedrooms
- 8495+ bedrooms
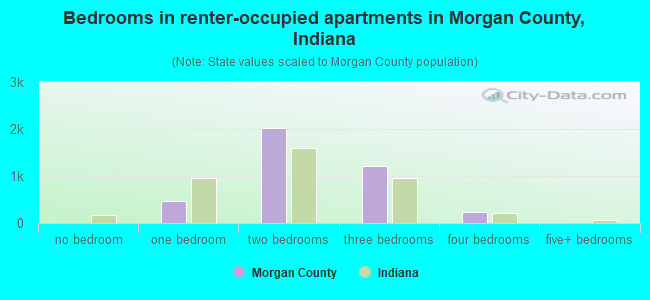
- Bedrooms in renter-occupied apartments in Morgan County, Indiana
- 0no bedroom
- 1,7111 bedroom
- 3,0532 bedrooms
- 1,4693 bedrooms
- 1364 bedrooms
- 05+ bedrooms
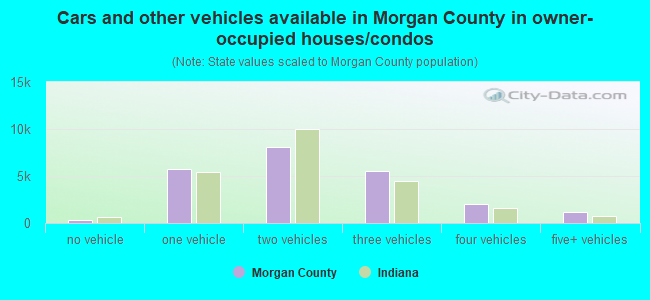
- Cars and other vehicles available in Morgan County in owner-occupied houses/condos
- 664no vehicle
- 3,9591 vehicle
- 9,2472 vehicles
- 5,4513 vehicles
- 1,7494 vehicles
- 1,0955+ vehicles
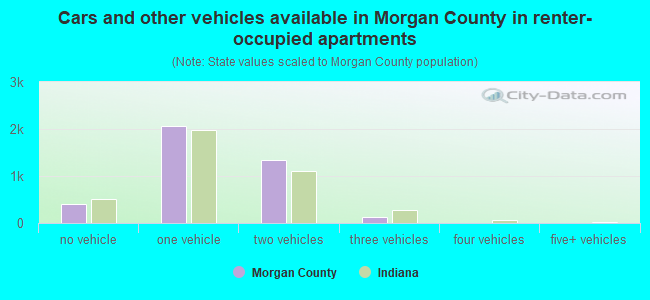
- Cars and other vehicles available in Morgan County in renter-occupied apartments
- 890no vehicle
- 2,7791 vehicle
- 2,5242 vehicles
- 1763 vehicles
- 04 vehicles
- 05+ vehicles
90.6% of Morgan County residents lived in the same house 1 years ago.
Out of people who lived in different houses, 30% lived in this county.
Out of people who lived in different counties, 76% lived in Indiana.
| Morgan County: | 90.6% |
| State average: | 87.1% |
Place of birth for U.S.-born residents:
- This state: 57,867
- Other state: 12,715
- Northeast: 1,156
- Midwest: 5,096
- South: 5,138
- West: 1,325
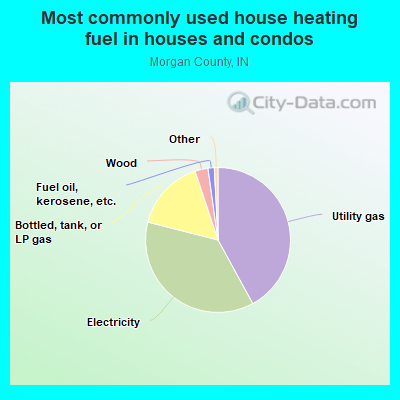
- 41.6%Utility gas
- 37.6%Electricity
- 16.0%Bottled, tank, or LP gas
- 2.3%Wood
- 1.6%Fuel oil, kerosene, etc.
- 0.5%No fuel used
- 0.4%Other fuel
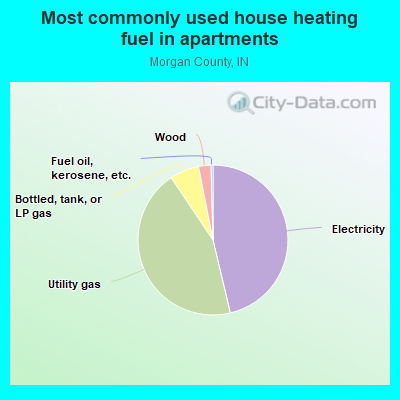
- 49.4%Electricity
- 42.2%Utility gas
- 5.3%Bottled, tank, or LP gas
- 1.7%Wood
- 1.4%Fuel oil, kerosene, etc.
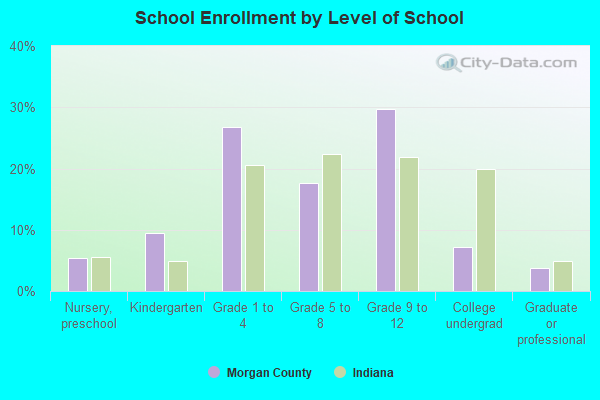
Private vs. public school enrollment:
| Here: | 12.5% |
| Indiana: | 14.9% |
| Here: | 6.5% |
| Indiana: | 11.4% |
| Here: | 17.5% |
| Indiana: | 22.3% |
Morgan County government finances - Expenditure in 2020:
- Bond Funds - Cash and Securities: $500,000
Cash and Securities: $3,000
- Charges - Regular Highways: $6,520,000
Solid Waste Management: $6,454,000
Solid Waste Management: $5,344,000
Hospital Public: $3,985,000
Hospital Public: $1,314,000
Other: $640,000
Other: $570,000
Natural Resources - Other: $9,000
Parks and Recreation: $1,000
- Construction - Regular Highways: $2,429,000
Regular Highways: $94,000
- Current Operations - Regular Highways: $30,962,000
Health - Other: $8,469,000
General - Other: $7,461,000
General - Other: $7,346,000
Health - Other: $5,212,000
Correctional Institutions: $3,969,000
Solid Waste Management: $3,822,000
Correctional Institutions: $3,490,000
Regular Highways: $3,338,000
Solid Waste Management: $2,707,000
Judicial and Legal Services: $1,081,000
Transit Utilities: $1,075,000
Transit Utilities: $1,030,000
Financial Administration: $989,000
Parks and Recreation: $928,000
Natural Resources - Other: $811,000
Parks and Recreation: $772,000
Financial Administration: $739,000
Judicial and Legal Services: $724,000
Central Staff Services: $717,000
Central Staff Services: $691,000
General Public Buildings: $663,000
General Public Buildings: $659,000
Local Fire Protection: $592,000
Local Fire Protection: $579,000
Police Protection: $569,000
Police Protection: $433,000
Public Welfare - Other: $387,000
Public Welfare - Other: $361,000
Air Transportation: $111,000
Air Transportation: $92,000
Sewerage: $35,000
Sewerage: $9,000
Natural Resources - Other: $6,000
- Federal Intergovernmental - Highways: $4,863,000
Other: $2,807,000
Health and Hospitals: $2,479,000
Other: $2,221,000
Health and Hospitals: $938,000
General Local Government Support: $44,000
- General - Interest on Debt: $1,781,000
- Intergovernmental to Local - Other - Natural Resources - Other: $1,327,000
Other - Natural Resources - Other: $941,000
Other - Correctional Institutions: $3,000
- Intergovernmental to State - Regular Highways: $54,000
- Local Intergovernmental - Health and Hospitals: $2,040,000
Health and Hospitals: $1,200,000
Highways: $414,000
Other: $71,000
Other: $56,000
- Long Term Debt - Beginning Outstanding - Unspecified Public Purpose: $44,505,000
Beginning Outstanding - Unspecified Public Purpose: $41,814,000
Outstanding Unspecified Public Purpose: $38,419,000
Outstanding Unspecified Public Purpose: $38,278,000
Retired Unspecified Public Purpose: $13,452,000
Issue, Unspecified Public Purpose: $7,225,000
Retired Unspecified Public Purpose: $3,394,000
Beginning Outstanding - Public Debt for Private Purpose: $483,000
Retired Nonguaranteed - Public Debt for Private Purpose: $300,000
Outstanding Nonguaranteed - Industrial Revenue: $183,000
- Miscellaneous - General Revenue - Other: $8,749,000
Sale of Property: $1,662,000
Sale of Property: $1,317,000
General Revenue - Other: $377,000
Interest Earnings: $274,000
Rents: $209,000
Rents: $158,000
Fines and Forfeits: $63,000
Donations From Private Sources: $19,000
Donations From Private Sources: $14,000
Interest Earnings: $13,000
- Other Capital Outlay - Regular Highways: $3,012,000
General - Other: $2,438,000
Solid Waste Management: $1,687,000
General - Other: $1,151,000
Regular Highways: $889,000
Solid Waste Management: $776,000
Parks and Recreation: $121,000
Local Fire Protection: $116,000
General Public Building: $91,000
Water Utilities: $50,000
Health - Other: $38,000
Police Protection: $25,000
Judicial and Legal Services: $21,000
Correctional Institutions: $10,000
Health - Other: $10,000
Transit Utilities: $9,000
Financial Administration: $5,000
Parks and Recreation: $4,000
Central Staff Services: $4,000
Local Fire Protection: $3,000
Central Staff Services: $2,000
Correctional Institutions: $2,000
Financial Administration: $1,000
- Other Funds - Cash and Securities: $26,696,000
Cash and Securities: $4,253,000
- Sinking Funds - Cash and Securities: $183,000
- State Intergovernmental - Highways: $12,734,000
Other: $9,477,000
Other: $7,949,000
Highways: $2,758,000
Health and Hospitals: $1,293,000
Health and Hospitals: $972,000
General Local Government Support: $727,000
General Local Government Support: $29,000
- Tax - Property: $9,832,000
Property: $5,665,000
Other: $5,114,000
Individual Income: $3,741,000
Individual Income: $3,639,000
Other Selective Sales: $553,000
Public Utilities Sales: $294,000
Public Utilities Sales: $291,000
Other License: $260,000
Corporation License: $254,000
Other Selective Sales: $251,000
Corporation License: $209,000
Documentary and Stock Transfer: $87,000
Documentary and Stock Transfer: $71,000
Occupation and Business License - Other: $2,000
Occupation and Business License - Other: $2,000
- Total Salaries and Wages: $16,074,000
: $8,326,000
Morgan County government finances - Revenue in 2020:
- Bond Funds - Cash and Securities: $500,000
Cash and Securities: $3,000
- Charges - Regular Highways: $6,520,000
Solid Waste Management: $6,454,000
Solid Waste Management: $5,344,000
Hospital Public: $3,985,000
Hospital Public: $1,314,000
Other: $640,000
Other: $570,000
Natural Resources - Other: $9,000
Parks and Recreation: $1,000
- Construction - Regular Highways: $2,429,000
Regular Highways: $94,000
- Current Operations - Regular Highways: $30,962,000
Health - Other: $8,469,000
General - Other: $7,461,000
General - Other: $7,346,000
Health - Other: $5,212,000
Correctional Institutions: $3,969,000
Solid Waste Management: $3,822,000
Correctional Institutions: $3,490,000
Regular Highways: $3,338,000
Solid Waste Management: $2,707,000
Judicial and Legal Services: $1,081,000
Transit Utilities: $1,075,000
Transit Utilities: $1,030,000
Financial Administration: $989,000
Parks and Recreation: $928,000
Natural Resources - Other: $811,000
Parks and Recreation: $772,000
Financial Administration: $739,000
Judicial and Legal Services: $724,000
Central Staff Services: $717,000
Central Staff Services: $691,000
General Public Buildings: $663,000
General Public Buildings: $659,000
Local Fire Protection: $592,000
Local Fire Protection: $579,000
Police Protection: $569,000
Police Protection: $433,000
Public Welfare - Other: $387,000
Public Welfare - Other: $361,000
Air Transportation: $111,000
Air Transportation: $92,000
Sewerage: $35,000
Sewerage: $9,000
Natural Resources - Other: $6,000
- Federal Intergovernmental - Highways: $4,863,000
Other: $2,807,000
Health and Hospitals: $2,479,000
Other: $2,221,000
Health and Hospitals: $938,000
General Local Government Support: $44,000
- General - Interest on Debt: $1,781,000
- Intergovernmental to Local - Other - Natural Resources - Other: $1,327,000
Other - Natural Resources - Other: $941,000
Other - Correctional Institutions: $3,000
- Intergovernmental to State - Regular Highways: $54,000
- Local Intergovernmental - Health and Hospitals: $2,040,000
Health and Hospitals: $1,200,000
Highways: $414,000
Other: $71,000
Other: $56,000
- Long Term Debt - Beginning Outstanding - Unspecified Public Purpose: $44,505,000
Beginning Outstanding - Unspecified Public Purpose: $41,814,000
Outstanding Unspecified Public Purpose: $38,419,000
Outstanding Unspecified Public Purpose: $38,278,000
Retired Unspecified Public Purpose: $13,452,000
Issue, Unspecified Public Purpose: $7,225,000
Retired Unspecified Public Purpose: $3,394,000
Beginning Outstanding - Public Debt for Private Purpose: $483,000
Retired Nonguaranteed - Public Debt for Private Purpose: $300,000
Outstanding Nonguaranteed - Industrial Revenue: $183,000
- Miscellaneous - General Revenue - Other: $8,749,000
Sale of Property: $1,662,000
Sale of Property: $1,317,000
General Revenue - Other: $377,000
Interest Earnings: $274,000
Rents: $209,000
Rents: $158,000
Fines and Forfeits: $63,000
Donations From Private Sources: $19,000
Donations From Private Sources: $14,000
Interest Earnings: $13,000
- Other Capital Outlay - Regular Highways: $3,012,000
General - Other: $2,438,000
Solid Waste Management: $1,687,000
General - Other: $1,151,000
Regular Highways: $889,000
Solid Waste Management: $776,000
Parks and Recreation: $121,000
Local Fire Protection: $116,000
General Public Building: $91,000
Water Utilities: $50,000
Health - Other: $38,000
Police Protection: $25,000
Judicial and Legal Services: $21,000
Correctional Institutions: $10,000
Health - Other: $10,000
Transit Utilities: $9,000
Financial Administration: $5,000
Parks and Recreation: $4,000
Central Staff Services: $4,000
Local Fire Protection: $3,000
Central Staff Services: $2,000
Correctional Institutions: $2,000
Financial Administration: $1,000
- Other Funds - Cash and Securities: $26,696,000
Cash and Securities: $4,253,000
- Sinking Funds - Cash and Securities: $183,000
- State Intergovernmental - Highways: $12,734,000
Other: $9,477,000
Other: $7,949,000
Highways: $2,758,000
Health and Hospitals: $1,293,000
Health and Hospitals: $972,000
General Local Government Support: $727,000
General Local Government Support: $29,000
- Tax - Property: $9,832,000
Property: $5,665,000
Other: $5,114,000
Individual Income: $3,741,000
Individual Income: $3,639,000
Other Selective Sales: $553,000
Public Utilities Sales: $294,000
Public Utilities Sales: $291,000
Other License: $260,000
Corporation License: $254,000
Other Selective Sales: $251,000
Corporation License: $209,000
Documentary and Stock Transfer: $87,000
Documentary and Stock Transfer: $71,000
Occupation and Business License - Other: $2,000
Occupation and Business License - Other: $2,000
- Total Salaries and Wages: $16,074,000
: $8,326,000
Morgan County government finances - Debt in 2020:
- Bond Funds - Cash and Securities: $500,000
Cash and Securities: $3,000
- Charges - Regular Highways: $6,520,000
Solid Waste Management: $6,454,000
Solid Waste Management: $5,344,000
Hospital Public: $3,985,000
Hospital Public: $1,314,000
Other: $640,000
Other: $570,000
Natural Resources - Other: $9,000
Parks and Recreation: $1,000
- Construction - Regular Highways: $2,429,000
Regular Highways: $94,000
- Current Operations - Regular Highways: $30,962,000
Health - Other: $8,469,000
General - Other: $7,461,000
General - Other: $7,346,000
Health - Other: $5,212,000
Correctional Institutions: $3,969,000
Solid Waste Management: $3,822,000
Correctional Institutions: $3,490,000
Regular Highways: $3,338,000
Solid Waste Management: $2,707,000
Judicial and Legal Services: $1,081,000
Transit Utilities: $1,075,000
Transit Utilities: $1,030,000
Financial Administration: $989,000
Parks and Recreation: $928,000
Natural Resources - Other: $811,000
Parks and Recreation: $772,000
Financial Administration: $739,000
Judicial and Legal Services: $724,000
Central Staff Services: $717,000
Central Staff Services: $691,000
General Public Buildings: $663,000
General Public Buildings: $659,000
Local Fire Protection: $592,000
Local Fire Protection: $579,000
Police Protection: $569,000
Police Protection: $433,000
Public Welfare - Other: $387,000
Public Welfare - Other: $361,000
Air Transportation: $111,000
Air Transportation: $92,000
Sewerage: $35,000
Sewerage: $9,000
Natural Resources - Other: $6,000
- Federal Intergovernmental - Highways: $4,863,000
Other: $2,807,000
Health and Hospitals: $2,479,000
Other: $2,221,000
Health and Hospitals: $938,000
General Local Government Support: $44,000
- General - Interest on Debt: $1,781,000
- Intergovernmental to Local - Other - Natural Resources - Other: $1,327,000
Other - Natural Resources - Other: $941,000
Other - Correctional Institutions: $3,000
- Intergovernmental to State - Regular Highways: $54,000
- Local Intergovernmental - Health and Hospitals: $2,040,000
Health and Hospitals: $1,200,000
Highways: $414,000
Other: $71,000
Other: $56,000
- Long Term Debt - Beginning Outstanding - Unspecified Public Purpose: $44,505,000
Beginning Outstanding - Unspecified Public Purpose: $41,814,000
Outstanding Unspecified Public Purpose: $38,419,000
Outstanding Unspecified Public Purpose: $38,278,000
Retired Unspecified Public Purpose: $13,452,000
Issue, Unspecified Public Purpose: $7,225,000
Retired Unspecified Public Purpose: $3,394,000
Beginning Outstanding - Public Debt for Private Purpose: $483,000
Retired Nonguaranteed - Public Debt for Private Purpose: $300,000
Outstanding Nonguaranteed - Industrial Revenue: $183,000
- Miscellaneous - General Revenue - Other: $8,749,000
Sale of Property: $1,662,000
Sale of Property: $1,317,000
General Revenue - Other: $377,000
Interest Earnings: $274,000
Rents: $209,000
Rents: $158,000
Fines and Forfeits: $63,000
Donations From Private Sources: $19,000
Donations From Private Sources: $14,000
Interest Earnings: $13,000
- Other Capital Outlay - Regular Highways: $3,012,000
General - Other: $2,438,000
Solid Waste Management: $1,687,000
General - Other: $1,151,000
Regular Highways: $889,000
Solid Waste Management: $776,000
Parks and Recreation: $121,000
Local Fire Protection: $116,000
General Public Building: $91,000
Water Utilities: $50,000
Health - Other: $38,000
Police Protection: $25,000
Judicial and Legal Services: $21,000
Correctional Institutions: $10,000
Health - Other: $10,000
Transit Utilities: $9,000
Financial Administration: $5,000
Parks and Recreation: $4,000
Central Staff Services: $4,000
Local Fire Protection: $3,000
Central Staff Services: $2,000
Correctional Institutions: $2,000
Financial Administration: $1,000
- Other Funds - Cash and Securities: $26,696,000
Cash and Securities: $4,253,000
- Sinking Funds - Cash and Securities: $183,000
- State Intergovernmental - Highways: $12,734,000
Other: $9,477,000
Other: $7,949,000
Highways: $2,758,000
Health and Hospitals: $1,293,000
Health and Hospitals: $972,000
General Local Government Support: $727,000
General Local Government Support: $29,000
- Tax - Property: $9,832,000
Property: $5,665,000
Other: $5,114,000
Individual Income: $3,741,000
Individual Income: $3,639,000
Other Selective Sales: $553,000
Public Utilities Sales: $294,000
Public Utilities Sales: $291,000
Other License: $260,000
Corporation License: $254,000
Other Selective Sales: $251,000
Corporation License: $209,000
Documentary and Stock Transfer: $87,000
Documentary and Stock Transfer: $71,000
Occupation and Business License - Other: $2,000
Occupation and Business License - Other: $2,000
- Total Salaries and Wages: $16,074,000
: $8,326,000
Morgan County government finances - Cash and Securities in 2020:
- Bond Funds - Cash and Securities: $500,000
Cash and Securities: $3,000
- Charges - Regular Highways: $6,520,000
Solid Waste Management: $6,454,000
Solid Waste Management: $5,344,000
Hospital Public: $3,985,000
Hospital Public: $1,314,000
Other: $640,000
Other: $570,000
Natural Resources - Other: $9,000
Parks and Recreation: $1,000
- Construction - Regular Highways: $2,429,000
Regular Highways: $94,000
- Current Operations - Regular Highways: $30,962,000
Health - Other: $8,469,000
General - Other: $7,461,000
General - Other: $7,346,000
Health - Other: $5,212,000
Correctional Institutions: $3,969,000
Solid Waste Management: $3,822,000
Correctional Institutions: $3,490,000
Regular Highways: $3,338,000
Solid Waste Management: $2,707,000
Judicial and Legal Services: $1,081,000
Transit Utilities: $1,075,000
Transit Utilities: $1,030,000
Financial Administration: $989,000
Parks and Recreation: $928,000
Natural Resources - Other: $811,000
Parks and Recreation: $772,000
Financial Administration: $739,000
Judicial and Legal Services: $724,000
Central Staff Services: $717,000
Central Staff Services: $691,000
General Public Buildings: $663,000
General Public Buildings: $659,000
Local Fire Protection: $592,000
Local Fire Protection: $579,000
Police Protection: $569,000
Police Protection: $433,000
Public Welfare - Other: $387,000
Public Welfare - Other: $361,000
Air Transportation: $111,000
Air Transportation: $92,000
Sewerage: $35,000
Sewerage: $9,000
Natural Resources - Other: $6,000
- Federal Intergovernmental - Highways: $4,863,000
Other: $2,807,000
Health and Hospitals: $2,479,000
Other: $2,221,000
Health and Hospitals: $938,000
General Local Government Support: $44,000
- General - Interest on Debt: $1,781,000
- Intergovernmental to Local - Other - Natural Resources - Other: $1,327,000
Other - Natural Resources - Other: $941,000
Other - Correctional Institutions: $3,000
- Intergovernmental to State - Regular Highways: $54,000
- Local Intergovernmental - Health and Hospitals: $2,040,000
Health and Hospitals: $1,200,000
Highways: $414,000
Other: $71,000
Other: $56,000
- Long Term Debt - Beginning Outstanding - Unspecified Public Purpose: $44,505,000
Beginning Outstanding - Unspecified Public Purpose: $41,814,000
Outstanding Unspecified Public Purpose: $38,419,000
Outstanding Unspecified Public Purpose: $38,278,000
Retired Unspecified Public Purpose: $13,452,000
Issue, Unspecified Public Purpose: $7,225,000
Retired Unspecified Public Purpose: $3,394,000
Beginning Outstanding - Public Debt for Private Purpose: $483,000
Retired Nonguaranteed - Public Debt for Private Purpose: $300,000
Outstanding Nonguaranteed - Industrial Revenue: $183,000
- Miscellaneous - General Revenue - Other: $8,749,000
Sale of Property: $1,662,000
Sale of Property: $1,317,000
General Revenue - Other: $377,000
Interest Earnings: $274,000
Rents: $209,000
Rents: $158,000
Fines and Forfeits: $63,000
Donations From Private Sources: $19,000
Donations From Private Sources: $14,000
Interest Earnings: $13,000
- Other Capital Outlay - Regular Highways: $3,012,000
General - Other: $2,438,000
Solid Waste Management: $1,687,000
General - Other: $1,151,000
Regular Highways: $889,000
Solid Waste Management: $776,000
Parks and Recreation: $121,000
Local Fire Protection: $116,000
General Public Building: $91,000
Water Utilities: $50,000
Health - Other: $38,000
Police Protection: $25,000
Judicial and Legal Services: $21,000
Correctional Institutions: $10,000
Health - Other: $10,000
Transit Utilities: $9,000
Financial Administration: $5,000
Parks and Recreation: $4,000
Central Staff Services: $4,000
Local Fire Protection: $3,000
Central Staff Services: $2,000
Correctional Institutions: $2,000
Financial Administration: $1,000
- Other Funds - Cash and Securities: $26,696,000
Cash and Securities: $4,253,000
- Sinking Funds - Cash and Securities: $183,000
- State Intergovernmental - Highways: $12,734,000
Other: $9,477,000
Other: $7,949,000
Highways: $2,758,000
Health and Hospitals: $1,293,000
Health and Hospitals: $972,000
General Local Government Support: $727,000
General Local Government Support: $29,000
- Tax - Property: $9,832,000
Property: $5,665,000
Other: $5,114,000
Individual Income: $3,741,000
Individual Income: $3,639,000
Other Selective Sales: $553,000
Public Utilities Sales: $294,000
Public Utilities Sales: $291,000
Other License: $260,000
Corporation License: $254,000
Other Selective Sales: $251,000
Corporation License: $209,000
Documentary and Stock Transfer: $87,000
Documentary and Stock Transfer: $71,000
Occupation and Business License - Other: $2,000
Occupation and Business License - Other: $2,000
- Total Salaries and Wages: $16,074,000
: $8,326,000
Supplemental Security Income (SSI) in 2006:
- Total number of recipients: 739
- Number of aged recipients: 41
- Number of blind and disabled recipients: 698
- Number of recipients under 18: 130
- Number of recipients between 18 and 64: 518
- Number of recipients older than 64: 91
- Number of recipients also receiving OASDI: 286
- Amount of payments (thousands of dollars): 345
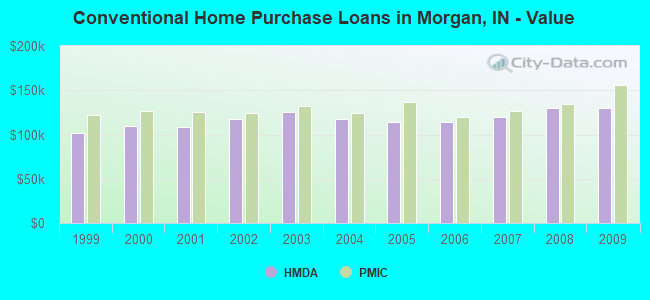
| Home Mortgage Disclosure Act Aggregated Statistics For Year 2009 (Based on 10 full tracts) | ||||||||||||||
| A) FHA, FSA/RHS & VA Home Purchase Loans | B) Conventional Home Purchase Loans | C) Refinancings | D) Home Improvement Loans | E) Loans on Dwellings For 5+ Families | F) Non-occupant Loans on < 5 Family Dwellings (A B C & D) | G) Loans On Manufactured Home Dwelling (A B C & D) | ||||||||
|---|---|---|---|---|---|---|---|---|---|---|---|---|---|---|
| Number | Average Value | Number | Average Value | Number | Average Value | Number | Average Value | Number | Average Value | Number | Average Value | Number | Average Value | |
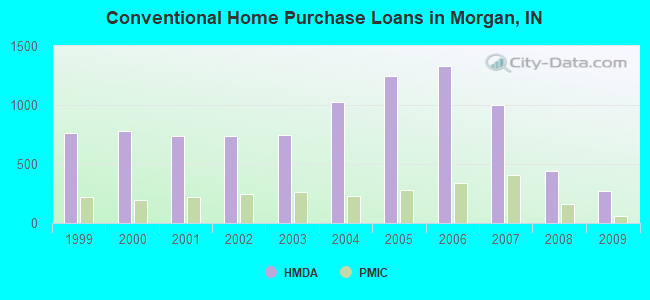
| LOANS ORIGINATED | 407 | $122,047 | 274 | $130,208 | 1,846 | $142,900 | 140 | $61,007 | 1 | $218,000 | 118 | $87,263 | 55 | $75,455 |
| APPLICATIONS APPROVED, NOT ACCEPTED | 17 | $110,353 | 9 | $169,556 | 135 | $141,593 | 6 | $20,833 | 0 | $0 | 5 | $111,600 | 4 | $65,750 |
| APPLICATIONS DENIED | 121 | $106,091 | 84 | $86,131 | 723 | $147,409 | 62 | $59,000 | 2 | $527,000 | 43 | $91,907 | 47 | $67,043 |
| APPLICATIONS WITHDRAWN | 44 | $103,045 | 33 | $98,606 | 462 | $146,513 | 20 | $143,650 | 0 | $0 | 21 | $90,667 | 14 | $79,714 |
| FILES CLOSED FOR INCOMPLETENESS | 19 | $111,895 | 4 | $132,750 | 76 | $155,684 | 10 | $94,400 | 0 | $0 | 2 | $138,000 | 3 | $69,000 |
| Private Mortgage Insurance Companies Aggregated Statistics For Year 2009 (Based on 10 full tracts) | ||||||
| A) Conventional Home Purchase Loans | B) Refinancings | D) Loans On Manufactured Home Dwelling (A & B) | ||||
|---|---|---|---|---|---|---|
| Number | Average Value | Number | Average Value | Number | Average Value | |
| LOANS ORIGINATED | 58 | $155,603 | 72 | $166,681 | 0 | $0 |
| APPLICATIONS APPROVED, NOT ACCEPTED | 17 | $193,588 | 32 | $146,750 | 1 | $133,000 |
| APPLICATIONS DENIED | 14 | $161,143 | 30 | $164,300 | 2 | $124,000 |
| APPLICATIONS WITHDRAWN | 6 | $212,833 | 8 | $178,500 | 0 | $0 |
| FILES CLOSED FOR INCOMPLETENESS | 1 | $59,000 | 1 | $80,000 | 0 | $0 |
| Most common first names in Morgan County, IN among deceased individuals | ||
| Name | Count | Lived (average) |
|---|---|---|
| Mary | 410 | 78.8 years |
| William | 372 | 74.3 years |
| James | 332 | 70.6 years |
| Robert | 289 | 70.7 years |
| John | 283 | 73.3 years |
| Charles | 278 | 73.7 years |
| George | 166 | 74.6 years |
| Ruth | 136 | 78.8 years |
| Helen | 126 | 79.1 years |
| Dorothy | 123 | 78.2 years |
| Most common last names in Morgan County, IN among deceased individuals | ||
| Last name | Count | Lived (average) |
|---|---|---|
| Smith | 152 | 73.6 years |
| Miller | 110 | 75.0 years |
| Williams | 100 | 78.3 years |
| Johnson | 83 | 73.0 years |
| Brown | 82 | 76.3 years |
| Moore | 74 | 76.1 years |
| Baker | 66 | 70.9 years |
| Jones | 63 | 76.0 years |
| Martin | 60 | 76.2 years |
| Davis | 59 | 73.3 years |
| Businesses in Morgan County, IN | ||||
| Name | Count | Name | Count | |
|---|---|---|---|---|
| AT&T | 2 | Lane Furniture | 1 | |
| Ace Hardware | 1 | Long John Silver's | 2 | |
| Advance Auto Parts | 1 | Lowe's | 1 | |
| Arby's | 2 | MasterBrand Cabinets | 4 | |
| AutoZone | 2 | Maurices | 1 | |
| Best Western | 1 | McDonald's | 3 | |
| Big O Tires | 1 | Nike | 1 | |
| Blockbuster | 1 | Penske | 1 | |
| Burger King | 2 | Pizza Hut | 1 | |
| CVS | 3 | RadioShack | 1 | |
| Chevrolet | 1 | Sears | 1 | |
| Curves | 1 | Starbucks | 1 | |
| Dairy Queen | 3 | Steak 'n Shake | 2 | |
| Domino's Pizza | 1 | Subway | 3 | |
| FedEx | 4 | Super 8 | 1 | |
| Ford | 2 | T-Mobile | 1 | |
| GNC | 1 | Taco Bell | 2 | |
| H&R Block | 2 | U-Haul | 6 | |
| Hardee's | 1 | UPS | 8 | |
| Holiday Inn | 1 | Walgreens | 2 | |
| Jimmy John's | 2 | Walmart | 1 | |
| KFC | 2 | Wendy's | 2 | |
| Kroger | 3 | White Castle | 1 | |
| La-Z-Boy | 1 | YMCA | 1 | |
Morgan County on our top lists:
- #37 on the list of "Top 101 counties with the largest increase in the number of deaths per 1000 residents 2000-2006 to 2007-2013 (pop. 50,000+)"