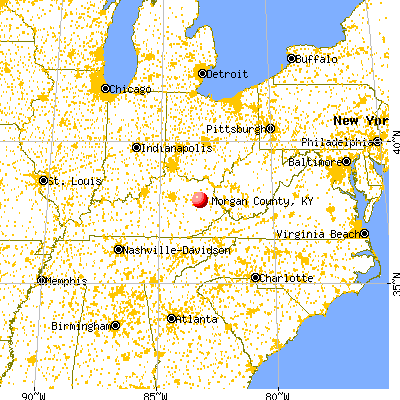
Morgan County, Kentucky (KY)
County owner-occupied free and clear houses and condos in 2010: 1,977
County owner-occupied houses and condos in 2000: 3,795
Renter-occupied apartments: 1,096 (it was 957 in 2000)
| % of renters here: | 20% |
| State: | 31% |
Land area: 381 sq. mi.
Water area: 2.5 sq. mi.
Population density: 36 people per square mile (low).
Industries providing employment: Educational, health and social services (27.1%), Retail trade (13.5%), Manufacturing (13.1%), Public administration (11.2%), Construction (10.7%).
Type of workers:
- Private wage or salary: 67%
- Government: 24%
- Self-employed, not incorporated: 9%
- Unpaid family work: 0%
- OSM Map
- General Map
- Google Map
- MSN Map

- 12,62691.9%White Non-Hispanic Alone
- 5434.0%Black Non-Hispanic Alone
- 2121.5%Two or more races
- 1571.1%Hispanic or Latino
- 1200.9%Asian alone
- 720.5%Native Hawaiian and Other
Pacific Islander alone - 160.1%American Indian and Alaska Native alone

| Median resident age: | 42.6 years |
| Kentucky median age: | 39.4 years |
| Males: 7,996 | |
| Females: 5,872 |

 | Eastern Kentucky (260 replies) |
| Learning more about my Harlan County Roots.. (9 replies) |
| West Liberty, KY (1 reply) |
| Morgan County: | 2.0 people |
| Kentucky: | 2 people |
Estimated median household income in 2022: $45,374 ($21,869 in 1999)
| This county: | $45,374 |
| Kentucky: | $59,341 |
Median contract rent in 2022 for apartments: $435 (lower quartile is $320, upper quartile is $498)
| This county: | $435 |
| State: | $702 |
Estimated median house or condo value in 2022: $100,701 (it was $46,300 in 2000)
| Morgan: | $100,701 |
| Kentucky: | $196,300 |
Mean price in 2022:
Median monthly housing costs for homes and condos with a mortgage: $1,118Detached houses: $180,597
Here: $180,597 State: $256,452 Townhouses or other attached units: $154,533
Here: $154,533 State: $264,090 Mobile homes: $86,942
Here: $86,942 State: $84,635
Median monthly housing costs for units without a mortgage: $328
Institutionalized population: 1,975
Crime in 2021 (reported by the sheriff's office or county police, not the county total):
- Murders: 0
- Rapes: 0
- Robberies: 1
- Assaults: 2
- Burglaries: 9
- Thefts: 24
- Auto thefts: 8
Crime in 2020 (reported by the sheriff's office or county police, not the county total):
- Murders: 0
- Rapes: 0
- Robberies: 0
- Assaults: 6
- Burglaries: 15
- Thefts: 31
- Auto thefts: 6
Single-family new house construction building permits:
- 2022: 2 buildings, average cost: $80,000
- 2021: 3 buildings, average cost: $38,300
- 2020: 0 buildings
- 2019: 24 buildings, average cost: $75,000
- 2018: 22 buildings, average cost: $75,000
- 2017: 22 buildings, average cost: $75,000
- 2016: 20 buildings, average cost: $75,000
- 2015: 17 buildings, average cost: $75,000
- 2014: 17 buildings, average cost: $75,000
- 2013: 15 buildings, average cost: $75,000
- 2012: 37 buildings, average cost: $55,000
- 2011: 0 buildings
- 2010: 1 building, cost: $143,000
- 2009: 2 buildings, average cost: $125,000
- 2008: 0 buildings
- 2007: 0 buildings
- 2006: 1 building, cost: $75,000
- 2005: 9 buildings, average cost: $66,700
- 2004: 3 buildings, average cost: $116,700


Median real estate property taxes paid for housing units with mortgages in 2022: $960 (0.6%)
Median real estate property taxes paid for housing units with no mortgage in 2022: $564 (0.8%)


| Morgan County: | 20.9% |
| Kentucky: | 16.5% |
Median age of residents in 2022: 42.6 years old
(Males: 40.6 years old, Females: 45.2 years old)
(Median age for: White residents: 43.9 years old, Black residents: 33.8 years old, American Indian residents: 51.8 years old, Asian residents: 30.8 years old, Hispanic or Latino residents: 16.8 years old, Other race residents: 16.2 years old)
Fair market rent in 2006 for a 1-bedroom apartment in Morgan County is $365 a month.
Fair market rent for a 2-bedroom apartment is $450 a month.
Fair market rent for a 3-bedroom apartment is $562 a month.
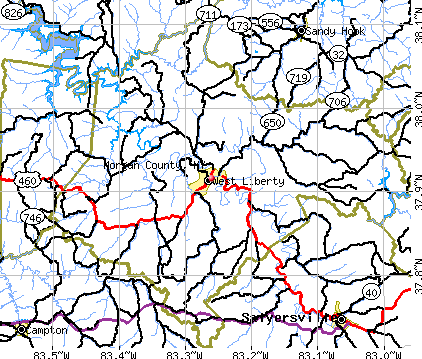
Cities in this county include: West Liberty, Paint Creek, Cannel City, Grassy Creek, Wrigley, Elk Creek, Maytown, Ezel.
2023 air pollution in Morgan County:
Ozone (1-hour): 0.039 ppm (standard limit: 0.12 ppm). Near U.S. average.
Notable locations in this county outside city limits:
Notable locations in Morgan County: Hollywood Springs (A), Blue Grass Camp (B), Devils Backbone (C), Holmhurst Stock Farm (D), Oil Springs (E), Indian Graves (F), Combs Ferry (G), Boones Creek Church Camp (H), Edgewood (I), Moundale (J), Indian Mound (K), Indian Old Fields (L), Camp Richard Clark (M), Wades Mill (N), Locust Grove (O), Point Breeze Stock Farm (P), Clark County Fish and Game Club (Q), Indian Fields (R), Ava Lawn (S), Fruitland (T). Display/hide their locations on the map
Churches in Morgan County include: Ford Church (A), Goshen Baptist Church (B), Dewitt Baptist Church (C), Log Lick Baptist Church (D), Mount Zion Methodist Church (E), Sycamore Baptist Church (F), New Providence Baptist Church (G), Mount Tabor Church (H), Mount Carmel Christian Church (I). Display/hide their locations on the map
Cemeteries: Block Cemetery (1), Prewitt Cemetery (2), Clarmont Memorial Gardens (3), Parrish Cemetery (4), Cottman Cemetery (5), Adams Cemetery (6), Irvin Cemetery (7). Display/hide their locations on the map
Lakes and reservoirs: Codell Lake (A), Winchester Reservoir (B). Display/hide their locations on the map
Streams, rivers, and creeks: Upper Howard Creek (A), Dry Fork (B), Boone Creek (C), Woodruff Creek (D), Cotton Creek (E), Twomile Creek (F), Combs Branch (G), Red River (H), Cabin Creek (I). Display/hide their locations on the map
Neighboring counties: Accomack County, Virginia  , Crawford County, Missouri
  , Daviess County , Franklin County , Wolfe County
  , Woodford County .
| Here: | 5.6% |
| Kentucky: | 3.8% |


Current college students: 420
People 25 years of age or older with a high school degree or higher: 77.5%
People 25 years of age or older with a bachelor's degree or higher: 17.7%
Number of foreign born residents: 175 (15.9% naturalized citizens)
| Morgan County: | 1.3% |
| Whole state: | 4.0% |

- Year of entry for the foreign-born population
- 1442010 or later
- 122000 to 2009
- 311990 to 1999
- 201980 to 1989
- 221970 to 1979
- 9Before 1970
Mean travel time to work (commute): minutes
Percentage of county residents living and working in this county: 99.4%
Housing units in structures:
- One, detached: 3,513
- One, attached: 13
- Two: 3
- 3 or 4: 25
- 5 to 9: 97
- 10 to 19: 80
- 20 or more: 5
- Mobile homes: 1,912
- Boats, RVs, vans, etc.: 32
Housing units in Morgan County with a mortgage: 1,645 (87 second mortgage, 42 home equity loan, 13 both second mortgage and home equity loan)
Houses without a mortgage: 25
| Here: | 3.8% with mortgage |
| State: | 96.8% with mortgage |
Religion statistics for Morgan County

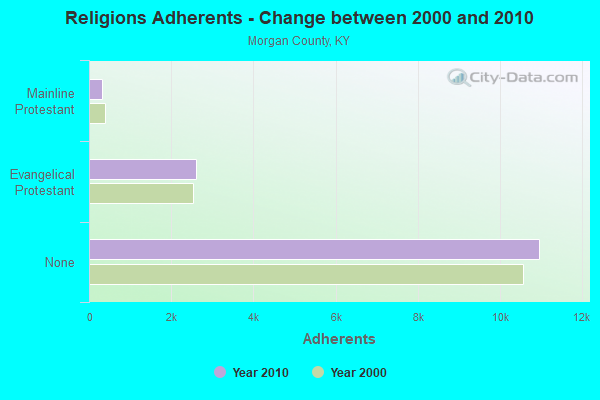
| Religion | Adherents | Congregations |
|---|---|---|
| Evangelical Protestant | 2,600 | 30 |
| Mainline Protestant | 315 | 4 |
| Catholic | 52 | 1 |
| Other | 1 | 1 |
| None | 10,955 | - |
Source: Clifford Grammich, Kirk Hadaway, Richard Houseal, Dale E.Jones, Alexei Krindatch, Richie Stanley and Richard H.Taylor. 2012. 2010 U.S.Religion Census: Religious Congregations & Membership Study. Association of Statisticians of American Religious Bodies. Jones, Dale E., et al. 2002. Congregations and Membership in the United States 2000. Nashville, TN: Glenmary Research Center.
Food Environment Statistics:
| Morgan County: | 4.22 / 10,000 pop. |
| State: | 2.19 / 10,000 pop. |
| This county: | 2.81 / 10,000 pop. |
| Kentucky: | 0.74 / 10,000 pop. |
| Morgan County: | 6.33 / 10,000 pop. |
| Kentucky: | 4.36 / 10,000 pop. |
| This county: | 2.81 / 10,000 pop. |
| State: | 5.74 / 10,000 pop. |
| Morgan County: | 12.1% |
| Kentucky: | 11.0% |
| Morgan County: | 32.2% |
| State: | 30.0% |
| Here: | 17.7% |
| State: | 15.9% |
Agriculture in Morgan County:
Average size of farms: 144 acresAverage value of agricultural products sold per farm: $9,505
Average value of crops sold per acre for harvested cropland: $301.24
The value of livestock, poultry, and their products as a percentage of the total market value of agricultural products sold: 45.13%
Average total farm production expenses per farm: $7,949
Harvested cropland as a percentage of land in farms: 12.05%
Irrigated harvested cropland as a percentage of land in farms: 0.42%
Average market value of all machinery and equipment per farm: $25,039
The percentage of farms operated by a family or individual: 94.15%
Average age of principal farm operators: 52 years
Average number of cattle and calves per 100 acres of all land in farms: 8.37
Milk cows as a percentage of all cattle and calves: 0.71%
Corn for grain: 338 harvested acres
Vegetables: 37 harvested acres
Land in orchards: 12 acres
Tornado activity:
Morgan County historical area-adjusted tornado activity is significantly below Kentucky state average. It is 3454850.8 times below overall U.S. average.Tornadoes in this county have caused 7 fatalities and 34 injuries recorded between 1950 and 2004.
On 4/3/1974, a category 4 (max. wind speeds 207-260 mph) tornado killed 7 people and injured 28 people
Earthquake activity:
Morgan County-area historical earthquake activity is significantly above Kentucky state average. It is 36% greater than the overall U.S. average.On 7/27/1980 at 18:52:21, a magnitude 5.2 (5.1 MB, 4.7 MS, 5.0 UK, 5.2 UK, Class: Moderate, Intensity: VI - VII) earthquake occurred 42.2 miles away from Morgan County center
On 9/7/1988 at 02:28:09, a magnitude 4.6 (4.5 MB, 4.6 LG, Class: Light, Intensity: IV - V) earthquake occurred 37.1 miles away from the county center
On 8/23/2011 at 17:51:04, a magnitude 5.8 (5.8 MW, Depth: 3.7 mi) earthquake occurred 290.5 miles away from the county center
On 8/9/2020 at 12:07:37, a magnitude 5.1 (5.1 MW, Depth: 4.7 mi) earthquake occurred 155.5 miles away from the county center
On 4/18/2008 at 09:36:59, a magnitude 5.4 (5.1 MB, 4.8 MS, 5.4 MW, 5.2 MW) earthquake occurred 254.2 miles away from Morgan County center
On 11/30/1973 at 07:48:41, a magnitude 4.7 (4.7 MB, 4.6 ML) earthquake occurred 151.4 miles away from the county center
Magnitude types: regional Lg-wave magnitude (LG), body-wave magnitude (MB), local magnitude (ML), surface-wave magnitude (MS), moment magnitude (MW)
Most recent natural disasters:
- Kentucky Severe Storms, Flooding, Landslides, And Mudslides, Incident Period: February 3, 2020 - February 29, 2020, Major Disaster (Presidential) Declared DR-4540-KY: April 24, 2020, FEMA Id: 4540, Natural disaster type: Storm, Mudslide, Landslide, Flood
- Kentucky Covid-19 Pandemic, Incident Period: January 20, 2020, FEMA Id: 4497, Natural disaster type: Other
- Kentucky Severe Storms, Straight-line Winds, Flooding, Landslides, And Mudslides, Incident Period: February 6, 2019 - March 10, 2019, FEMA Id: 4428, Natural disaster type: Storm, Mudslide, Landslide, Flood, Wind
- Kentucky Severe Storms, Tornadoes, Straight-line Winds, Flooding, Landslides, and Mudslides, Incident Period: July 11, 2015 to July 20, 2015, Major Disaster (Presidential) Declared DR-4239: August 12, 2015, FEMA Id: 4239, Natural disaster type: Storm, Tornado, Mudslide, Landslide, Flood, Wind
- Kentucky Severe Storms, Tornadoes, Flooding, Landslides, and Mudslides, Incident Period: April 02, 2015 to April 17, 2015, Major Disaster (Presidential) Declared DR-4217: May 01, 2015, FEMA Id: 4217, Natural disaster type: Storm, Tornado, Mudslide, Landslide, Flood
- Kentucky Severe Winter Storm, Snowstorm, Flooding, Landslides, and Mudslides, Incident Period: March 03, 2015 to March 09, 2015, Major Disaster (Presidential) Declared DR-4218: May 12, 2015, FEMA Id: 4218, Natural disaster type: Snowstorm, Winter Storm, Mudslide, Landslide, Flood
- Kentucky Severe Winter Storms, Snowstorms, Flooding, Landslides, and Mudslides, Incident Period: February 15, 2015 to February 23, 2015, Major Disaster (Presidential) Declared DR-4216: April 30, 2015, FEMA Id: 4216, Natural disaster type: Snowstorm, Winter Storm, Mudslide, Landslide, Flood
- Kentucky Severe Storms, Tornadoes, Straight-line Winds, and Flooding, Incident Period: February 29, 2012 to March 03, 2012, Major Disaster (Presidential) Declared DR-4057: March 06, 2012, FEMA Id: 4057, Natural disaster type: Storm, Tornado, Flood, Wind
- Kentucky Severe Storms, Tornadoes, and Flooding, Incident Period: April 12, 2011 to May 20, 2011, Major Disaster (Presidential) Declared DR-1976: May 04, 2011, FEMA Id: 1976, Natural disaster type: Storm, Tornado, Flood
- Kentucky Severe Storms, Flooding, Mudslides, and Tornadoes, Incident Period: May 01, 2010 to June 01, 2010, Major Disaster (Presidential) Declared DR-1912: May 11, 2010, FEMA Id: 1912, Natural disaster type: Storm, Tornado, Mudslide, Flood
- 14 other natural disasters have been reported since 1953.
The number of natural disasters in Morgan County (24) is greater than the US average (15).
Major Disasters (Presidential) Declared: 19
Emergencies Declared: 3
Causes of natural disasters: Floods: 16, Storms: 14, Mudslides: 8, Tornadoes: 7, Winter Storms: 7, Landslides: 6, Winds: 4, Snowstorms: 2, Blizzard: 1, Freeze: 1, Hurricane: 1, Snow: 1, Snowfall: 1, Other: 1 (Note: some incidents may be assigned to more than one category).

Means of transportation to work:
- Drove a car alone: 3,087 (77.2%)
- Carpooled: 386 (9.7%)
- Bus: 24 (0.6%)
- Taxicab, motorcycle, or other means: 15 (0.4%)
- Walked: 14 (0.4%)
- Worked at home: 480 (12.0%)


- Health care and social assistance (19%)
- Educational services (15%)
- Retail trade (12%)
- Public administration (8%)
- Manufacturing (7%)
- Finance and insurance (4%)
- Professional, scientific, and technical services (3%)

- Health care and social assistance (24%)
- Educational services (19%)
- Retail trade (15%)
- Public administration (11%)
- Manufacturing (9%)
- Finance and insurance (5%)
- Professional, scientific, and technical services (4%)

- Construction and extraction occupations (17%)
- Production occupations (16%)
- Management occupations (9%)
- Sales and related occupations (8%)
- Law enforcement workers including supervisors (7%)
- Installation, maintenance, and repair occupations (7%)
- Transportation occupations (6%)

- Office and administrative support occupations (25%)
- Educational instruction, and library occupations (13%)
- Health diagnosing and treating practitioners and other technical occupations (12%)
- Sales and related occupations (10%)
- Health technologists and technicians (5%)
- Material moving occupations (5%)
- Healthcare support occupations (5%)

- Philippines (39%)
- Other Southern Africa (22%)
- Honduras (18%)
- Mexico (7%)
- Canada (5%)
- Somalia (4%)
- Germany (2%)

- American (57%)
- English (14%)
- Irish (6%)
- German (3%)
- Scottish (1%)
- European (1%)
- Scotch-Irish (1%)


People in group quarters in Morgan County, Kentucky in 2010:
- 1,880 people in state prisons
- 57 people in nursing facilities/skilled-nursing facilities
- 38 people in correctional facilities intended for juveniles
People in group quarters in Morgan County, Kentucky in 2000:
- 1,664 people in state prisons
- 78 people in nursing homes
- 43 people in training schools for juvenile delinquents
- 29 people in hospitals/wards and hospices for chronically ill
- 29 people in other hospitals or wards for chronically ill
- 16 people in other workers' dormitories
- 7 people in other noninstitutional group quarters
- 5 people in other group homes
7.68% of this county's 2021 resident taxpayers lived in other counties in 2020 ($30,194 average adjusted gross income)
| Here: | 7.68% |
| Kentucky average: | 7.04% |
10 or fewer of this county's residents moved from foreign countries.
5.85% relocated from other counties in Kentucky ($21,356 average AGI)
1.83% relocated from other states ($8,837 average AGI)
Morgan County: 1.83% Kentucky average: 2.87%

Top counties from which taxpayers relocated into this county between 2020 and 2021:
| from Rowan County, KY |
5.27% of this county's 2020 resident taxpayers moved to other counties in 2021 ($30,067 average adjusted gross income)
| Here: | 5.27% |
| Kentucky average: | 6.89% |
10 or fewer of this county's residents moved to foreign countries.
4.69% relocated to other counties in Kentucky ($27,187 average AGI)
0.57% relocated to other states ($2,881 average AGI)
Morgan County: 0.57% Kentucky average: 2.73%

Top counties to which taxpayers relocated from this county between 2020 and 2021:
| to Rowan County, KY |
Births per 1000 population from 1990 to 1999: 11.4
Births per 1000 population from 2000 to 2006: 10.8

Deaths per 1000 population from 1990 to 1999: 8.8
Deaths per 1000 population from 2000 to 2009: 9.0
Deaths per 1000 population from 2010 to 2020: 10.9

Infant deaths per 1000 live births from 1990 to 1999: 5.9
Infant deaths per 1000 live births from 2000 to 2006: 6.6

Persons under 19 years old without health insurance coverage in 2018: 4.5%


Persons enrolled in hospital insurance and/or supplemental medical insurance (Medicare) in July 1, 2007: 2,419 (1,663 aged, 756 disabled)
Children under 18 without health insurance coverage in 2007: 387 (14%)


Most common underlying causes of death in Morgan County, Kentucky in 1999 - 2019:
- Bronchus or lung, unspecified - Malignant neoplasms (209)
- Acute myocardial infarction, unspecified (125)
- Chronic obstructive pulmonary disease, unspecified (103)
- Congestive heart failure (20)
- Atherosclerotic heart disease (12)
- Cardiac arrest, unspecified (10)
- Unspecified dementia (10)
Population without health insurance coverage in 2000: 18%
Children under 18 without health insurance coverage in 2000: 13%
Short term general hospital admissions per 100,000 population in 2004: 6,065
Short term general hospital beds per 100,000 population in 2004: 279
Emergency room visits per 100,000 population in 2004: 77,451
General practice office based MDs per 100,000 population in 2005: 1,228
Medical specialist MDs per 100,000 population in 2005: 656
Total births per 100,000 population, July 2005 - July 2006 : 30
Total deaths per 100,000 population, July 2005 - July 2006: 42
Limited-service eating places per 100,000 population in 2005 : 7
Crimes per 100,000 population in 1996: 1
Household type by relationship:
Households: 13,868- Male householders: 2,283 (591 living alone), Female householders: 2,538 (641 living alone)
2,588 spouses (2,584 opposite-sex spouses), 355 unmarried partners, (355 opposite-sex unmarried partners), 3,592 children (3,217 natural, 262 adopted, 110 stepchildren), 259 grandchildren, 97 brothers or sisters, 255 parents, 10 foster children, 147 other relatives, 128 non-relatives
- In group quarters: 1,561
Size of family households: 1,505 2-persons, 647 3-persons, 672 4-persons, 280 5-persons, 128 6-persons, 44 7-or-more-persons.
Size of nonfamily households: 1,233 1-person, 307 2-persons.
1,680 married couples with children.
557 single-parent households (78 men, 479 women).
98.3% of residents of Morgan speak English at home.
0.6% of residents speak Spanish at home (87% speak English very well, 13% speak English well).
0.4% of residents speak other Indo-European language at home (100% speak English very well).
0.4% of residents speak Asian or Pacific Island language at home (85% speak English very well, 15% speak English well).
0.1% of residents speak other language at home (47% speak English very well, 53% speak English well).
In fiscal year 2004:
Federal Government expenditure: $81,962,000 ($5,708 per capita)
Department of Defense expenditure: $299,000
Federal direct payments to individuals for retirement and disability: $32,355,000
Federal other direct payments to individuals: $15,866,000
Federal direct payments not to individuals: $205,000
Federal grants: $31,075,000
Federal procurement contracts: $591,000 ($36,000 Department of Defense)
Federal salaries and wages: $1,869,000 ($0,000 Department of Defense)
Federal Government direct loans: $1,386,000
Federal guaranteed/insured loans: $2,605,000
Federal Government insurance: $4,233,000
Population change from April 1, 2000 to July 1, 2005:
Births: 783| Here: | 55 per 1000 residents |
| State: | 69 per 1000 residents |
Deaths: 613
| Here: | 43 per 1000 residents |
| State: | 50 per 1000 residents |
Net international migration: +16
| Here: | +1 per 1000 residents |
| State: | +7 per 1000 residents |
Net internal migration: +218
| Here: | +15 per 1000 residents |
| State: | +8 per 1000 residents |

Total withdrawal of fresh water for public supply: 0.64 millions of gallons per day (all from surface)
| Here: | 6.2 |
| State: | 6.4 |
| Here: | 4.8 |
| State: | 4.4 |

- Year house built in Morgan County, Kentucky
- 612020 or later
- 7832010 to 2019
- 9422000 to 2009
- 1,1331990 to 1999
- 9071980 to 1989
- 8131970 to 1979
- 2661960 to 1969
- 3041950 to 1959
- 851940 to 1949
- 4251939 or earlier

- Rooms in owner-occupied houses in Morgan County, Kentucky
- 211 room
- 82 rooms
- 683 rooms
- 3594 rooms
- 8805 rooms
- 8066 rooms
- 6107 rooms
- 4868 rooms
- 5869+ rooms

- Rooms in renter-occupied apartments in Morgan County, Kentucky
- 261 room
- 132 rooms
- 1043 rooms
- 2694 rooms
- 3135 rooms
- 1316 rooms
- 657 rooms
- 458 rooms
- 329+ rooms

- Bedrooms in owner-occupied houses in Morgan County, Kentucky
- 21no bedroom
- 1111 bedroom
- 6952 bedrooms
- 2,0983 bedrooms
- 7304 bedrooms
- 1745+ bedrooms

- Bedrooms in renter-occupied apartments in Morgan County, Kentucky
- 36no bedroom
- 951 bedroom
- 4572 bedrooms
- 2923 bedrooms
- 724 bedrooms
- 425+ bedrooms

- Cars and other vehicles available in Morgan County in owner-occupied houses/condos
- 135no vehicle
- 8561 vehicle
- 1,3852 vehicles
- 8743 vehicles
- 3934 vehicles
- 1695+ vehicles

- Cars and other vehicles available in Morgan County in renter-occupied apartments
- 172no vehicle
- 4611 vehicle
- 2862 vehicles
- 593 vehicles
- 204 vehicles
- 95+ vehicles
93.7% of Morgan County residents lived in the same house 1 years ago.
Out of people who lived in different houses, 28% lived in this county.
Out of people who lived in different counties, 93% lived in Kentucky.
| Morgan County: | 93.7% |
| State average: | 87.2% |
Place of birth for U.S.-born residents:
- This state: 11,118
- Other state: 2,443
- Northeast: 246
- Midwest: 1,457
- South: 632
- West: 91


- 57.2%Electricity
- 23.3%Bottled, tank, or LP gas
- 9.7%Wood
- 7.7%Utility gas
- 0.9%Fuel oil, kerosene, etc.
- 0.7%Coal or coke
- 0.3%Other fuel
- 0.2%No fuel used

- 60.4%Electricity
- 29.3%Bottled, tank, or LP gas
- 5.4%Wood
- 2.7%Utility gas
- 2.2%Fuel oil, kerosene, etc.
Private vs. public school enrollment:
| Here: | 11.5% |
| Kentucky: | 17.2% |
| Here: | 5.7% |
| Kentucky: | 15.2% |
| Here: | 7.3% |
| Kentucky: | 19.6% |


Morgan County government finances - Expenditure in 2018:
- Bond Funds - Cash and Securities: $402,000
- Charges - Other: $124,000
- Construction - Regular Highways: $139,000
- Current Operations - General - Other: $1,719,000
Regular Highways: $716,000
Central Staff Services: $277,000
Financial Administration: $234,000
Police Protection: $232,000
Solid Waste Management: $215,000
General Public Buildings: $200,000
Parks and Recreation: $183,000
Correctional Institutions: $121,000
Local Fire Protection: $81,000
Health - Other: $76,000
Judicial and Legal Services: $55,000
Public Welfare - Other: $5,000
Natural Resources - Other: $4,000
Sewerage: $1,000
- Federal Intergovernmental - Other: $43,000
Health and Hospitals: $4,000
- General - Interest on Debt: $2,000
- Intergovernmental to Local - Other - Correctional Institutions: $415,000
- Intergovernmental to State - Central Staff Services: $4,000
- Long Term Debt - Beginning Outstanding - Unspecified Public Purpose: $56,000
Retired Unspecified Public Purpose: $56,000
- Miscellaneous - Donations From Private Sources: $295,000
Rents: $217,000
Sale of Property: $149,000
General Revenue - Other: $59,000
Interest Earnings: $1,000
- Other Capital Outlay - General - Other: $418,000
Regular Highways: $294,000
Libraries: $147,000
Correctional Institutions: $38,000
Health - Other: $32,000
- Other Funds - Cash and Securities: $609,000
- State Intergovernmental - Highways: $1,504,000
Other: $1,254,000
General Local Government Support: $2,000
- Tax - Individual Income: $1,492,000
Insurance Premiums Sales: $498,000
Property: $374,000
Public Utilities Sales: $55,000
Documentary and Stock Transfer: $11,000
- Total Salaries and Wages: $1,166,000
Morgan County government finances - Revenue in 2018:
- Bond Funds - Cash and Securities: $402,000
- Charges - Other: $124,000
- Construction - Regular Highways: $139,000
- Current Operations - General - Other: $1,719,000
Regular Highways: $716,000
Central Staff Services: $277,000
Financial Administration: $234,000
Police Protection: $232,000
Solid Waste Management: $215,000
General Public Buildings: $200,000
Parks and Recreation: $183,000
Correctional Institutions: $121,000
Local Fire Protection: $81,000
Health - Other: $76,000
Judicial and Legal Services: $55,000
Public Welfare - Other: $5,000
Natural Resources - Other: $4,000
Sewerage: $1,000
- Federal Intergovernmental - Other: $43,000
Health and Hospitals: $4,000
- General - Interest on Debt: $2,000
- Intergovernmental to Local - Other - Correctional Institutions: $415,000
- Intergovernmental to State - Central Staff Services: $4,000
- Long Term Debt - Beginning Outstanding - Unspecified Public Purpose: $56,000
Retired Unspecified Public Purpose: $56,000
- Miscellaneous - Donations From Private Sources: $295,000
Rents: $217,000
Sale of Property: $149,000
General Revenue - Other: $59,000
Interest Earnings: $1,000
- Other Capital Outlay - General - Other: $418,000
Regular Highways: $294,000
Libraries: $147,000
Correctional Institutions: $38,000
Health - Other: $32,000
- Other Funds - Cash and Securities: $609,000
- State Intergovernmental - Highways: $1,504,000
Other: $1,254,000
General Local Government Support: $2,000
- Tax - Individual Income: $1,492,000
Insurance Premiums Sales: $498,000
Property: $374,000
Public Utilities Sales: $55,000
Documentary and Stock Transfer: $11,000
- Total Salaries and Wages: $1,166,000
Morgan County government finances - Debt in 2018:
- Bond Funds - Cash and Securities: $402,000
- Charges - Other: $124,000
- Construction - Regular Highways: $139,000
- Current Operations - General - Other: $1,719,000
Regular Highways: $716,000
Central Staff Services: $277,000
Financial Administration: $234,000
Police Protection: $232,000
Solid Waste Management: $215,000
General Public Buildings: $200,000
Parks and Recreation: $183,000
Correctional Institutions: $121,000
Local Fire Protection: $81,000
Health - Other: $76,000
Judicial and Legal Services: $55,000
Public Welfare - Other: $5,000
Natural Resources - Other: $4,000
Sewerage: $1,000
- Federal Intergovernmental - Other: $43,000
Health and Hospitals: $4,000
- General - Interest on Debt: $2,000
- Intergovernmental to Local - Other - Correctional Institutions: $415,000
- Intergovernmental to State - Central Staff Services: $4,000
- Long Term Debt - Beginning Outstanding - Unspecified Public Purpose: $56,000
Retired Unspecified Public Purpose: $56,000
- Miscellaneous - Donations From Private Sources: $295,000
Rents: $217,000
Sale of Property: $149,000
General Revenue - Other: $59,000
Interest Earnings: $1,000
- Other Capital Outlay - General - Other: $418,000
Regular Highways: $294,000
Libraries: $147,000
Correctional Institutions: $38,000
Health - Other: $32,000
- Other Funds - Cash and Securities: $609,000
- State Intergovernmental - Highways: $1,504,000
Other: $1,254,000
General Local Government Support: $2,000
- Tax - Individual Income: $1,492,000
Insurance Premiums Sales: $498,000
Property: $374,000
Public Utilities Sales: $55,000
Documentary and Stock Transfer: $11,000
- Total Salaries and Wages: $1,166,000
Morgan County government finances - Cash and Securities in 2018:
- Bond Funds - Cash and Securities: $402,000
- Charges - Other: $124,000
- Construction - Regular Highways: $139,000
- Current Operations - General - Other: $1,719,000
Regular Highways: $716,000
Central Staff Services: $277,000
Financial Administration: $234,000
Police Protection: $232,000
Solid Waste Management: $215,000
General Public Buildings: $200,000
Parks and Recreation: $183,000
Correctional Institutions: $121,000
Local Fire Protection: $81,000
Health - Other: $76,000
Judicial and Legal Services: $55,000
Public Welfare - Other: $5,000
Natural Resources - Other: $4,000
Sewerage: $1,000
- Federal Intergovernmental - Other: $43,000
Health and Hospitals: $4,000
- General - Interest on Debt: $2,000
- Intergovernmental to Local - Other - Correctional Institutions: $415,000
- Intergovernmental to State - Central Staff Services: $4,000
- Long Term Debt - Beginning Outstanding - Unspecified Public Purpose: $56,000
Retired Unspecified Public Purpose: $56,000
- Miscellaneous - Donations From Private Sources: $295,000
Rents: $217,000
Sale of Property: $149,000
General Revenue - Other: $59,000
Interest Earnings: $1,000
- Other Capital Outlay - General - Other: $418,000
Regular Highways: $294,000
Libraries: $147,000
Correctional Institutions: $38,000
Health - Other: $32,000
- Other Funds - Cash and Securities: $609,000
- State Intergovernmental - Highways: $1,504,000
Other: $1,254,000
General Local Government Support: $2,000
- Tax - Individual Income: $1,492,000
Insurance Premiums Sales: $498,000
Property: $374,000
Public Utilities Sales: $55,000
Documentary and Stock Transfer: $11,000
- Total Salaries and Wages: $1,166,000
Supplemental Security Income (SSI) in 2006:
- Total number of recipients: 1,196
- Number of aged recipients: 97
- Number of blind and disabled recipients: 1,099
- Number of recipients under 18: 121
- Number of recipients between 18 and 64: 770
- Number of recipients older than 64: 305
- Number of recipients also receiving OASDI: 426
- Amount of payments (thousands of dollars): 547
| Most common first names in Morgan County, KY among deceased individuals | ||
| Name | Count | Lived (average) |
|---|---|---|
| James | 53 | 69.4 years |
| John | 49 | 73.3 years |
| William | 41 | 74.9 years |
| Mary | 36 | 76.3 years |
| Charles | 23 | 67.5 years |
| Walter | 22 | 75.8 years |
| Robert | 18 | 70.7 years |
| Anna | 17 | 80.1 years |
| Henry | 16 | 74.2 years |
| Nannie | 15 | 83.7 years |
| Most common last names in Morgan County, KY among deceased individuals | ||
| Last name | Count | Lived (average) |
|---|---|---|
| Lewis | 59 | 77.7 years |
| Smith | 57 | 73.3 years |
| Perry | 48 | 72.9 years |
| Williams | 47 | 76.9 years |
| Ferguson | 47 | 76.1 years |
| Cantrell | 45 | 73.1 years |
| Adkins | 40 | 73.0 years |
| Cox | 37 | 75.6 years |
| Wright | 35 | 75.4 years |
| Johnson | 32 | 75.7 years |
| Businesses in Morgan County, KY | ||||
| Name | Count | Name | Count | |
|---|---|---|---|---|
| AT&T | 1 | Long John Silver's | 1 | |
| Advance Auto Parts | 1 | McDonald's | 2 | |
| Arby's | 1 | Papa John's Pizza | 1 | |
| Curves | 1 | RadioShack | 2 | |
| Dairy Queen | 1 | Rite Aid | 1 | |
| Days Inn | 1 | Subway | 2 | |
| Ford | 1 | U-Haul | 2 | |
| H&R Block | 2 | UPS | 2 | |
| Little Caesars Pizza | 1 | |||