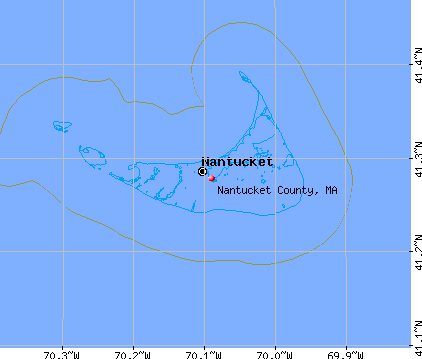
Nantucket County, Massachusetts (MA)
County owner-occupied free and clear houses and condos in 2010: 701
County owner-occupied houses and condos in 2000: 2,333
Renter-occupied apartments: 1,754 (it was 1,366 in 2000)
| % of renters here: | 37% |
| State: | 38% |
Land area: 48 sq. mi.
Water area: 255.8 sq. mi.
Population density: 294 people per square mile (high).
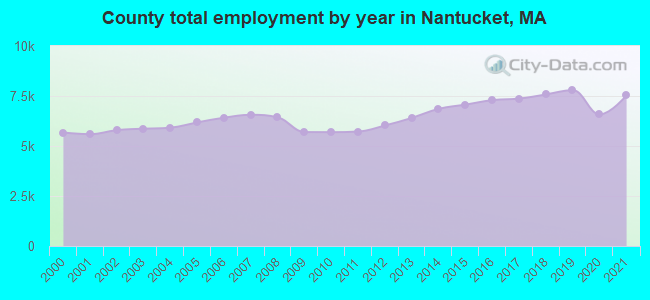
Industries providing employment: Educational, health and social services (22.9%), Construction (18.5%), Professional, scientific, management, administrative, and waste management services (18.2%).
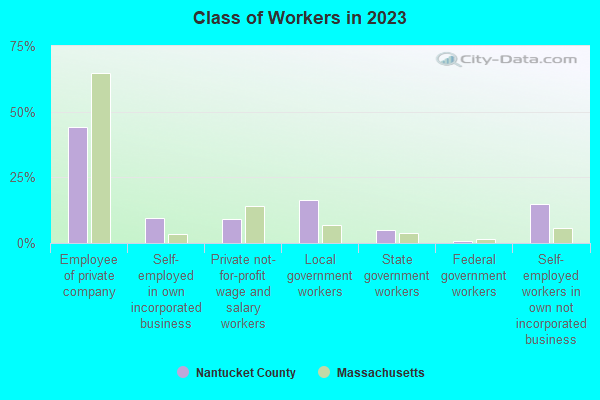
Type of workers:
- Private wage or salary: 70%
- Government: 14%
- Self-employed, not incorporated: 16%
- Unpaid family work: 0%
- OSM Map
- General Map
- Google Map
- MSN Map

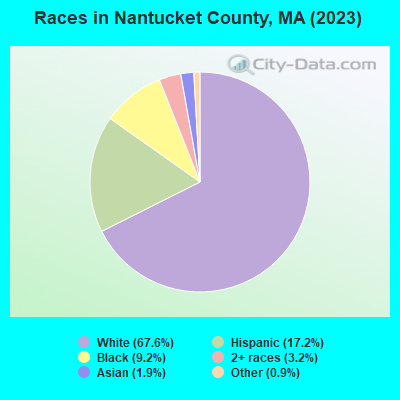
- 9,67869.3%White Non-Hispanic Alone
- 2,19615.7%Hispanic or Latino
- 1,3179.4%Black Non-Hispanic Alone
- 3702.6%Two or more races
- 2681.9%Asian alone
- 1421.0%Some other race alone
| Median resident age: | 41.0 years |
| Massachusetts median age: | 40.3 years |
| Males: 7,722 | |
| Females: 6,338 |

 | Population slightly down in MA 2022 (362 replies) |
| Boston area population lost 2020-2021 (122 replies) |
| Nantucket County: | 2.0 people |
| Massachusetts: | 2 people |
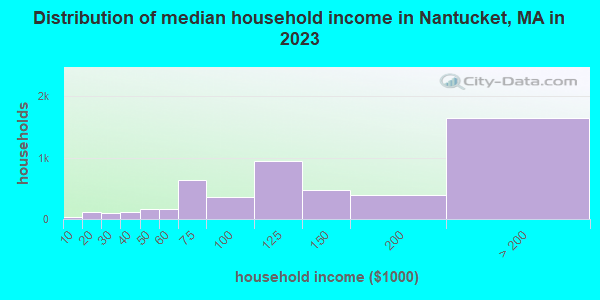
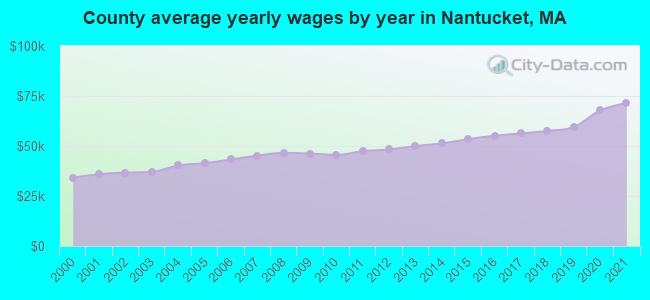
Estimated median household income in 2022: $132,756 ($55,522 in 1999)
| This county: | $132,756 |
| Massachusetts: | $94,488 |
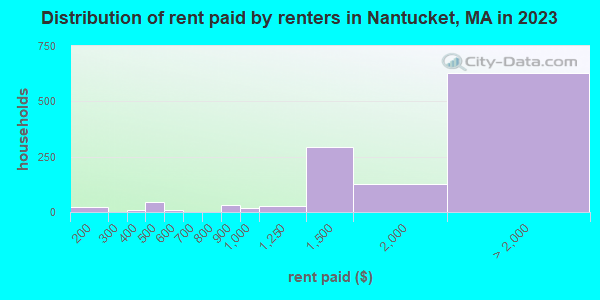
Median contract rent in 2022 for apartments: $1,835 (lower quartile is $1,372, upper quartile is $2,755)
| This county: | $1835 |
| State: | $1446 |
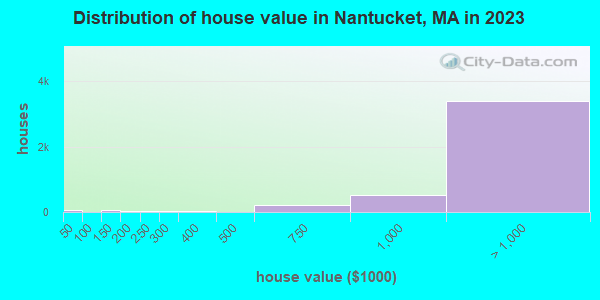
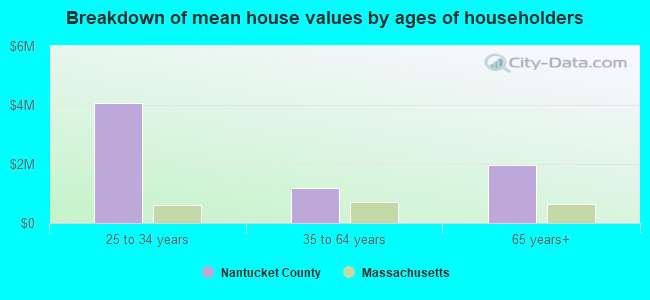
Estimated median house or condo value in 2022: $1,398,463 (it was $583,500 in 2000)
| Nantucket: | $1,398,463 |
| Massachusetts: | $534,700 |
Mean price in 2022:
Median monthly housing costs for homes and condos with a mortgage: $3,685Detached houses: $1,897,027
Here: $1,897,027 State: $651,570 Townhouses or other attached units: $902,431
Here: $902,431 State: $617,749 In 2-unit structures: $1,421,666
Here: $1,421,666 State: $594,808
Median monthly housing costs for units without a mortgage: $1,082
Institutionalized population: 35
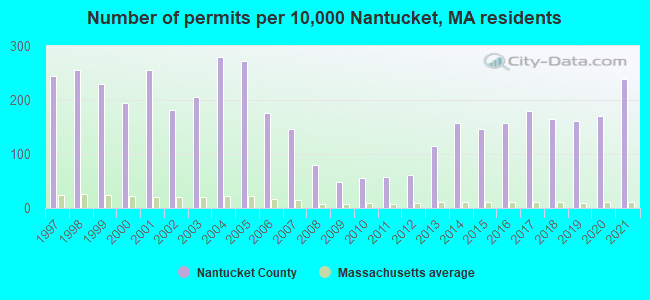
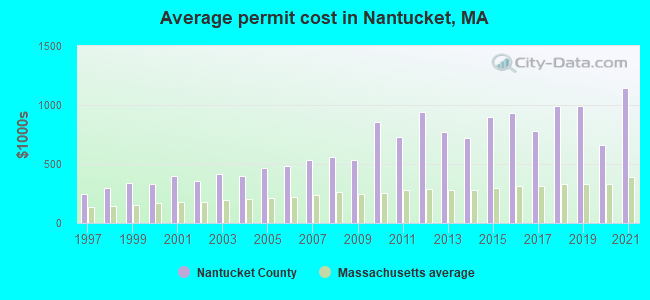
Single-family new house construction building permits:
- 2022: 209 buildings, average cost: $1,250,900
- 2021: 227 buildings, average cost: $1,144,500
- 2020: 162 buildings, average cost: $660,400
- 2019: 154 buildings, average cost: $993,900
- 2018: 157 buildings, average cost: $993,900
- 2017: 170 buildings, average cost: $782,400
- 2016: 150 buildings, average cost: $933,000
- 2015: 140 buildings, average cost: $896,400
- 2014: 149 buildings, average cost: $722,300
- 2013: 109 buildings, average cost: $770,200
- 2012: 58 buildings, average cost: $942,100
- 2011: 54 buildings, average cost: $731,900
- 2010: 53 buildings, average cost: $852,800
- 2009: 46 buildings, average cost: $530,200
- 2008: 76 buildings, average cost: $562,400
- 2007: 139 buildings, average cost: $534,300
- 2006: 168 buildings, average cost: $487,400
- 2005: 260 buildings, average cost: $466,800
- 2004: 267 buildings, average cost: $398,000
- 2003: 196 buildings, average cost: $412,900
- 2002: 173 buildings, average cost: $357,200
- 2001: 243 buildings, average cost: $401,100
- 2000: 185 buildings, average cost: $328,400
- 1999: 218 buildings, average cost: $335,500
- 1998: 244 buildings, average cost: $298,600
- 1997: 233 buildings, average cost: $242,200
Median real estate property taxes paid for housing units with mortgages in 2022: $3,440 (0.3%)
Median real estate property taxes paid for housing units with no mortgage in 2022: $3,737 (0.2%)
| Nantucket County: | 5.2% |
| Massachusetts: | 10.4% |
Median age of residents in 2022: 41.0 years old
(Males: 39.3 years old, Females: 42.4 years old)
(Median age for: White residents: 46.0 years old, Black residents: 44.9 years old, Asian residents: 26.0 years old, Hispanic or Latino residents: 26.9 years old, Other race residents: 12.2 years old)
Area name: Nantucket County, MA
Fair market rent in 2006 for a 1-bedroom apartment in Nantucket County is $1200 a month.
Fair market rent for a 2-bedroom apartment is $1332 a month.
Fair market rent for a 3-bedroom apartment is $1593 a month.
Cities in this county include: Nantucket, Madaket, Siasconset.
Neighboring counties: Cuyahoga County, Ohio  , Elk County, Pennsylvania , Kosciusko County, Indiana , Montour County, Pennsylvania , Seneca County, Ohio , White County, Indiana .
Current college students: 250
People 25 years of age or older with a high school degree or higher: 97.3%
People 25 years of age or older with a bachelor's degree or higher: 57.4%
Number of foreign born residents: 1,883 (53.8% naturalized citizens)
| Nantucket County: | 13.4% |
| Whole state: | 18.0% |
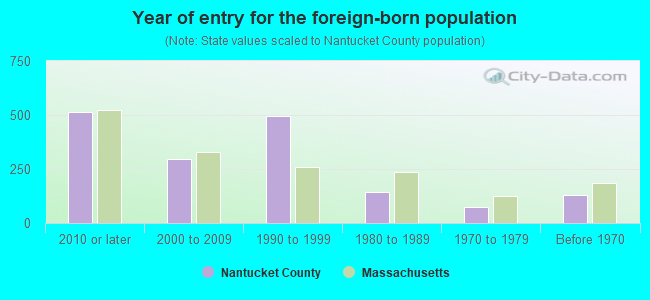
- Year of entry for the foreign-born population
- 5662010 or later
- 5432000 to 2009
- 2231990 to 1999
- 1451980 to 1989
- 761970 to 1979
- 129Before 1970
Mean travel time to work (commute): minutes
Percentage of county residents living and working in this county: 99.3%
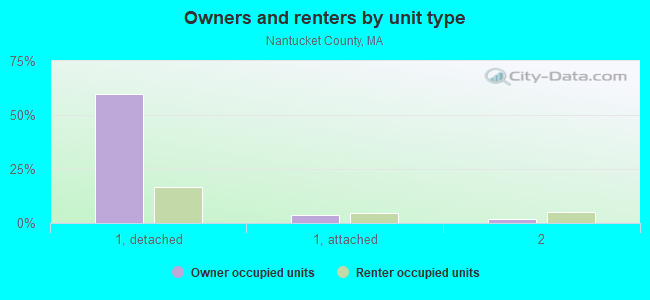
Housing units in structures:
- One, detached: 10,331
- One, attached: 692
- Two: 701
- 3 or 4: 116
- 5 to 9: 164
- 10 to 19: 12
- 20 to 49: 121
- 50 or more: 58
- Mobile homes: 61
- Boats, RVs, vans, etc.: 44
Housing units in Nantucket County with a mortgage: 2,167 (367 second mortgage, 0 home equity loan, 301 both second mortgage and home equity loan)
Houses without a mortgage: 53
| Here: | 3.6% with mortgage |
| State: | 96.2% with mortgage |
Religion statistics for Nantucket County
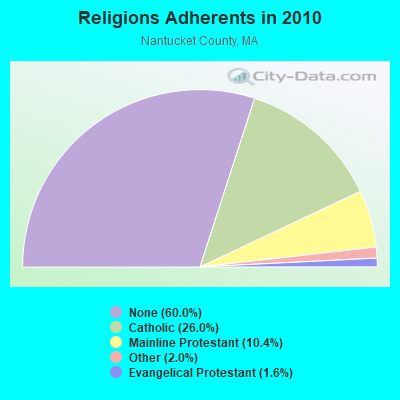
| Religion | Adherents | Congregations |
|---|---|---|
| Catholic | 2,642 | 1 |
| Mainline Protestant | 1,058 | 5 |
| Other | 207 | 2 |
| Evangelical Protestant | 158 | 2 |
| None | 6,107 | - |
Source: Clifford Grammich, Kirk Hadaway, Richard Houseal, Dale E.Jones, Alexei Krindatch, Richie Stanley and Richard H.Taylor. 2012. 2010 U.S.Religion Census: Religious Congregations & Membership Study. Association of Statisticians of American Religious Bodies. Jones, Dale E., et al. 2002. Congregations and Membership in the United States 2000. Nashville, TN: Glenmary Research Center.
Food Environment Statistics:
| Nantucket County: | 4.52 / 10,000 pop. |
| State: | 1.98 / 10,000 pop. |
| This county: | 3.62 / 10,000 pop. |
| Massachusetts: | 2.22 / 10,000 pop. |
| Nantucket County: | 0.90 / 10,000 pop. |
| Massachusetts: | 1.77 / 10,000 pop. |
| This county: | 41.59 / 10,000 pop. |
| State: | 8.76 / 10,000 pop. |
| Nantucket County: | 7.0% |
| Massachusetts: | 8.1% |
| Nantucket County: | 19.9% |
| State: | 22.5% |
| Here: | 16.2% |
| State: | 16.5% |
Agriculture in Nantucket County:
Average value of agricultural products sold per farm: $205,939The value of livestock, poultry, and their products as a percentage of the total market value of agricultural products sold: 0.00%
Average total farm production expenses per farm: $118,078
The percentage of farms operated by a family or individual: 69.23%
Average age of principal farm operators: 53 years
Earthquake activity:
Nantucket County-area historical earthquake activity is significantly above Massachusetts state average. It is 79% smaller than the overall U.S. average.On 8/22/1992 at 12:20:32, a magnitude 4.8 (4.8 MB, 3.8 MS, 4.7 LG, Depth: 6.2 mi, Class: Light, Intensity: IV - V) earthquake occurred 150.6 miles away from Nantucket County center
On 10/16/2012 at 23:12:25, a magnitude 4.7 (4.7 ML, Depth: 10.0 mi) earthquake occurred 163.1 miles away from the county center
On 10/7/1983 at 10:18:46, a magnitude 5.3 (5.1 MB, 5.3 LG, 5.1 ML, Class: Moderate, Intensity: VI - VII) earthquake occurred 284.7 miles away from the county center
On 1/19/1982 at 00:14:42, a magnitude 4.7 (4.5 MB, 4.7 MD, 4.5 LG) earthquake occurred 172.0 miles away from the county center
On 4/20/2002 at 10:50:47, a magnitude 5.3 (5.3 ML, Depth: 3.0 mi) earthquake occurred 288.9 miles away from Nantucket County center
On 4/20/2002 at 10:50:47, a magnitude 5.2 (5.2 MB, 4.2 MS, 5.2 MW, 5.0 MW) earthquake occurred 288.2 miles away from the county center
Magnitude types: regional Lg-wave magnitude (LG), body-wave magnitude (MB), duration magnitude (MD), local magnitude (ML), surface-wave magnitude (MS), moment magnitude (MW)
Most recent natural disasters:
- Massachusetts Covid-19 Pandemic, Incident Period: January 20, 2020, FEMA Id: 4496, Natural disaster type: Other
- Massachusetts Severe Winter Storm And Flooding, Incident Period: March 2, 2018 - March 3, 2018, FEMA Id: 4372, Natural disaster type: Winter Storm, Flood
- Massachusetts Severe Winter Storm, Snowstorm, and Flooding, Incident Period: January 26, 2015 to January 29, 2015, Major Disaster (Presidential) Declared DR-4214: April 13, 2015, FEMA Id: 4214, Natural disaster type: Snowstorm, Winter Storm, Flood
- Massachusetts Severe Winter Storm, Snowstorm, and Flooding, Incident Period: February 08, 2013 to February 10, 2013, Major Disaster (Presidential) Declared DR-4110: April 19, 2013, FEMA Id: 4110, Natural disaster type: Snowstorm, Winter Storm, Flood
- Massachusetts Hurricane Sandy, Incident Period: October 27, 2012 to November 08, 2012, Emergency Declared EM-3350: October 28, 2012, FEMA Id: 3350, Natural disaster type: Hurricane
- Massachusetts Hurricane Sandy, Incident Period: October 27, 2012 to November 08, 2012, Major Disaster (Presidential) Declared DR-4097: December 19, 2012, FEMA Id: 4097, Natural disaster type: Hurricane
- Massachusetts Hurricane Irene, Incident Period: August 26, 2011 to September 05, 2011, Emergency Declared EM-3330: August 26, 2011, FEMA Id: 3330, Natural disaster type: Hurricane
- Massachusetts Hurricane Earl, Incident Period: September 01, 2010 to September 04, 2010, Emergency Declared EM-3315: September 02, 2010, FEMA Id: 3315, Natural disaster type: Hurricane
- Massachusetts Hurricane Katrina Evacuation, Incident Period: August 29, 2005 to October 01, 2005, Emergency Declared EM-3252: September 13, 2005, FEMA Id: 3252, Natural disaster type: Hurricane
- Massachusetts Snow, Incident Period: January 22, 2005 to January 23, 2005, Emergency Declared EM-3201: February 17, 2005, FEMA Id: 3201, Natural disaster type: Snow
- 7 other natural disasters have been reported since 1953.
The number of natural disasters in Nantucket County (17) is near the US average (15).
Major Disasters (Presidential) Declared: 8
Emergencies Declared: 7
Causes of natural disasters: Hurricanes: 6, Floods: 4, Snowstorms: 3, Storms: 3, Winter Storms: 3, Blizzards: 2, Snows: 2, Snowfall: 1, Wind: 1, Other: 1 (Note: some incidents may be assigned to more than one category).
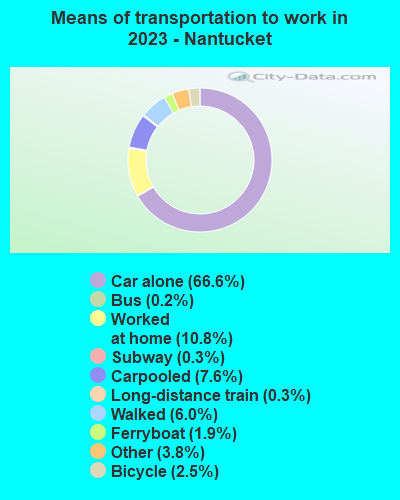
Means of transportation to work:
- Drove a car alone: 5,270 (63.7%)
- Carpooled: 678 (8.2%)
- Bus: 49 (0.6%)
- Subway or elevated rail: 14 (0.2%)
- Ferryboat: 159 (1.9%)
- Taxicab, motorcycle, or other means: 396 (4.8%)
- Bicycle: 150 (1.8%)
- Walked: 581 (7.0%)
- Worked at home: 976 (11.8%)
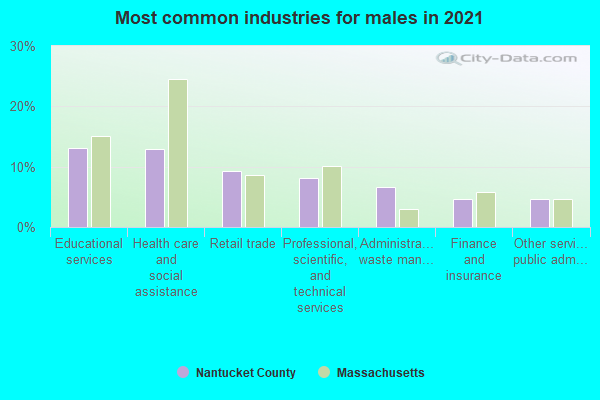
- Health care and social assistance (14%)
- Professional, scientific, and technical services (11%)
- Educational services (11%)
- Retail trade (9%)
- Accommodation and food services (5%)
- Real estate and rental and leasing (5%)
- Administrative and support and waste management services (5%)
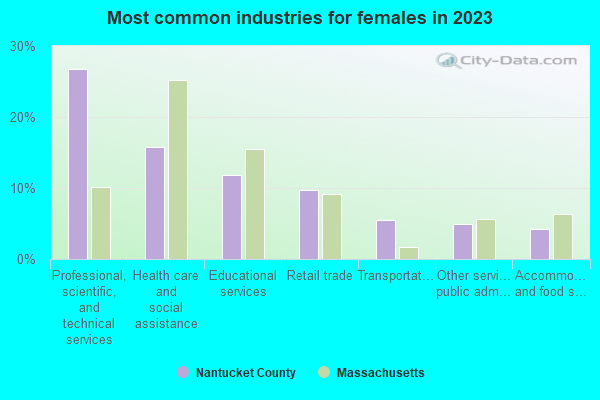
- Health care and social assistance (17%)
- Professional, scientific, and technical services (14%)
- Educational services (13%)
- Retail trade (11%)
- Accommodation and food services (7%)
- Real estate and rental and leasing (6%)
- Administrative and support and waste management services (6%)
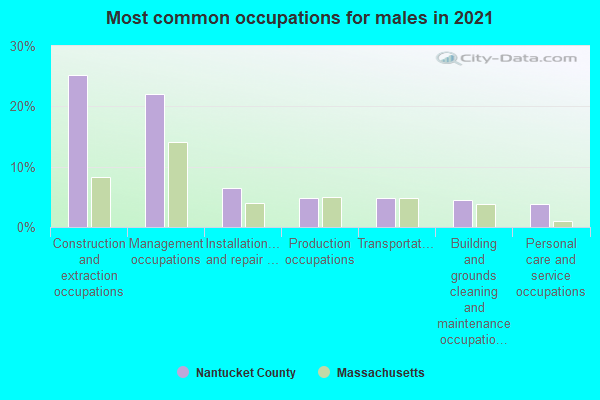
- Construction and extraction occupations (25%)
- Management occupations (18%)
- Educational instruction, and library occupations (7%)
- Building and grounds cleaning and maintenance occupations (6%)
- Food preparation and serving related occupations (6%)
- Production occupations (5%)
- Transportation occupations (4%)
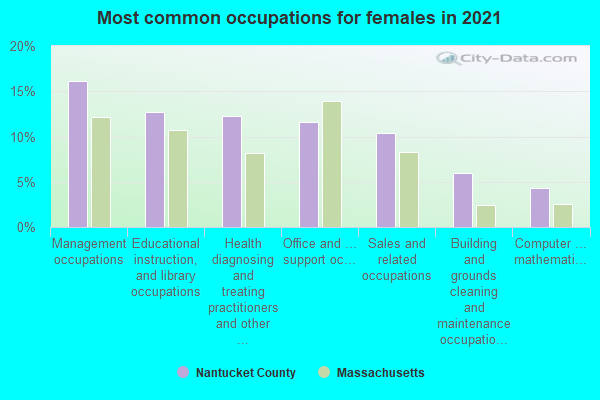
- Management occupations (19%)
- Sales and related occupations (13%)
- Office and administrative support occupations (10%)
- Educational instruction, and library occupations (9%)
- Health diagnosing and treating practitioners and other technical occupations (8%)
- Building and grounds cleaning and maintenance occupations (6%)
- Arts, design, entertainment, sports, and media occupations (6%)
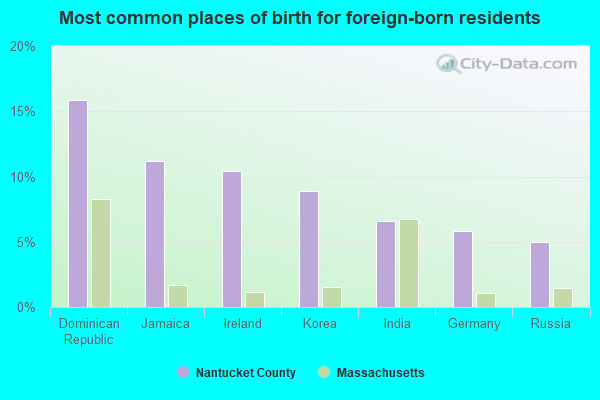
- Dominican Republic (13%)
- Korea (10%)
- Ireland (9%)
- Jamaica (7%)
- Russia (6%)
- Germany (5%)
- Peru (5%)
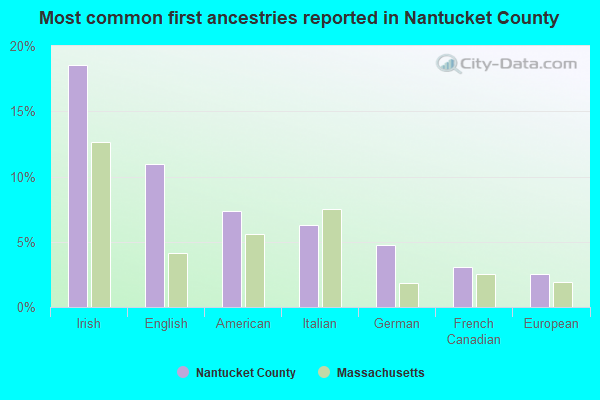
- Irish (18%)
- English (10%)
- American (9%)
- German (4%)
- Italian (3%)
- Serbian (2%)
- Polish (2%)
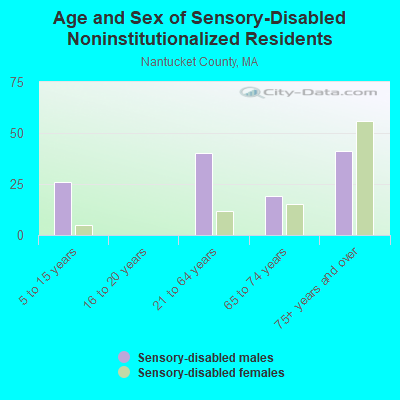
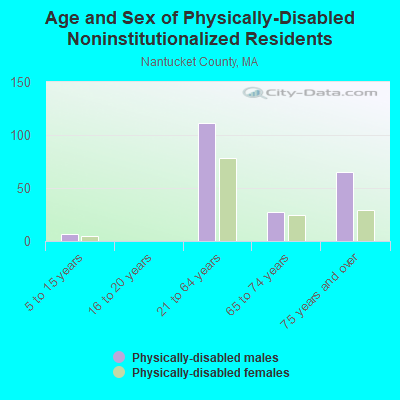
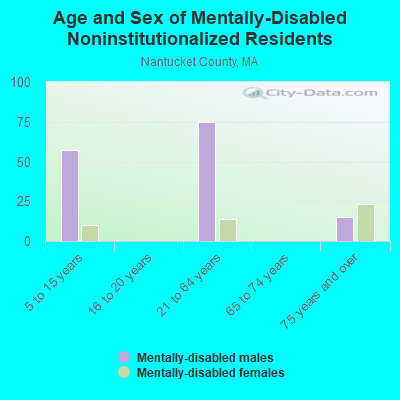
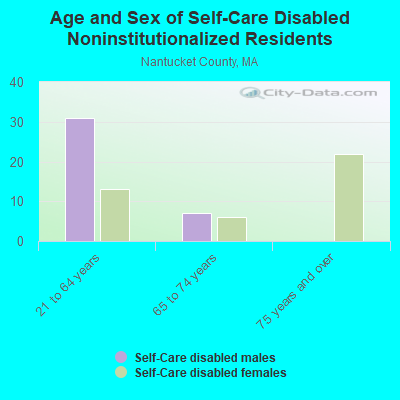
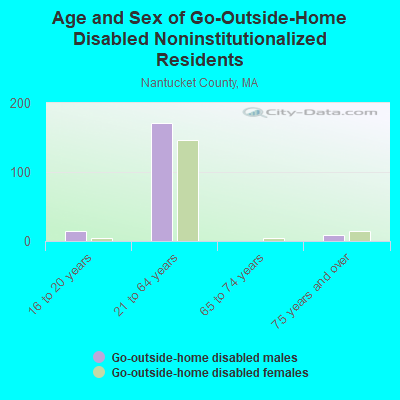
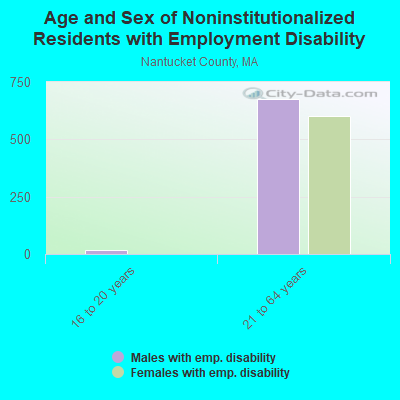
People in group quarters in Nantucket County, Massachusetts in 2010:
- 35 people in nursing facilities/skilled-nursing facilities
- 19 people in workers' group living quarters and job corps centers
- 4 people in group homes intended for adults
People in group quarters in Nantucket County, Massachusetts in 2000:
- 659 people in other workers' dormitories
- 43 people in nursing homes
- 39 people in other noninstitutional group quarters
- 12 people in other group homes
- 6 people in homes for the mentally ill
7.17% of this county's 2021 resident taxpayers lived in other counties in 2020 ($246,019 average adjusted gross income)
| Here: | 7.17% |
| Massachusetts average: | 6.35% |
10 or fewer of this county's residents moved from foreign countries.
2.07% relocated from other counties in Massachusetts ($58,064 average AGI)
5.10% relocated from other states ($187,955 average AGI)
Nantucket County: 5.10% Massachusetts average: 2.58%
Top counties from which taxpayers relocated into this county between 2020 and 2021:
| from New York County, NY | |
| from Suffolk County, MA | |
| from Middlesex County, MA | |
| from Fairfield County, CT | |
| from Barnstable County, MA |
6.02% of this county's 2020 resident taxpayers moved to other counties in 2021 ($167,362 average adjusted gross income)
| Here: | 6.02% |
| Massachusetts average: | 7.18% |
10 or fewer of this county's residents moved to foreign countries.
2.02% relocated to other counties in Massachusetts ($37,074 average AGI)
4.00% relocated to other states ($130,291 average AGI)
Nantucket County: 4.00% Massachusetts average: 3.43%
Top counties to which taxpayers relocated from this county between 2020 and 2021:
| to Barnstable County, MA |
Births per 1000 population from 1990 to 1999: 14.5
Births per 1000 population from 2000 to 2006: 14.4

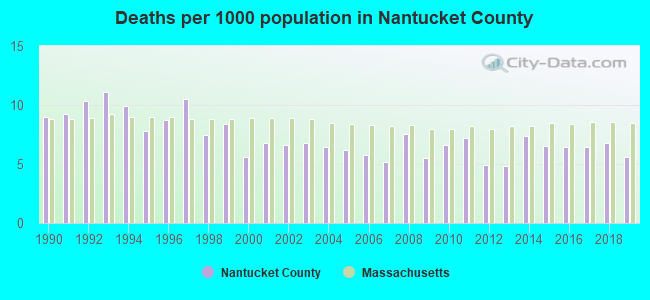
Deaths per 1000 population from 1990 to 1999: 9.2
Deaths per 1000 population from 2000 to 2009: 6.2
Deaths per 1000 population from 2010 to 2020: 6.3
Infant deaths per 1000 live births from 1990 to 1999: 9.7
Infant deaths per 1000 live births from 2000 to 2006: 6.3

Persons under 19 years old without health insurance coverage in 2018: 2.0%

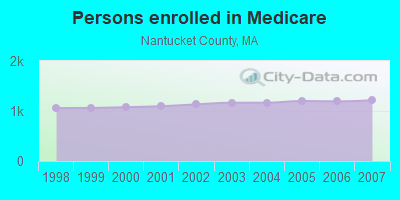
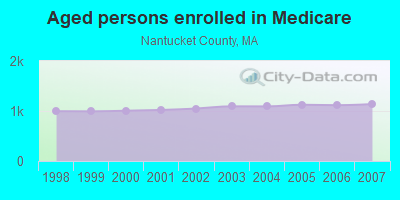
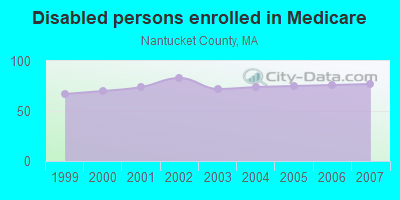
Persons enrolled in hospital insurance and/or supplemental medical insurance (Medicare) in July 1, 2007: 1,215 (1,138 aged, 77 disabled)
Most common underlying causes of death in Nantucket County, Massachusetts in 1999 - 2019:
- Atherosclerotic heart disease (37)
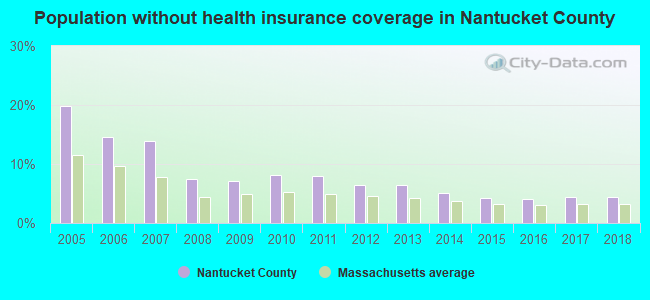
Population without health insurance coverage in 2000: 6%
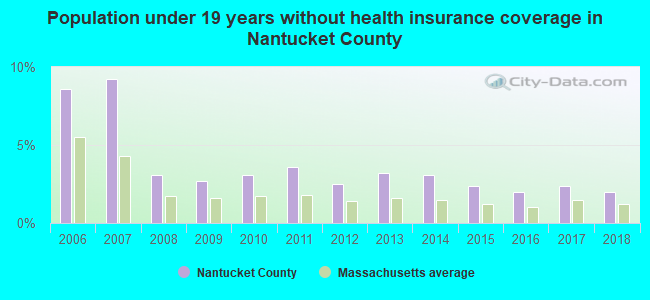
Children under 18 without health insurance coverage in 2000: 4%
Short term general hospital admissions per 100,000 population in 2004: 7,428
Short term general hospital beds per 100,000 population in 2004: 148
Emergency room visits per 100,000 population in 2004: 103,941
General practice office based MDs per 100,000 population in 2005: 1,298
Medical specialist MDs per 100,000 population in 2005: 806
Dentists per 100,000 population in 1998: 69
Total births per 100,000 population, July 2005 - July 2006 : 51
Total deaths per 100,000 population, July 2005 - July 2006: 226
Limited-service eating places per 100,000 population in 2005 : 59
Beer, wine & liquor stores per 100,000 population in 2005: 1
EPA green book nonattainment status in 2004-2006: 1
Household type by relationship:
Households: 14,060- Male householders: 2,137 (389 living alone), Female householders: 2,620 (845 living alone)
2,724 spouses (2,398 opposite-sex spouses), 319 unmarried partners, (277 opposite-sex unmarried partners), 3,880 children (3,702 natural, 25 adopted, 149 stepchildren), 376 grandchildren, 152 brothers or sisters, 145 parents, 0 foster children, 103 other relatives, 1,226 non-relatives
- In group quarters: 293
Size of family households: 1,580 2-persons, 360 3-persons, 907 4-persons, 169 5-persons, 203 6-persons, 27 7-or-more-persons.
Size of nonfamily households: 1,235 1-person, 131 2-persons, 17 3-persons, 53 4-persons, 55 5-persons.
2,336 married couples with children.
301 single-parent households (98 men, 203 women).
83.8% of residents of Nantucket speak English at home.
8.1% of residents speak Spanish at home (91% speak English very well, 9% speak English not well).
5.3% of residents speak other Indo-European language at home (72% speak English very well, 28% speak English well).
1.9% of residents speak Asian or Pacific Island language at home (75% speak English very well, 11% speak English well, 14% speak English not well).
0.1% of residents speak other language at home (100% speak English very well).
In fiscal year 2004:
Federal Government expenditure: $43,603,000 ($4,307 per capita)
Department of Defense expenditure: $649,000
Federal direct payments to individuals for retirement and disability: $18,573,000
Federal other direct payments to individuals: $9,792,000
Federal direct payments not to individuals: $18,000
Federal grants: $9,086,000
Federal procurement contracts: $1,175,000 ($14,000 Department of Defense)
Federal salaries and wages: $4,959,000 ($0,000 Department of Defense)
Federal Government direct loans: $0,000
Federal guaranteed/insured loans: $1,104,000
Federal Government insurance: $195,344,000
Population change from April 1, 2000 to July 1, 2005:
Births: 765| Here: | 75 per 1000 residents |
| State: | 67 per 1000 residents |
Deaths: 331
| Here: | 33 per 1000 residents |
| State: | 46 per 1000 residents |
Net international migration: +287
| Here: | +28 per 1000 residents |
| State: | +25 per 1000 residents |
Net internal migration: -60
| Here: | |
| State: |
Total withdrawal of fresh water for public supply: 1.28 millions of gallons per day (all from ground)
| Here: | 6.7 |
| State: | 6.5 |
| Here: | 4.0 |
| State: | 4.0 |
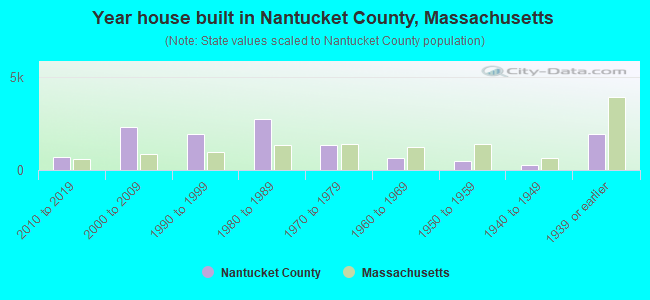
- Year house built in Nantucket County, Massachusetts
- 42020 or later
- 7692010 to 2019
- 1,8372000 to 2009
- 2,0521990 to 1999
- 2,4761980 to 1989
- 1,4371970 to 1979
- 7431960 to 1969
- 4931950 to 1959
- 3221940 to 1949
- 2,2381939 or earlier
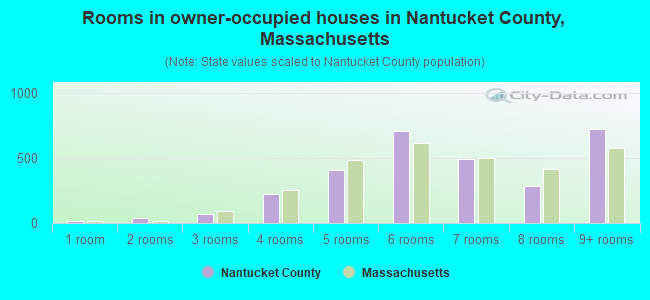
- Rooms in owner-occupied houses in Nantucket County, Massachusetts
- 01 room
- 372 rooms
- 963 rooms
- 2724 rooms
- 3695 rooms
- 7766 rooms
- 6247 rooms
- 2528 rooms
- 9499+ rooms
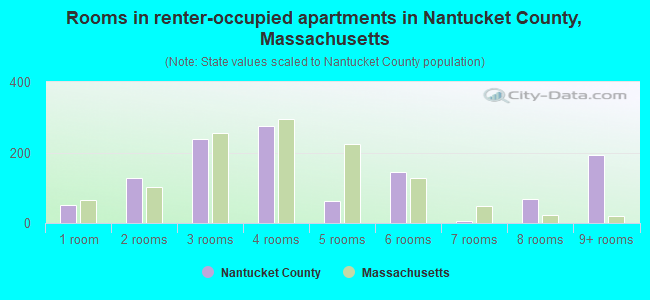
- Rooms in renter-occupied apartments in Nantucket County, Massachusetts
- 1031 room
- 1762 rooms
- 3063 rooms
- 2204 rooms
- 875 rooms
- 2276 rooms
- 227 rooms
- 158 rooms
- 2509+ rooms
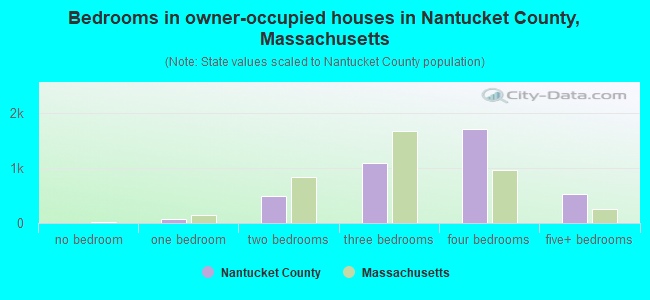
- Bedrooms in owner-occupied houses in Nantucket County, Massachusetts
- 0no bedroom
- 811 bedroom
- 5422 bedrooms
- 1,1333 bedrooms
- 1,1224 bedrooms
- 4895+ bedrooms
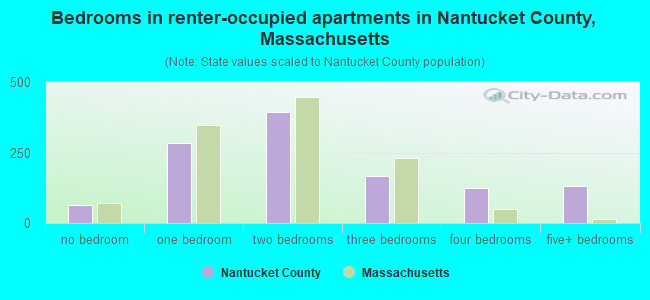
- Bedrooms in renter-occupied apartments in Nantucket County, Massachusetts
- 151no bedroom
- 3851 bedroom
- 3192 bedrooms
- 2343 bedrooms
- 1654 bedrooms
- 1265+ bedrooms
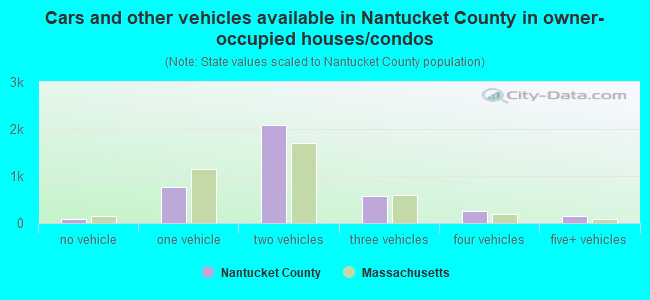
- Cars and other vehicles available in Nantucket County in owner-occupied houses/condos
- 46no vehicle
- 9191 vehicle
- 1,5692 vehicles
- 5983 vehicles
- 1264 vehicles
- 1105+ vehicles
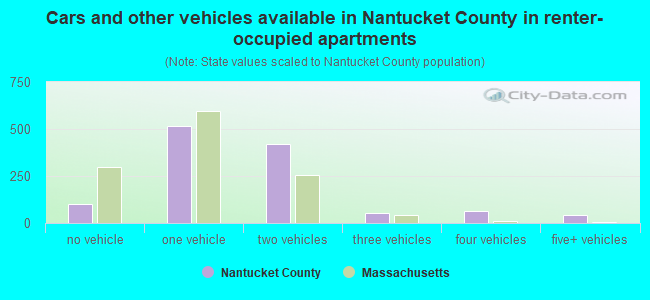
- Cars and other vehicles available in Nantucket County in renter-occupied apartments
- 144no vehicle
- 3931 vehicle
- 5472 vehicles
- 1023 vehicles
- 1224 vehicles
- 655+ vehicles
90.2% of Nantucket County residents lived in the same house 1 years ago.
Out of people who lived in different houses, 22% lived in this county.
Out of people who lived in different counties, 48% lived in Massachusetts.
| Nantucket County: | 90.2% |
| State average: | 87.7% |
Place of birth for U.S.-born residents:
- This state: 7,120
- Other state: 4,836
- Northeast: 2,869
- Midwest: 500
- South: 952
- West: 515
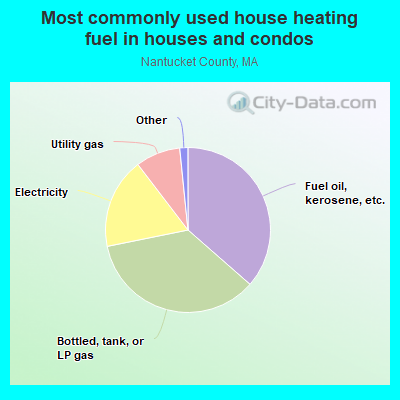
- 39.4%Fuel oil, kerosene, etc.
- 35.5%Bottled, tank, or LP gas
- 15.0%Electricity
- 9.1%Utility gas
- 0.5%Other fuel
- 0.3%Wood
- 0.2%No fuel used
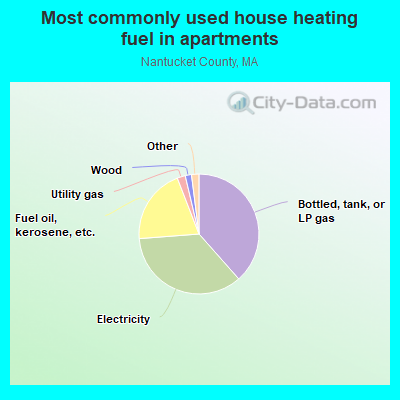
- 41.9%Electricity
- 29.1%Bottled, tank, or LP gas
- 19.1%Fuel oil, kerosene, etc.
- 7.0%Utility gas
- 1.7%No fuel used
- 0.7%Other fuel
- 0.4%Wood
Private vs. public school enrollment:
| Here: | 21.2% |
| Massachusetts: | 10.3% |
| Here: | 2.1% |
| Massachusetts: | 12.3% |
| Here: | 30.4% |
| Massachusetts: | 51.2% |
Supplemental Security Income (SSI) in 2006:
- Total number of recipients: 34
- Number of aged recipients: 5
- Number of blind and disabled recipients: 29
- Number of recipients under 18: 5
- Number of recipients between 18 and 64: 23
- Number of recipients older than 64: 6
- Number of recipients also receiving OASDI: 17
- Amount of payments (thousands of dollars): 14
| Most common first names in Nantucket County, MA among deceased individuals | ||
| Name | Count | Lived (average) |
|---|---|---|
| Mary | 82 | 80.3 years |
| John | 64 | 75.3 years |
| Robert | 48 | 73.3 years |
| William | 43 | 74.5 years |
| Margaret | 37 | 79.4 years |
| Elizabeth | 32 | 82.5 years |
| Charles | 32 | 72.3 years |
| James | 32 | 76.7 years |
| Helen | 31 | 83.7 years |
| Joseph | 26 | 83.4 years |
| Most common last names in Nantucket County, MA among deceased individuals | ||
| Last name | Count | Lived (average) |
|---|---|---|
| Sylvia | 23 | 82.6 years |
| Coffin | 19 | 80.7 years |
| Williams | 17 | 82.8 years |
| Perry | 12 | 78.6 years |
| Gardner | 12 | 83.4 years |
| Chase | 12 | 82.1 years |
| Allen | 11 | 80.4 years |
| Smith | 11 | 81.5 years |
| Davis | 11 | 73.6 years |
| King | 10 | 81.8 years |
| Businesses in Nantucket County, MA | ||||
| Name | Count | Name | Count | |
|---|---|---|---|---|
| Decora Cabinetry | 2 | New Balance | 1 | |
| FedEx | 4 | RadioShack | 1 | |
| Ford | 1 | Stop & Shop | 2 | |
| H&R Block | 1 | UPS | 3 | |
| MasterBrand Cabinets | 4 | |||
Nantucket County on our top lists:
- #58 on the list of "Top 101 counties with the largest number of children under 18 without health insurance coverage in 2000"
- #68 on the list of "Top 101 counties with the highest percentage of residents relocating from foreign countries between 2010 and 2011"
- #68 on the list of "Top 101 counties with the largest number of people without health insurance coverage in 2000"
- #75 on the list of "Top 101 counties with the highest percentage of residents relocating to foreign countries in 2011"