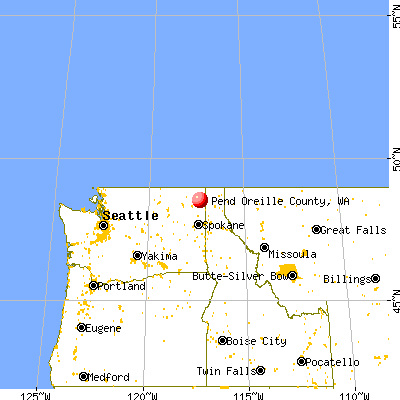
Pend Oreille County, Washington (WA)
County owner-occupied free and clear houses and condos in 2010: 1,850
County owner-occupied houses and condos in 2000: 3,589
Renter-occupied apartments: 1,254 (it was 1,050 in 2000)
| % of renters here: | 23% |
| State: | 36% |
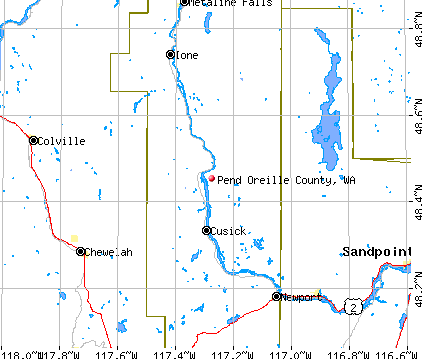
Land area: 1400 sq. mi.
Water area: 25.0 sq. mi.
Population density: 10 people per square mile (low).
Industries providing employment: Educational, health and social services (18.4%), Retail trade (13.4%), Construction (10.4%).
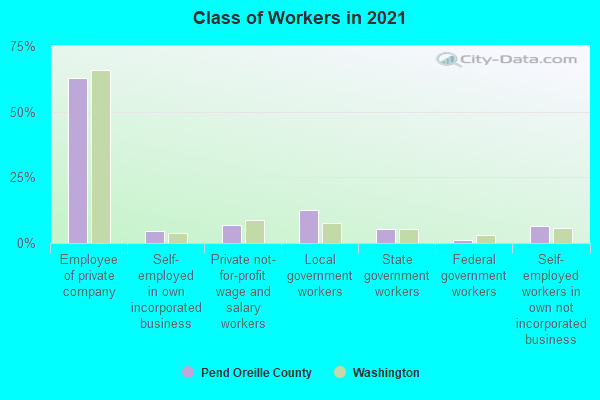
Type of workers:
- Private wage or salary: 74%
- Government: 18%
- Self-employed, not incorporated: 7%
- Unpaid family work: 1%
- OSM Map
- General Map
- Google Map
- MSN Map

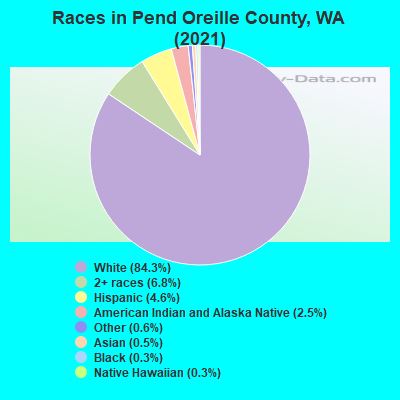
- 11,30083.4%White Non-Hispanic Alone
- 9286.8%Two or more races
- 6664.9%Hispanic or Latino
- 3282.4%American Indian and Alaska Native alone
- 1901.4%Some other race alone
- 1010.7%Asian alone
- 300.2%Black Non-Hispanic Alone
- 120.09%Native Hawaiian and Other
Pacific Islander alone
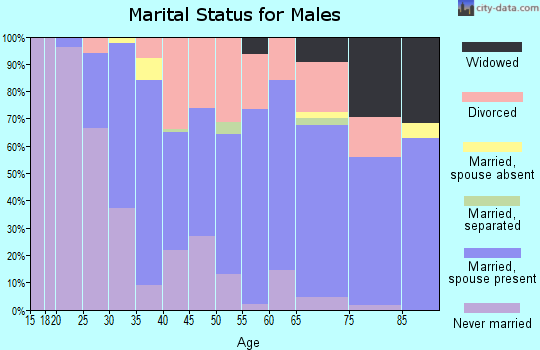
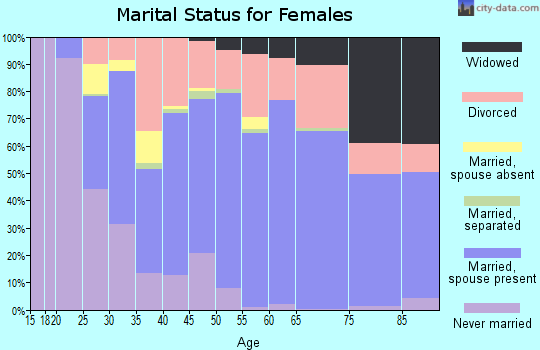
| Median resident age: | 50.9 years |
| Washington median age: | 38.4 years |
| Males: 7,152 | |
| Females: 6,589 |

 | Are you ready for Electricity and Natural Gas to increase too? (31 replies) |
| suggest a small town (31 replies) |
| Any unique facts about Colville, WA??? (138 replies) |
| where can i afford to live in WA (14 replies) |
| Some tribal casinos reopen amid coronavirus pandemic, despite Washington state’s stay-home order (17 replies) |
| The Palouse Region (6 replies) |
| Pend Oreille County: | 2.0 people |
| Washington: | 3 people |
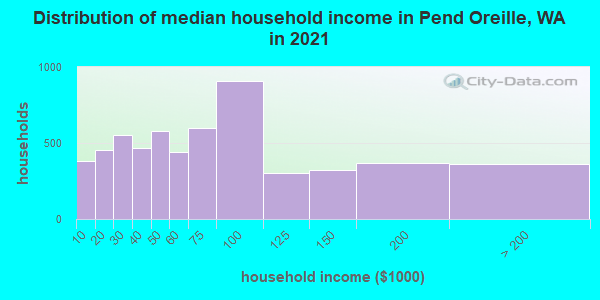
Estimated median household income in 2022: $59,997 ($31,677 in 1999)
| This county: | $59,997 |
| Washington: | $91,306 |
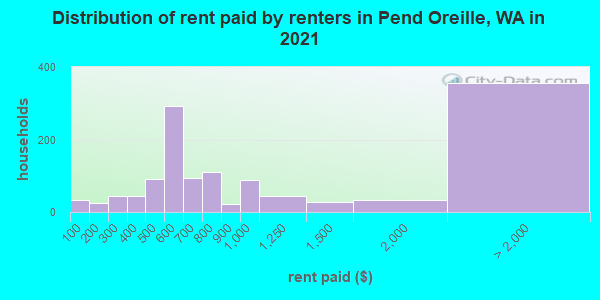
Median contract rent in 2022 for apartments: $636 (lower quartile is $470, upper quartile is $918)
| This county: | $636 |
| State: | $1495 |
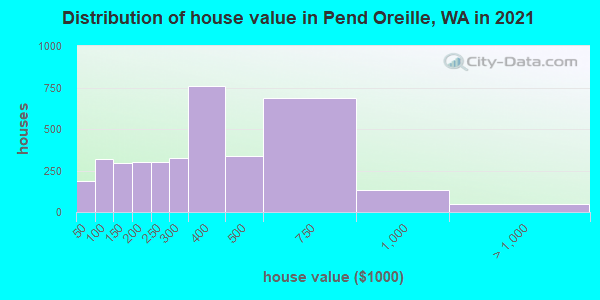
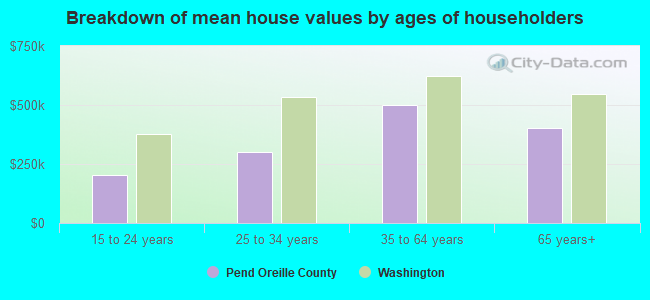
Estimated median house or condo value in 2022: $346,704 (it was $104,100 in 2000)
| Pend Oreille: | $346,704 |
| Washington: | $569,500 |
Median monthly housing costs for homes and condos with a mortgage: $1,495
Median monthly housing costs for units without a mortgage: $451
Institutionalized population: 94
Crime in 2021 (reported by the sheriff's office or county police, not the county total):
- Murders: 0
- Rapes: 4
- Robberies: 0
- Assaults: 5
- Burglaries: 42
- Thefts: 109
- Auto thefts: 30
Crime in 2020 (reported by the sheriff's office or county police, not the county total):
- Murders: 2
- Rapes: 6
- Robberies: 0
- Assaults: 13
- Burglaries: 38
- Thefts: 76
- Auto thefts: 22
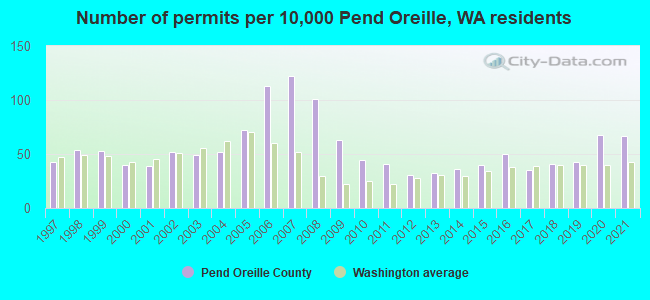
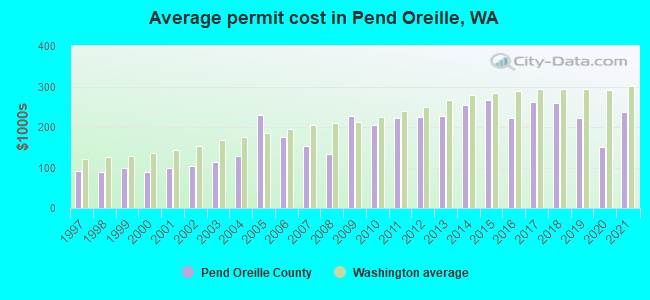
Single-family new house construction building permits:
- 2022: 75 buildings, average cost: $246,400
- 2021: 79 buildings, average cost: $238,100
- 2020: 80 buildings, average cost: $151,100
- 2019: 50 buildings, average cost: $222,900
- 2018: 48 buildings, average cost: $259,800
- 2017: 41 buildings, average cost: $261,400
- 2016: 59 buildings, average cost: $222,300
- 2015: 47 buildings, average cost: $265,700
- 2014: 42 buildings, average cost: $254,000
- 2013: 37 buildings, average cost: $228,200
- 2012: 36 buildings, average cost: $224,300
- 2011: 48 buildings, average cost: $220,900
- 2010: 52 buildings, average cost: $205,100
- 2009: 74 buildings, average cost: $226,200
- 2008: 118 buildings, average cost: $132,600
- 2007: 143 buildings, average cost: $153,600
- 2006: 133 buildings, average cost: $174,700
- 2005: 84 buildings, average cost: $228,900
- 2004: 61 buildings, average cost: $128,100
- 2003: 58 buildings, average cost: $112,700
- 2002: 61 buildings, average cost: $103,300
- 2001: 46 buildings, average cost: $97,700
- 2000: 47 buildings, average cost: $89,000
- 1999: 62 buildings, average cost: $97,500
- 1998: 63 buildings, average cost: $90,100
- 1997: 50 buildings, average cost: $91,400
Median real estate property taxes paid for housing units with mortgages in 2022: $1,899 (0.5%)
Median real estate property taxes paid for housing units with no mortgage in 2022: $2,058 (0.7%)
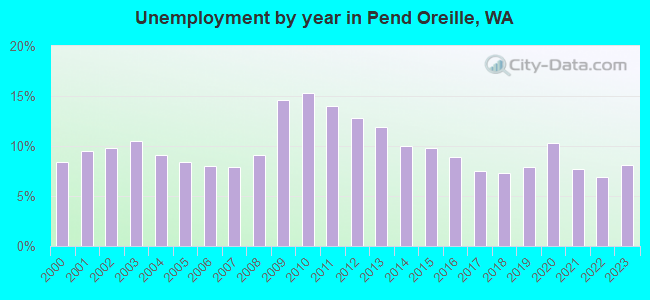
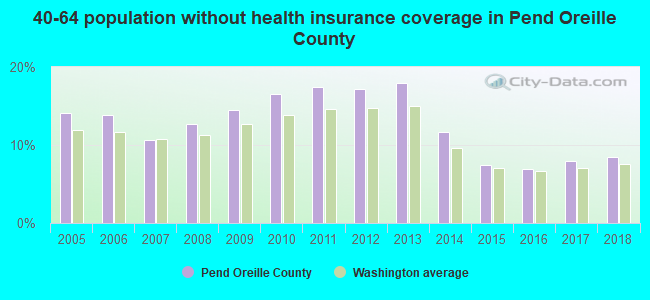
| Pend Oreille County: | 13.0% |
| Washington: | 10.0% |
Median age of residents in 2022: 50.9 years old
(Males: 50.4 years old, Females: 51.5 years old)
(Median age for: White residents: 53.3 years old, Black residents: 21.2 years old, American Indian residents: 39.8 years old, Asian residents: 63.8 years old, Hispanic or Latino residents: 24.8 years old, Other race residents: 33.8 years old)
Fair market rent in 2006 for a 1-bedroom apartment in Pend Oreille County is $433 a month.
Fair market rent for a 2-bedroom apartment is $559 a month.
Fair market rent for a 3-bedroom apartment is $750 a month.
Cities in this county include: Newport, Ione, Metaline Falls, Cusick, Metaline.
Neighboring counties: Boundary County, Idaho  , Dunn County, North Dakota
  , Kootenai County, Idaho
  , Powell County, Montana
  , Roseau County, Minnesota .
| Here: | 6.8% |
| Washington: | 4.6% |
Current college students: 365
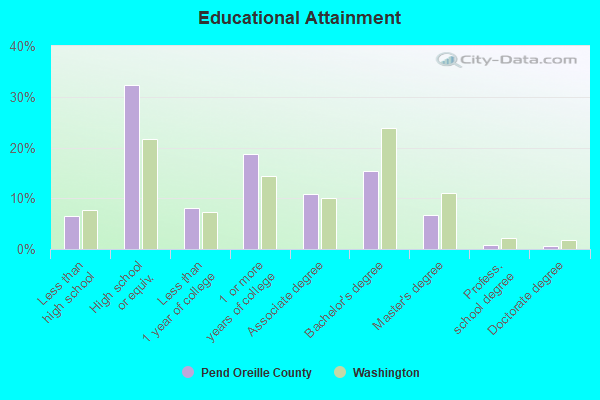
People 25 years of age or older with a high school degree or higher: 93.4%
People 25 years of age or older with a bachelor's degree or higher: 21.5%
Number of foreign born residents: 235 (66.0% naturalized citizens)
| Pend Oreille County: | 1.7% |
| Whole state: | 15.3% |
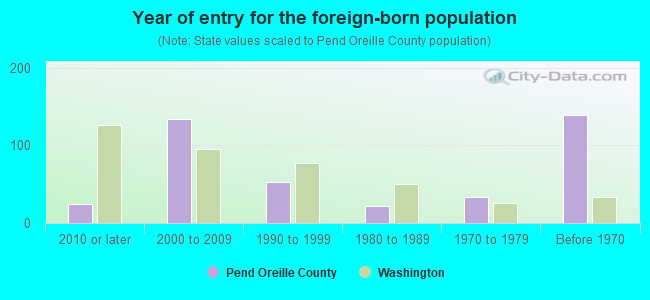
- Year of entry for the foreign-born population
- 52010 or later
- 202000 to 2009
- 271990 to 1999
- 221980 to 1989
- 331970 to 1979
- 139Before 1970
Mean travel time to work (commute): minutes
Percentage of county residents living and working in this county: 81.3%
Housing units in structures:
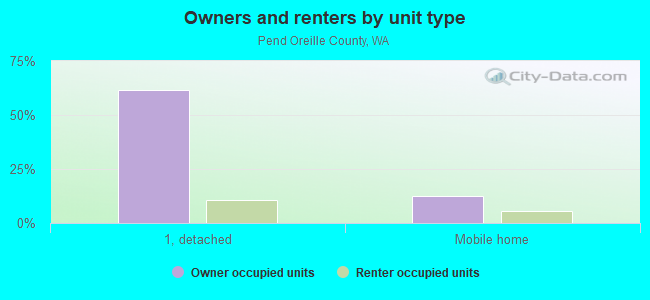
- One, detached: 6,148
- One, attached: 65
- Two: 37
- 3 or 4: 82
- 5 to 9: 105
- 10 to 19: 83
- 20 to 49: 41
- 50 or more: 104
- Mobile homes: 1,361
- Boats, RVs, vans, etc.: 79
Housing units in Pend Oreille County with a mortgage: 2,280 (133 second mortgage, 0 home equity loan, 83 both second mortgage and home equity loan)
Houses without a mortgage: 56
| Here: | 3.4% with mortgage |
| State: | 98.0% with mortgage |
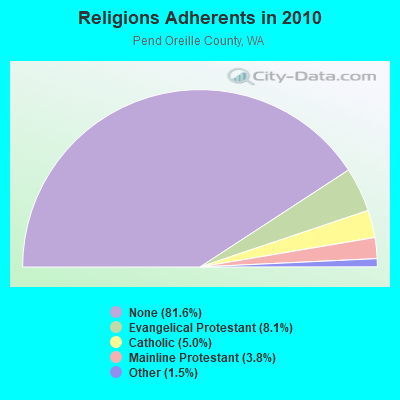
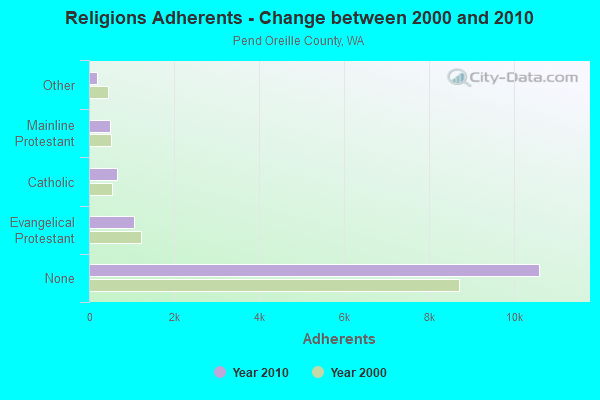
Religion statistics for Pend Oreille County
| Religion | Adherents | Congregations |
|---|---|---|
| Evangelical Protestant | 1,057 | 12 |
| Catholic | 653 | 5 |
| Mainline Protestant | 492 | 4 |
| Other | 193 | 3 |
| None | 10,606 | - |
Source: Clifford Grammich, Kirk Hadaway, Richard Houseal, Dale E.Jones, Alexei Krindatch, Richie Stanley and Richard H.Taylor. 2012. 2010 U.S.Religion Census: Religious Congregations & Membership Study. Association of Statisticians of American Religious Bodies. Jones, Dale E., et al. 2002. Congregations and Membership in the United States 2000. Nashville, TN: Glenmary Research Center.
Food Environment Statistics:
| Pend Oreille County: | 3.93 / 10,000 pop. |
| State: | 2.06 / 10,000 pop. |
| This county: | 1.57 / 10,000 pop. |
| Washington: | 1.18 / 10,000 pop. |
| Pend Oreille County: | 5.50 / 10,000 pop. |
| Washington: | 2.67 / 10,000 pop. |
| This county: | 9.43 / 10,000 pop. |
| State: | 8.26 / 10,000 pop. |
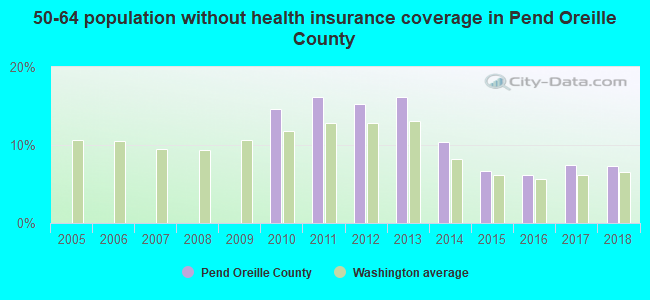
| Pend Oreille County: | 10.0% |
| Washington: | 7.7% |
| Pend Oreille County: | 28.0% |
| State: | 25.7% |
| Here: | 13.0% |
| State: | 13.9% |
Agriculture in Pend Oreille County:
Average size of farms: 233 acresAverage value of agricultural products sold per farm: $12,798
Average value of crops sold per acre for harvested cropland: $102.64
The value of nursery, greenhouse, floriculture, and sod as a percentage of the total market value of agricultural products sold: 2.22%
The value of livestock, poultry, and their products as a percentage of the total market value of agricultural products sold: 53.15%
Average total farm production expenses per farm: $16,483
Harvested cropland as a percentage of land in farms: 25.09%
Irrigated harvested cropland as a percentage of land in farms: 7.21%
Average market value of all machinery and equipment per farm: $33,262
The percentage of farms operated by a family or individual: 92.40%
Average age of principal farm operators: 57 years
Average number of cattle and calves per 100 acres of all land in farms: 8.17
Milk cows as a percentage of all cattle and calves: 0.36%
Earthquake activity:
Pend Oreille County-area historical earthquake activity is significantly above Washington state average. It is 834% greater than the overall U.S. average.On 4/13/1949 at 19:55:42, a magnitude 7.0 (7.0 UK, Class: Major, Intensity: VIII - XII) earthquake occurred 256.2 miles away from Pend Oreille County center, causing $80,000,000 total damage
On 8/18/1959 at 06:37:13, a magnitude 7.7 (7.7 UK) earthquake occurred 414.0 miles away from the county center, causing $26,000,000 total damage
On 10/28/1983 at 14:06:06, a magnitude 7.3 (6.2 MB, 7.3 MS, 7.0 MW) earthquake occurred 345.2 miles away from the county center, causing 2 deaths (2 shaking deaths) and 3 injuries, causing $15,000,000 total damage
On 2/28/2001 at 18:54:32, a magnitude 6.8 (6.5 MB, 6.6 MS, 6.8 MW, Class: Strong, Intensity: VII - IX) earthquake occurred 263.8 miles away from the county center, causing $2,000,000,000 total damage and $305,000,000 insured losses
On 2/28/2001 at 18:54:32, a magnitude 6.8 (6.8 MD, Depth: 32.2 mi) earthquake occurred 268.7 miles away from Pend Oreille County center
On 4/29/1965 at 15:28:43, a magnitude 6.6 (6.6 UK) earthquake occurred 247.2 miles away from the county center, causing $28,000,000 total damage
Magnitude types: body-wave magnitude (MB), duration magnitude (MD), surface-wave magnitude (MS), moment magnitude (MW)
Most recent natural disasters:
- Washington Covid-19 Pandemic, Incident Period: January 20, 2020, Major Disaster (Presidential) Declared DR-4481-WA: March 22, 2020, FEMA Id: 4481, Natural disaster type: Other
- Washington Severe Winter Storms, Flooding, Landslides, And Mudslides, Incident Period: January 30, 2017 - February 22, 2017, FEMA Id: 4309, Natural disaster type: Winter Storm, Mudslide, Landslide, Flood
- Washington Severe Storms, Straight-line Winds, Flooding, Landslides, and Mudslides, Incident Period: November 12, 2015 to November 21, 2015, Major Disaster (Presidential) Declared DR-4249: January 15, 2016, FEMA Id: 4249, Natural disaster type: Storm, Mudslide, Landslide, Flood, Wind
- Washington Wildfires, Incident Period: August 13, 2015 to September 10, 2015, Emergency Declared EM-3372: August 21, 2015, FEMA Id: 3372, Natural disaster type: Fire
- Washington Wildfires and Mudslides, Incident Period: August 09, 2015 to September 10, 2015, Major Disaster (Presidential) Declared DR-4243: October 20, 2015, FEMA Id: 4243, Natural disaster type: Fire, Mudslide
- Washington Severe Winter Storm and Record and Near Record Snow, Incident Period: December 12, 2008 to January 05, 2009, Major Disaster (Presidential) Declared DR-1825: March 02, 2009, FEMA Id: 1825, Natural disaster type: Winter Storm, Snow
- Washington Severe Winter Storm, Landslides, and Mudslides, Incident Period: December 14, 2006 to December 15, 2006, Major Disaster (Presidential) Declared DR-1682: February 14, 2007, FEMA Id: 1682, Natural disaster type: Winter Storm, Mudslide, Landslide
- Washington Severe Storms, Flooding, Tidal Surge, Landslides, and Mudslides, Incident Period: January 27, 2006 to February 04, 2006, Major Disaster (Presidential) Declared DR-1641: May 17, 2006, FEMA Id: 1641, Natural disaster type: Storm, Mudslide, Landslide, Flood
- Washington Hurricane Katrina Evacuation, Incident Period: August 29, 2005 to October 01, 2005, Emergency Declared EM-3227: September 07, 2005, FEMA Id: 3227, Natural disaster type: Hurricane
- Washington Snowmelt/Flooding, Incident Period: April 10, 1997 to June 30, 1997, Major Disaster (Presidential) Declared DR-1182: July 21, 1997, FEMA Id: 1182, Natural disaster type: Flood, Snow
- 7 other natural disasters have been reported since 1953.
The number of natural disasters in Pend Oreille County (17) is near the US average (15).
Major Disasters (Presidential) Declared: 13
Emergencies Declared: 3
Causes of natural disasters: Floods: 7, Mudslides: 6, Landslides: 5, Storms: 5, Snows: 4, Winter Storms: 4, Fires: 3, Drought: 1, Hurricane: 1, Volcanic Eruption: 1, Wind: 1, Other: 1 (Note: some incidents may be assigned to more than one category).
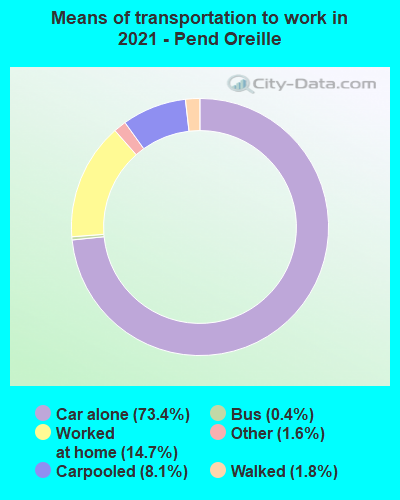
Means of transportation to work:
- Drove a car alone: 2,635 (72.4%)
- Carpooled: 224 (6.2%)
- Bus: 10 (0.3%)
- Taxicab, motorcycle, or other means: 41 (1.1%)
- Walked: 72 (2.0%)
- Worked at home: 668 (18.4%)
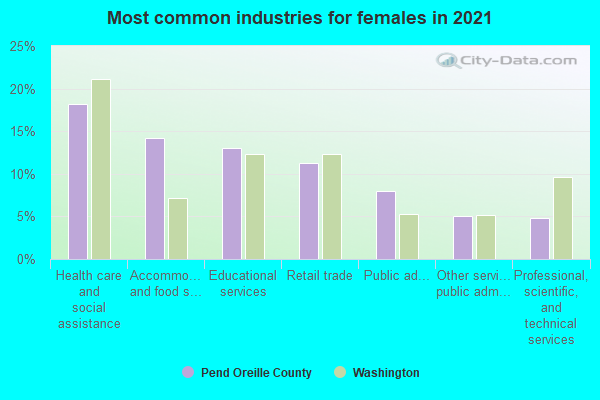
- Health care and social assistance (15%)
- Retail trade (12%)
- Educational services (11%)
- Accommodation and food services (7%)
- Public administration (6%)
- Other services, except public administration (4%)
- Finance and insurance (3%)
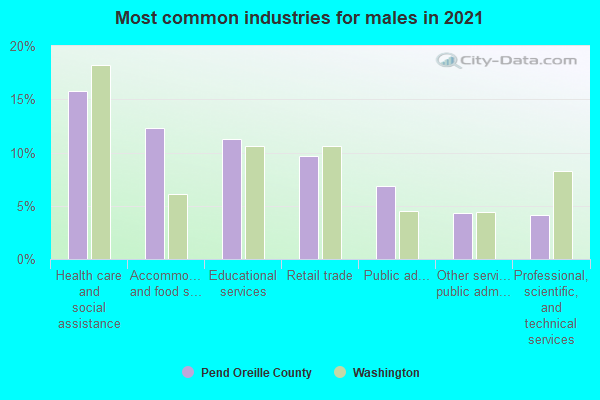
- Health care and social assistance (19%)
- Retail trade (15%)
- Educational services (14%)
- Accommodation and food services (9%)
- Public administration (8%)
- Other services, except public administration (5%)
- Finance and insurance (4%)
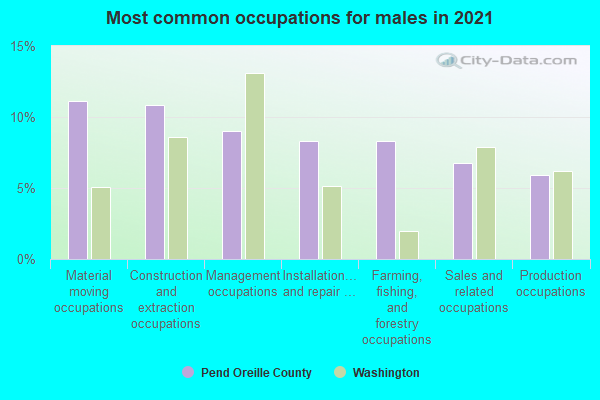
- Construction and extraction occupations (14%)
- Management occupations (9%)
- Sales and related occupations (8%)
- Installation, maintenance, and repair occupations (7%)
- Production occupations (7%)
- Material moving occupations (7%)
- Farming, fishing, and forestry occupations (7%)

- Office and administrative support occupations (19%)
- Sales and related occupations (11%)
- Management occupations (10%)
- Educational instruction, and library occupations (10%)
- Food preparation and serving related occupations (8%)
- Business and financial operations occupations (6%)
- Personal care and service occupations (6%)
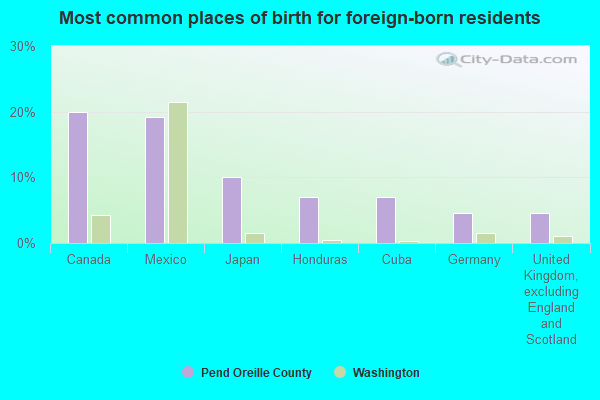
- Japan (22%)
- United Kingdom, excluding England and Scotland (11%)
- Philippines (10%)
- Zimbabwe (9%)
- Canada (8%)
- Germany (7%)
- Honduras (6%)
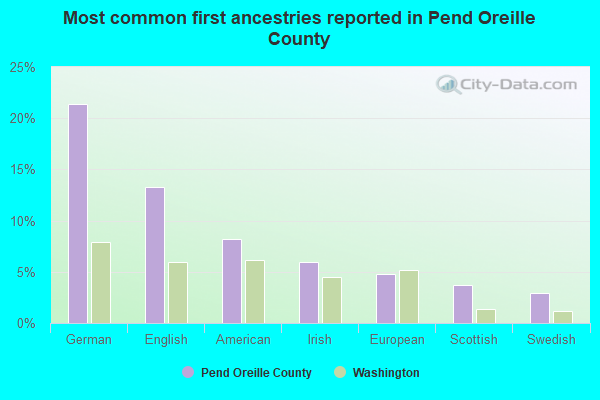
- German (21%)
- English (14%)
- American (9%)
- Irish (7%)
- European (3%)
- Norwegian (3%)
- Scottish (2%)
People in group quarters in Pend Oreille County, Washington in 2010:
- 69 people in nursing facilities/skilled-nursing facilities
- 25 people in local jails and other municipal confinement facilities
- 4 people in group homes intended for adults
People in group quarters in Pend Oreille County, Washington in 2000:
- 38 people in nursing homes
- 32 people in local jails and other confinement facilities (including police lockups)
- 16 people in other noninstitutional group quarters
- 8 people in homes for the mentally retarded
- 6 people in other workers' dormitories
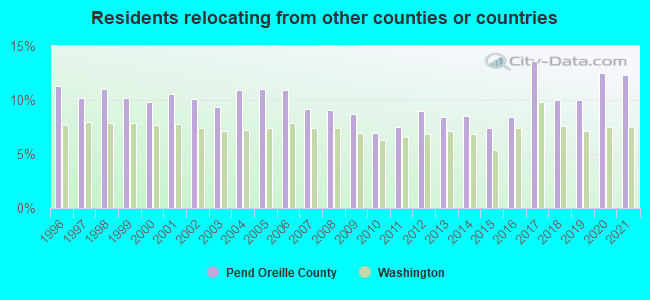
12.35% of this county's 2021 resident taxpayers lived in other counties in 2020 ($69,261 average adjusted gross income)
| Here: | 12.35% |
| Washington average: | 7.53% |
10 or fewer of this county's residents moved from foreign countries.
7.71% relocated from other counties in Washington ($41,837 average AGI)
4.64% relocated from other states ($27,424 average AGI)
Pend Oreille County: 4.64% Washington average: 3.85%
Top counties from which taxpayers relocated into this county between 2020 and 2021:
| from Spokane County, WA | |
| from Bonner County, ID | |
| from King County, WA | |
| from Kootenai County, ID | |
| from Stevens County, WA |
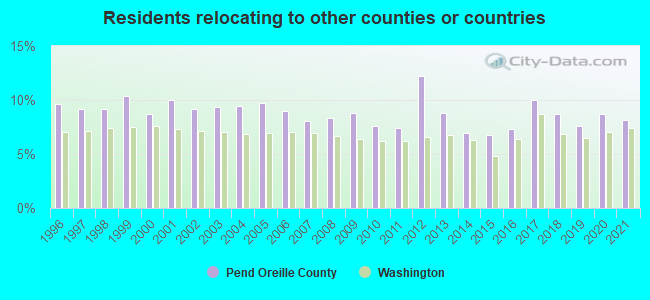
8.12% of this county's 2020 resident taxpayers moved to other counties in 2021 ($52,653 average adjusted gross income)
| Here: | 8.12% |
| Washington average: | 7.40% |
10 or fewer of this county's residents moved to foreign countries.
4.86% relocated to other counties in Washington ($27,990 average AGI)
3.26% relocated to other states ($24,666 average AGI)
Pend Oreille County: 3.26% Washington average: 3.73%
Top counties to which taxpayers relocated from this county between 2020 and 2021:
| to Spokane County, WA | |
| to Bonner County, ID | |
| to Stevens County, WA |
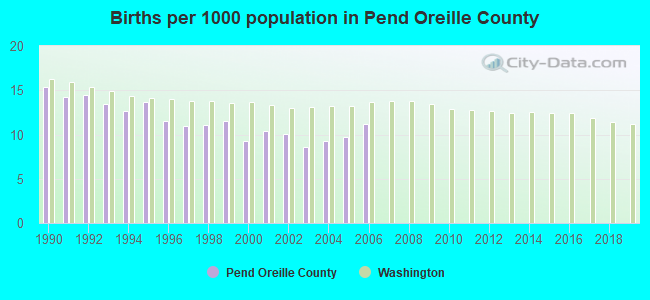
Births per 1000 population from 1990 to 1999: 12.9
Births per 1000 population from 2000 to 2006: 9.8
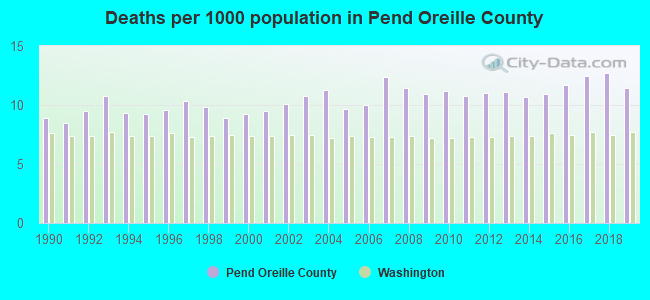
Deaths per 1000 population from 1990 to 1999: 9.5
Deaths per 1000 population from 2000 to 2009: 10.5
Deaths per 1000 population from 2010 to 2020: 11.5
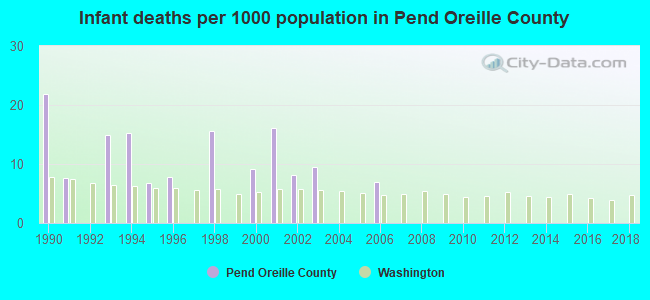
Infant deaths per 1000 live births from 1990 to 1999: 9.0
Infant deaths per 1000 live births from 2000 to 2006: 7.1
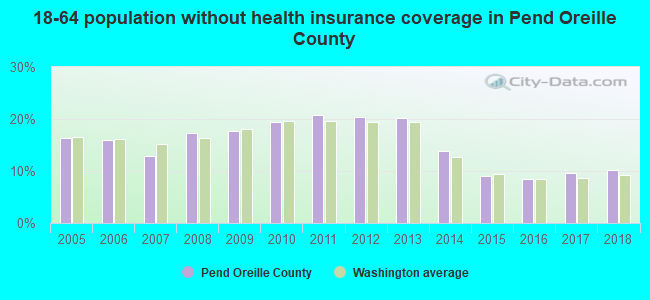
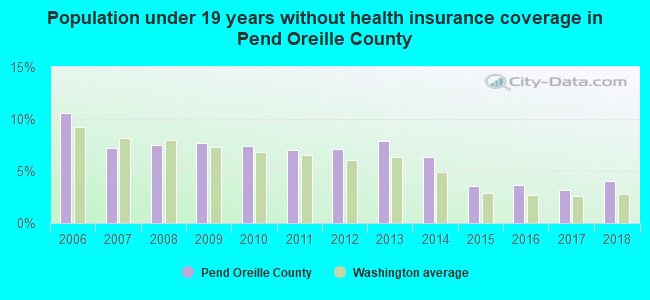
Persons under 19 years old without health insurance coverage in 2018: 4.0%
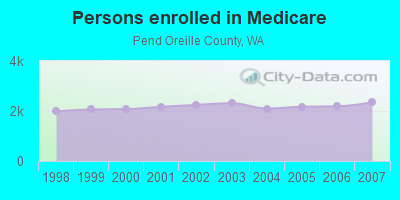
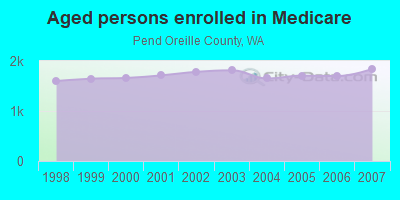
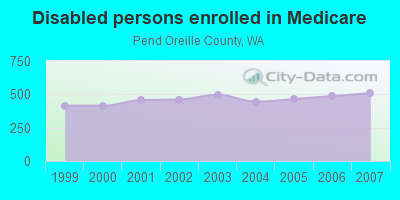
Persons enrolled in hospital insurance and/or supplemental medical insurance (Medicare) in July 1, 2007: 2,348 (1,839 aged, 509 disabled)
Children under 18 without health insurance coverage in 2007: 324 (12%)
Most common underlying causes of death in Pend Oreille County, Washington in 1999 - 2019:
- Bronchus or lung, unspecified - Malignant neoplasms (140)
- Atherosclerotic heart disease (129)
- Chronic obstructive pulmonary disease, unspecified (108)
- Alzheimer disease, unspecified (11)
- Acute myocardial infarction, unspecified (10)
- Unspecified dementia (10)
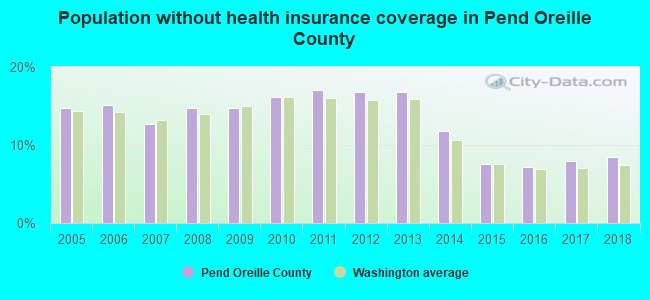
Population without health insurance coverage in 2000: 18%
Children under 18 without health insurance coverage in 2000: 15%
Short term general hospital admissions per 100,000 population in 2004: 12,410
Short term general hospital beds per 100,000 population in 2004: 1,315
Emergency room visits per 100,000 population in 2004: 178,106
General practice office based MDs per 100,000 population in 2005: 986
Medical specialist MDs per 100,000 population in 2005: 1,192
Total births per 100,000 population, July 2005 - July 2006 : 26
Total deaths per 100,000 population, July 2005 - July 2006: 55
Limited-service eating places per 100,000 population in 2005 : 8
EPA green book nonattainment status in 2004-2006: 1
Household type by relationship:
Households: 13,741- Male householders: 2,888 (678 living alone), Female householders: 3,047 (768 living alone)
2,828 spouses (2,810 opposite-sex spouses), 569 unmarried partners, (563 opposite-sex unmarried partners), 2,965 children (2,772 natural, 96 adopted, 94 stepchildren), 287 grandchildren, 97 brothers or sisters, 189 parents, 0 foster children, 165 other relatives, 593 non-relatives
- In group quarters: 129
Size of family households: 2,106 2-persons, 1,093 3-persons, 394 4-persons, 278 5-persons, 82 6-persons, 65 7-or-more-persons.
Size of nonfamily households: 1,447 1-person, 371 2-persons, 44 3-persons, 43 5-persons.
1,535 married couples with children.
593 single-parent households (192 men, 401 women).
98.1% of residents of Pend Oreille speak English at home.
0.8% of residents speak Spanish at home (87% speak English very well, 13% speak English well).
0.3% of residents speak other Indo-European language at home (72% speak English very well, 18% speak English well, 10% don't speak English at all).
0.3% of residents speak Asian or Pacific Island language at home (100% speak English very well).
0.4% of residents speak other language at home (100% speak English very well).
In fiscal year 2004:
Federal Government expenditure: $71,591,000 ($5,739 per capita)
Department of Defense expenditure: $3,320,000
Federal direct payments to individuals for retirement and disability: $38,764,000
Federal other direct payments to individuals: $12,003,000
Federal direct payments not to individuals: $687,000
Federal grants: $14,113,000
Federal procurement contracts: $1,273,000 ($162,000 Department of Defense)
Federal salaries and wages: $4,752,000 ($0,000 Department of Defense)
Federal Government direct loans: $825,000
Federal guaranteed/insured loans: $3,362,000
Federal Government insurance: $16,000,000
Population change from April 1, 2000 to July 1, 2005:
Births: 596| Here: | 47 per 1000 residents |
| State: | 66 per 1000 residents |
Deaths: 656
| Here: | 52 per 1000 residents |
| State: | 38 per 1000 residents |
Net international migration: +9
| Here: | +1 per 1000 residents |
| State: | +21 per 1000 residents |
Net internal migration: +1,014
| Here: | +80 per 1000 residents |
| State: | +13 per 1000 residents |
Total withdrawal of fresh water for public supply: 0.72 millions of gallons per day (82% from ground, 18% from surface)
| Here: | 6.2 |
| State: | 6.5 |
| Here: | 4.3 |
| State: | 3.9 |
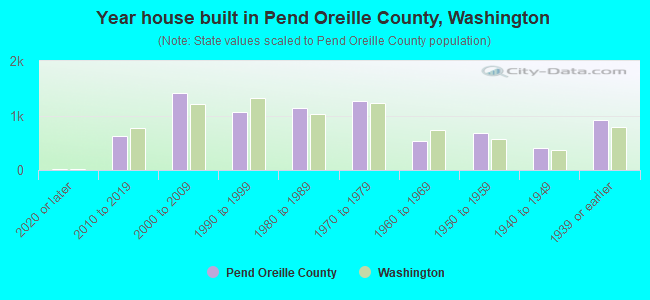
- Year house built in Pend Oreille County, Washington
- 942020 or later
- 6892010 to 2019
- 1,3062000 to 2009
- 1,1201990 to 1999
- 1,1671980 to 1989
- 1,2851970 to 1979
- 5031960 to 1969
- 6161950 to 1959
- 4621940 to 1949
- 8191939 or earlier
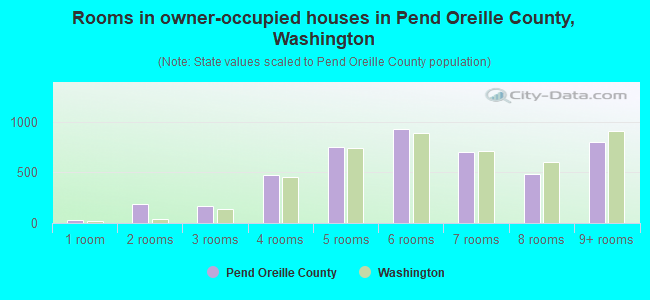
- Rooms in owner-occupied houses in Pend Oreille County, Washington
- 511 room
- 1862 rooms
- 1653 rooms
- 5724 rooms
- 7405 rooms
- 8406 rooms
- 7257 rooms
- 5398 rooms
- 7369+ rooms
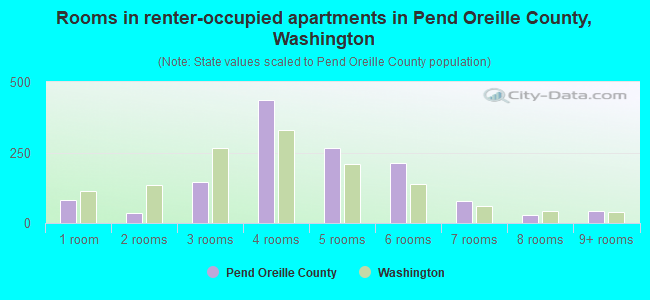
- Rooms in renter-occupied apartments in Pend Oreille County, Washington
- 761 room
- 592 rooms
- 2503 rooms
- 3894 rooms
- 2125 rooms
- 1836 rooms
- 1227 rooms
- 688 rooms
- 229+ rooms
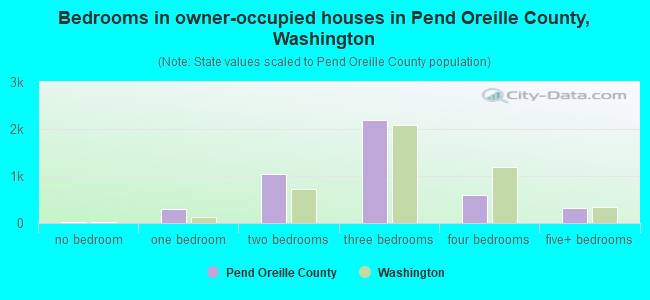
- Bedrooms in owner-occupied houses in Pend Oreille County, Washington
- 52no bedroom
- 3401 bedroom
- 1,1512 bedrooms
- 2,0913 bedrooms
- 5974 bedrooms
- 3155+ bedrooms
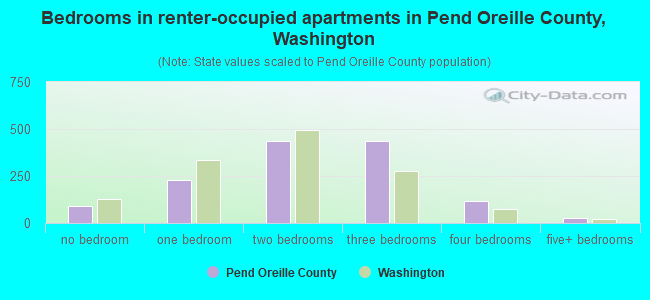
- Bedrooms in renter-occupied apartments in Pend Oreille County, Washington
- 82no bedroom
- 2661 bedroom
- 4492 bedrooms
- 4023 bedrooms
- 1594 bedrooms
- 265+ bedrooms
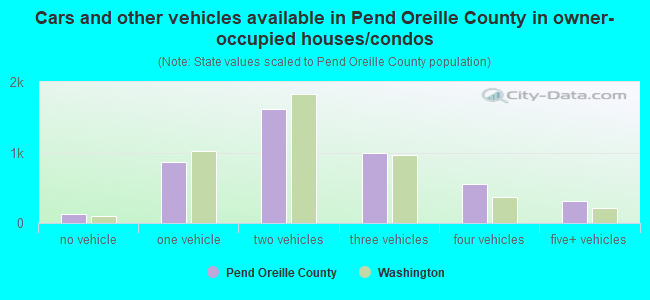
- Cars and other vehicles available in Pend Oreille County in owner-occupied houses/condos
- 69no vehicle
- 9781 vehicle
- 1,6082 vehicles
- 9453 vehicles
- 5484 vehicles
- 3755+ vehicles
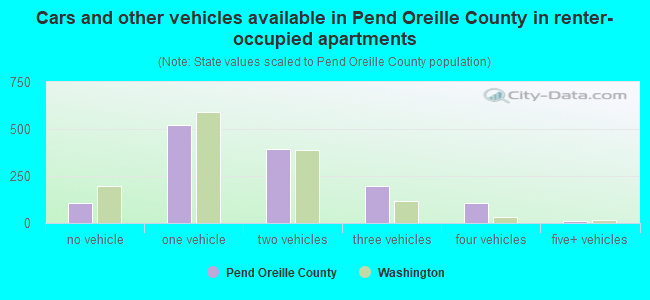
- Cars and other vehicles available in Pend Oreille County in renter-occupied apartments
- 115no vehicle
- 6031 vehicle
- 4012 vehicles
- 1973 vehicles
- 624 vehicles
- 185+ vehicles
91.6% of Pend Oreille County residents lived in the same house 1 years ago.
Out of people who lived in different houses, 21% lived in this county.
Out of people who lived in different counties, 49% lived in Washington.
| Pend Oreille County: | 91.6% |
| State average: | 85.2% |
Place of birth for U.S.-born residents:
- This state: 7,061
- Other state: 6,271
- Northeast: 380
- Midwest: 1,223
- South: 527
- West: 4,146
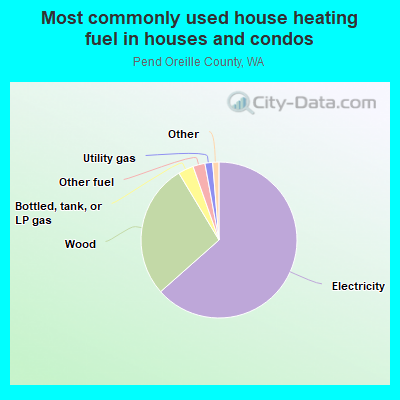
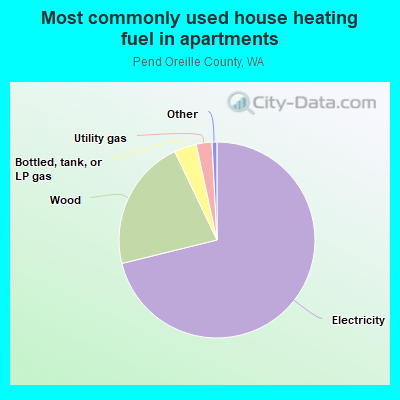
- 63.3%Electricity
- 28.4%Wood
- 3.0%Bottled, tank, or LP gas
- 2.6%Other fuel
- 1.5%Utility gas
- 0.7%No fuel used
- 0.4%Solar energy
- 0.3%Fuel oil, kerosene, etc.
- 70.4%Electricity
- 21.7%Wood
- 4.6%Bottled, tank, or LP gas
- 2.9%Utility gas
- 0.3%Other fuel
- 0.1%No fuel used
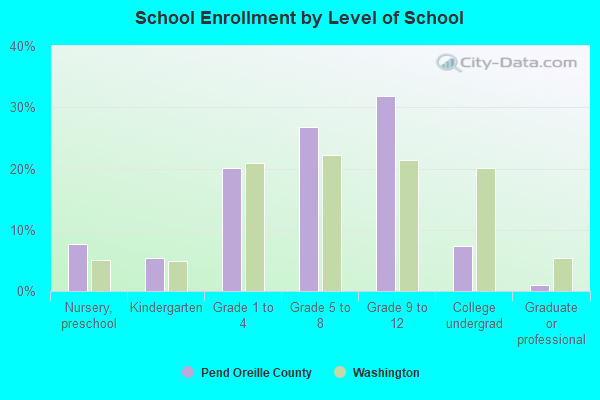
Private vs. public school enrollment:
| Here: | 22.8% |
| Washington: | 12.4% |
| Here: | 14.5% |
| Washington: | 9.2% |
| Here: | 8.3% |
| Washington: | 16.5% |
Pend Oreille County government finances - Expenditure in 2018:
- Charges - Other: $1,496,000
Solid Waste Management: $1,061,000
Regular Highways: $57,000
Parks and Recreation: $36,000
Natural Resources - Other: $2,000
- Construction - Regular Highways: $276,000
General - Other: $40,000
Central Staff Services: $5,000
- Current Operations - Regular Highways: $3,885,000
Police Protection: $2,277,000
Health - Other: $2,065,000
Financial Administration: $1,759,000
General - Other: $1,644,000
Judicial and Legal Services: $1,632,000
Solid Waste Management: $1,220,000
Correctional Institutions: $1,187,000
Central Staff Services: $1,103,000
Natural Resources - Other: $704,000
General Public Buildings: $495,000
Housing and Community Development: $146,000
Corrections - Other: $115,000
Public Welfare - Other: $90,000
Parks and Recreation: $50,000
Libraries: $3,000
- Federal Intergovernmental - General Local Government Support: $985,000
Other: $93,000
- General - Interest on Debt: $331,000
- Intergovernmental to Local - Other - Health - Other: $213,000
Other - Financial Administration: $50,000
Other - Solid Waste Management: $17,000
Other - Parks and Recreation: $4,000
Other - Correctional Institutions: $1,000
- Local Intergovernmental - Other: $1,723,000
- Long Term Debt - Beginning Outstanding - Unspecified Public Purpose: $8,288,000
Outstanding Unspecified Public Purpose: $6,855,000
Retired Unspecified Public Purpose: $2,230,000
Issue, Unspecified Public Purpose: $798,000
- Miscellaneous - Fines and Forfeits: $169,000
Rents: $167,000
Donations From Private Sources: $110,000
Sale of Property: $98,000
General Revenue - Other: $65,000
Interest Earnings: $0
- Other Capital Outlay - General - Other: $62,000
Regular Highways: $27,000
Health - Other: $17,000
Correctional Institutions: $9,000
Central Staff Services: $9,000
Financial Administration: $3,000
Solid Waste Management: $2,000
Natural Resources - Other: $1,000
- State Intergovernmental - Other: $3,006,000
Health and Hospitals: $2,097,000
Highways: $2,020,000
General Local Government Support: $62,000
- Tax - Property: $3,979,000
General Sales and Gross Receipts: $1,434,000
Severance: $300,000
Other License: $181,000
Motor Vehicle License: $170,000
Documentary and Stock Transfer: $165,000
Public Utilities Sales: $105,000
Other Selective Sales: $56,000
- Total Salaries and Wages: $8,873,000
Pend Oreille County government finances - Revenue in 2018:
- Charges - Other: $1,496,000
Solid Waste Management: $1,061,000
Regular Highways: $57,000
Parks and Recreation: $36,000
Natural Resources - Other: $2,000
- Construction - Regular Highways: $276,000
General - Other: $40,000
Central Staff Services: $5,000
- Current Operations - Regular Highways: $3,885,000
Police Protection: $2,277,000
Health - Other: $2,065,000
Financial Administration: $1,759,000
General - Other: $1,644,000
Judicial and Legal Services: $1,632,000
Solid Waste Management: $1,220,000
Correctional Institutions: $1,187,000
Central Staff Services: $1,103,000
Natural Resources - Other: $704,000
General Public Buildings: $495,000
Housing and Community Development: $146,000
Corrections - Other: $115,000
Public Welfare - Other: $90,000
Parks and Recreation: $50,000
Libraries: $3,000
- Federal Intergovernmental - General Local Government Support: $985,000
Other: $93,000
- General - Interest on Debt: $331,000
- Intergovernmental to Local - Other - Health - Other: $213,000
Other - Financial Administration: $50,000
Other - Solid Waste Management: $17,000
Other - Parks and Recreation: $4,000
Other - Correctional Institutions: $1,000
- Local Intergovernmental - Other: $1,723,000
- Long Term Debt - Beginning Outstanding - Unspecified Public Purpose: $8,288,000
Outstanding Unspecified Public Purpose: $6,855,000
Retired Unspecified Public Purpose: $2,230,000
Issue, Unspecified Public Purpose: $798,000
- Miscellaneous - Fines and Forfeits: $169,000
Rents: $167,000
Donations From Private Sources: $110,000
Sale of Property: $98,000
General Revenue - Other: $65,000
Interest Earnings: $0
- Other Capital Outlay - General - Other: $62,000
Regular Highways: $27,000
Health - Other: $17,000
Correctional Institutions: $9,000
Central Staff Services: $9,000
Financial Administration: $3,000
Solid Waste Management: $2,000
Natural Resources - Other: $1,000
- State Intergovernmental - Other: $3,006,000
Health and Hospitals: $2,097,000
Highways: $2,020,000
General Local Government Support: $62,000
- Tax - Property: $3,979,000
General Sales and Gross Receipts: $1,434,000
Severance: $300,000
Other License: $181,000
Motor Vehicle License: $170,000
Documentary and Stock Transfer: $165,000
Public Utilities Sales: $105,000
Other Selective Sales: $56,000
- Total Salaries and Wages: $8,873,000
Pend Oreille County government finances - Debt in 2018:
- Charges - Other: $1,496,000
Solid Waste Management: $1,061,000
Regular Highways: $57,000
Parks and Recreation: $36,000
Natural Resources - Other: $2,000
- Construction - Regular Highways: $276,000
General - Other: $40,000
Central Staff Services: $5,000
- Current Operations - Regular Highways: $3,885,000
Police Protection: $2,277,000
Health - Other: $2,065,000
Financial Administration: $1,759,000
General - Other: $1,644,000
Judicial and Legal Services: $1,632,000
Solid Waste Management: $1,220,000
Correctional Institutions: $1,187,000
Central Staff Services: $1,103,000
Natural Resources - Other: $704,000
General Public Buildings: $495,000
Housing and Community Development: $146,000
Corrections - Other: $115,000
Public Welfare - Other: $90,000
Parks and Recreation: $50,000
Libraries: $3,000
- Federal Intergovernmental - General Local Government Support: $985,000
Other: $93,000
- General - Interest on Debt: $331,000
- Intergovernmental to Local - Other - Health - Other: $213,000
Other - Financial Administration: $50,000
Other - Solid Waste Management: $17,000
Other - Parks and Recreation: $4,000
Other - Correctional Institutions: $1,000
- Local Intergovernmental - Other: $1,723,000
- Long Term Debt - Beginning Outstanding - Unspecified Public Purpose: $8,288,000
Outstanding Unspecified Public Purpose: $6,855,000
Retired Unspecified Public Purpose: $2,230,000
Issue, Unspecified Public Purpose: $798,000
- Miscellaneous - Fines and Forfeits: $169,000
Rents: $167,000
Donations From Private Sources: $110,000
Sale of Property: $98,000
General Revenue - Other: $65,000
Interest Earnings: $0
- Other Capital Outlay - General - Other: $62,000
Regular Highways: $27,000
Health - Other: $17,000
Correctional Institutions: $9,000
Central Staff Services: $9,000
Financial Administration: $3,000
Solid Waste Management: $2,000
Natural Resources - Other: $1,000
- State Intergovernmental - Other: $3,006,000
Health and Hospitals: $2,097,000
Highways: $2,020,000
General Local Government Support: $62,000
- Tax - Property: $3,979,000
General Sales and Gross Receipts: $1,434,000
Severance: $300,000
Other License: $181,000
Motor Vehicle License: $170,000
Documentary and Stock Transfer: $165,000
Public Utilities Sales: $105,000
Other Selective Sales: $56,000
- Total Salaries and Wages: $8,873,000
Pend Oreille County government finances - Cash and Securities in 2018:
- Charges - Other: $1,496,000
Solid Waste Management: $1,061,000
Regular Highways: $57,000
Parks and Recreation: $36,000
Natural Resources - Other: $2,000
- Construction - Regular Highways: $276,000
General - Other: $40,000
Central Staff Services: $5,000
- Current Operations - Regular Highways: $3,885,000
Police Protection: $2,277,000
Health - Other: $2,065,000
Financial Administration: $1,759,000
General - Other: $1,644,000
Judicial and Legal Services: $1,632,000
Solid Waste Management: $1,220,000
Correctional Institutions: $1,187,000
Central Staff Services: $1,103,000
Natural Resources - Other: $704,000
General Public Buildings: $495,000
Housing and Community Development: $146,000
Corrections - Other: $115,000
Public Welfare - Other: $90,000
Parks and Recreation: $50,000
Libraries: $3,000
- Federal Intergovernmental - General Local Government Support: $985,000
Other: $93,000
- General - Interest on Debt: $331,000
- Intergovernmental to Local - Other - Health - Other: $213,000
Other - Financial Administration: $50,000
Other - Solid Waste Management: $17,000
Other - Parks and Recreation: $4,000
Other - Correctional Institutions: $1,000
- Local Intergovernmental - Other: $1,723,000
- Long Term Debt - Beginning Outstanding - Unspecified Public Purpose: $8,288,000
Outstanding Unspecified Public Purpose: $6,855,000
Retired Unspecified Public Purpose: $2,230,000
Issue, Unspecified Public Purpose: $798,000
- Miscellaneous - Fines and Forfeits: $169,000
Rents: $167,000
Donations From Private Sources: $110,000
Sale of Property: $98,000
General Revenue - Other: $65,000
Interest Earnings: $0
- Other Capital Outlay - General - Other: $62,000
Regular Highways: $27,000
Health - Other: $17,000
Correctional Institutions: $9,000
Central Staff Services: $9,000
Financial Administration: $3,000
Solid Waste Management: $2,000
Natural Resources - Other: $1,000
- State Intergovernmental - Other: $3,006,000
Health and Hospitals: $2,097,000
Highways: $2,020,000
General Local Government Support: $62,000
- Tax - Property: $3,979,000
General Sales and Gross Receipts: $1,434,000
Severance: $300,000
Other License: $181,000
Motor Vehicle License: $170,000
Documentary and Stock Transfer: $165,000
Public Utilities Sales: $105,000
Other Selective Sales: $56,000
- Total Salaries and Wages: $8,873,000
Supplemental Security Income (SSI) in 2006:
- Total number of recipients: 396
- Number of aged recipients: 17
- Number of blind and disabled recipients: 379
- Number of recipients under 18: 31
- Number of recipients between 18 and 64: 314
- Number of recipients older than 64: 51
- Number of recipients also receiving OASDI: 122
- Amount of payments (thousands of dollars): 218
| Most common first names in Pend Oreille County, WA among deceased individuals | ||
| Name | Count | Lived (average) |
|---|---|---|
| John | 87 | 75.2 years |
| William | 67 | 76.0 years |
| Robert | 57 | 71.7 years |
| Charles | 44 | 74.2 years |
| George | 44 | 75.2 years |
| Mary | 43 | 79.1 years |
| James | 37 | 71.1 years |
| Frank | 30 | 79.8 years |
| Dorothy | 27 | 80.5 years |
| Donald | 27 | 69.4 years |
| Most common last names in Pend Oreille County, WA among deceased individuals | ||
| Last name | Count | Lived (average) |
|---|---|---|
| Johnson | 38 | 77.9 years |
| Smith | 36 | 75.7 years |
| Miller | 25 | 76.8 years |
| Jones | 24 | 75.7 years |
| Anderson | 21 | 77.1 years |
| Nelson | 19 | 80.1 years |
| Olson | 19 | 75.3 years |
| Martin | 17 | 74.8 years |
| Reed | 15 | 75.5 years |
| Clark | 15 | 75.9 years |
| Businesses in Pend Oreille County, WA | ||||
| Name | Count | Name | Count | |
|---|---|---|---|---|
| FedEx | 2 | U-Haul | 1 | |
| McDonald's | 1 | UPS | 1 | |
| RadioShack | 1 | Vons | 1 | |
| Starbucks | 1 | |||
Pend Oreille County on our top lists:
- #87 on the list of "Top 101 counties with the lowest surface withdrawal of fresh water for public supply"