Powhatan County, Virginia (VA)
County owner-occupied free and clear houses and condos in 2010: 1,845
County owner-occupied houses and condos in 2000: 6,449
Renter-occupied apartments: 1,091 (it was 809 in 2000)
| % of renters here: | 11% |
| State: | 33% |
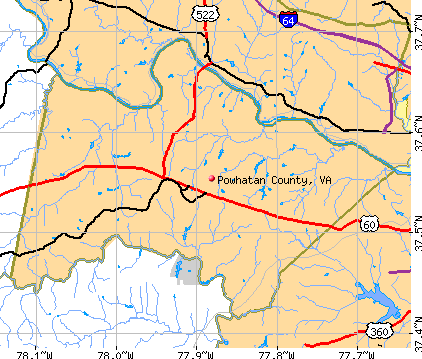
Land area: 261 sq. mi.
Water area: 1.1 sq. mi.
Population density: 118 people per square mile (average).
Industries providing employment: Educational, health and social services (19.6%), Professional, scientific, management, administrative, and waste management services (11.9%), Construction (11.8%), Retail trade (11.5%), Finance, insurance, real estate, and rental and leasing (10.6%).
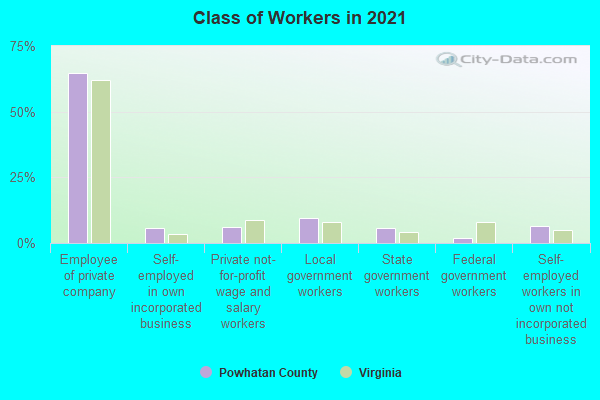
Type of workers:
- Private wage or salary: 79%
- Government: 15%
- Self-employed, not incorporated: 6%
- Unpaid family work: 0%
- OSM Map
- General Map
- Google Map
- MSN Map

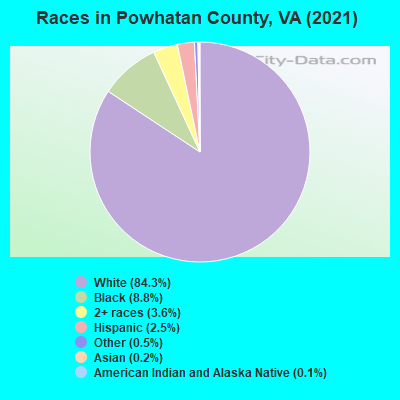
- 25,60384.3%White Non-Hispanic Alone
- 2,6488.7%Black Non-Hispanic Alone
- 1,0563.5%Two or more races
- 7892.6%Hispanic or Latino
- 1970.6%Some other race alone
- 480.2%Asian alone
- 290.10%American Indian and Alaska Native alone
| Median resident age: | 46.0 years |
| Virginia median age: | 39.0 years |
| Males: 16,117 | |
| Females: 14,595 |

 | Chesterfield and Powhatan County Schools (8 replies) |
| New York Teacher Moving to Richmond Virginia (5 replies) |
| Looking into Richmond area (7 replies) |
| 2019 Best Neighborhoods/Suburbs for families (3 replies) |
| Powhatan County or Hanover County (6 replies) |
| School options in central VA (6 replies) |
| Powhatan County: | 2.0 people |
| Virginia: | 3 people |
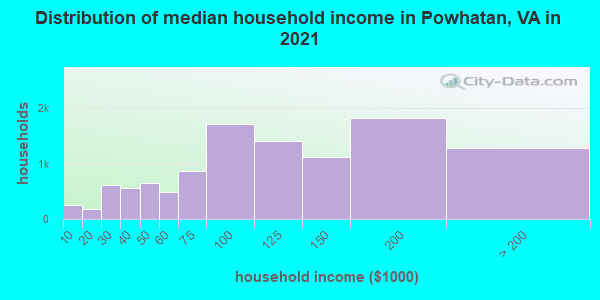
Estimated median household income in 2022: $106,384 ($53,992 in 1999)
| This county: | $106,384 |
| Virginia: | $85,873 |
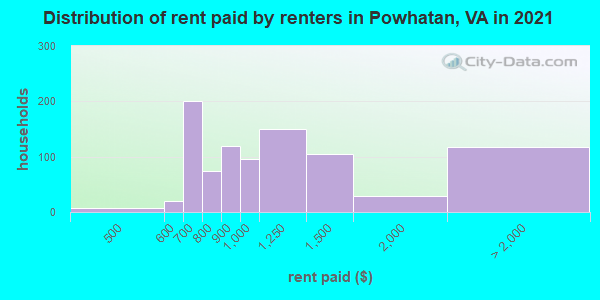
Median contract rent in 2022 for apartments: $957 (lower quartile is $733, upper quartile is $1,254)
| This county: | $957 |
| State: | $1270 |
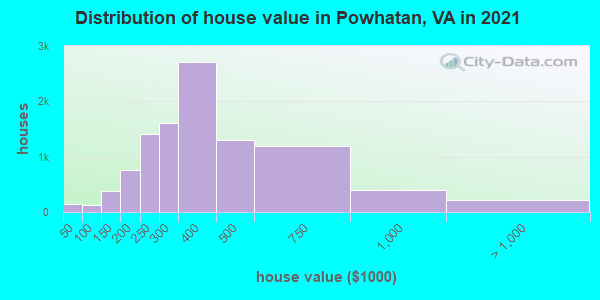
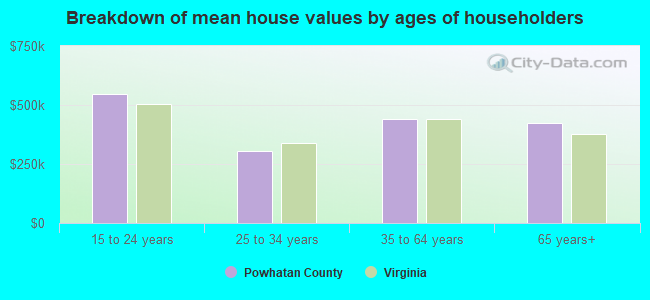
Estimated median house or condo value in 2022: $383,673 (it was $140,000 in 2000)
| Powhatan: | $383,673 |
| Virginia: | $365,700 |
Median monthly housing costs for homes and condos with a mortgage: $1,812
Median monthly housing costs for units without a mortgage: $527
Institutionalized population: 2,361
Crime in 2021 (reported by the sheriff's office or county police, not the county total):
- Murders: 0
- Rapes: 10
- Robberies: 0
- Assaults: 41
- Burglaries: 15
- Thefts: 140
- Auto thefts: 2
Crime in 2020 (reported by the sheriff's office or county police, not the county total):
- Murders: 0
- Rapes: 4
- Robberies: 0
- Assaults: 34
- Burglaries: 16
- Thefts: 195
- Auto thefts: 9
Health of residents in Powhatan County based on CDC Behavioral Risk Factor Surveillance System Survey Questionnaires from 2013 to 2021:
General health status score of residents in this county from 1 (poor) to 5 (excellent) is 3.5. This is about average.73.5% of residents exercised in the past month. This is about average.
42.1% of residents smoked 100+ cigarettes in their lives. This is about average.
54.8% of adult residents drank alcohol in the past 30 days. This is less than average.
74.3% of residents visited a dentist within the past year. This is about average.
Average weight of males is 200 pounds. This is more than average.
Average weight of females is 167 pounds. This is more than average.
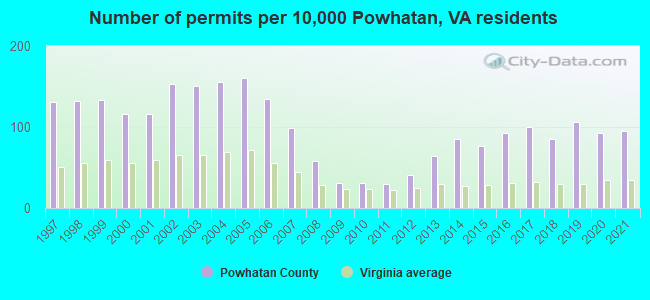
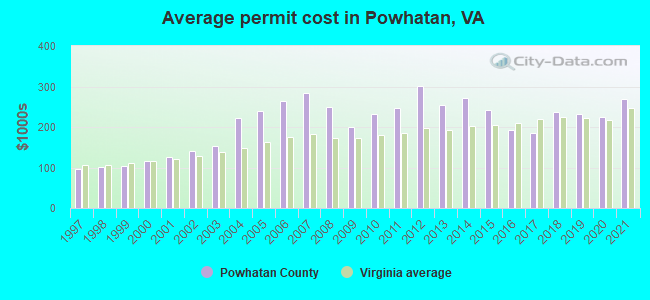
Single-family new house construction building permits:
- 2022: 216 buildings, average cost: $313,400
- 2021: 213 buildings, average cost: $269,700
- 2020: 207 buildings, average cost: $224,500
- 2019: 238 buildings, average cost: $230,800
- 2018: 191 buildings, average cost: $236,800
- 2017: 223 buildings, average cost: $185,100
- 2016: 208 buildings, average cost: $192,700
- 2015: 171 buildings, average cost: $242,300
- 2014: 191 buildings, average cost: $271,900
- 2013: 143 buildings, average cost: $254,100
- 2012: 91 buildings, average cost: $300,700
- 2011: 68 buildings, average cost: $246,000
- 2010: 70 buildings, average cost: $233,400
- 2009: 69 buildings, average cost: $199,300
- 2008: 130 buildings, average cost: $249,000
- 2007: 222 buildings, average cost: $282,900
- 2006: 303 buildings, average cost: $265,400
- 2005: 360 buildings, average cost: $239,600
- 2004: 347 buildings, average cost: $221,400
- 2003: 337 buildings, average cost: $153,000
- 2002: 343 buildings, average cost: $140,300
- 2001: 260 buildings, average cost: $127,300
- 2000: 260 buildings, average cost: $117,200
- 1999: 298 buildings, average cost: $102,800
- 1998: 296 buildings, average cost: $102,200
- 1997: 294 buildings, average cost: $95,500
Median real estate property taxes paid for housing units with mortgages in 2022: $2,341 (0.6%)
Median real estate property taxes paid for housing units with no mortgage in 2022: $2,468 (0.6%)
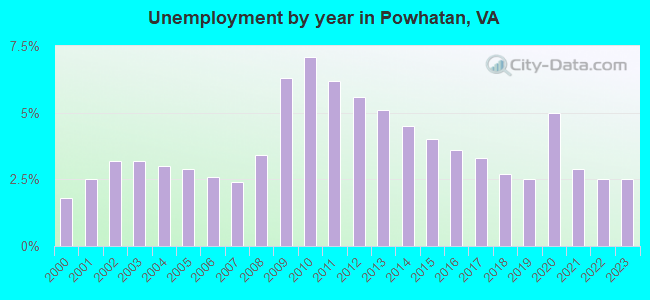
| Powhatan County: | 4.8% |
| Virginia: | 10.6% |
Median age of residents in 2022: 46.0 years old
(Males: 43.9 years old, Females: 48.5 years old)
(Median age for: White residents: 47.8 years old, Black residents: 44.9 years old, American Indian residents: 11.7 years old, Asian residents: 52.0 years old, Hispanic or Latino residents: 31.9 years old, Other race residents: 43.0 years old)
Area name: Richmond, VA HUD Metro FMR Area
Fair market rent in 2006 for a 1-bedroom apartment in Powhatan County is $678 a month.
Fair market rent for a 2-bedroom apartment is $757 a month.
Fair market rent for a 3-bedroom apartment is $1010 a month.
Neighboring counties: Barton County, Missouri  , Raleigh County, West Virginia , Jackson County, Kentucky , Roanoke County , Stanton County, Kansas , Powell County, Kentucky .
| Here: | 2.4% |
| Virginia: | 2.7% |

Current college students: 807
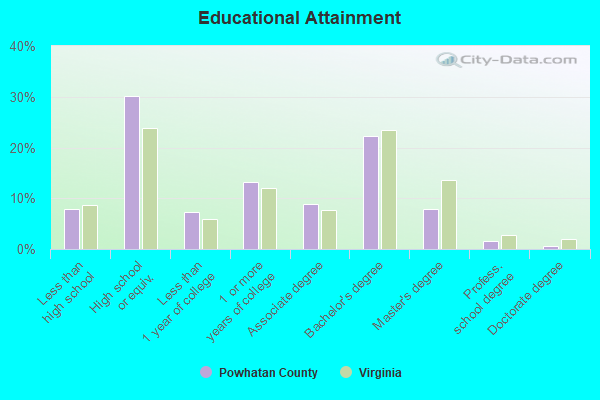
People 25 years of age or older with a high school degree or higher: 91.5%
People 25 years of age or older with a bachelor's degree or higher: 32.8%
Number of foreign born residents: 661 (47.6% naturalized citizens)
| Powhatan County: | 2.2% |
| Whole state: | 12.7% |
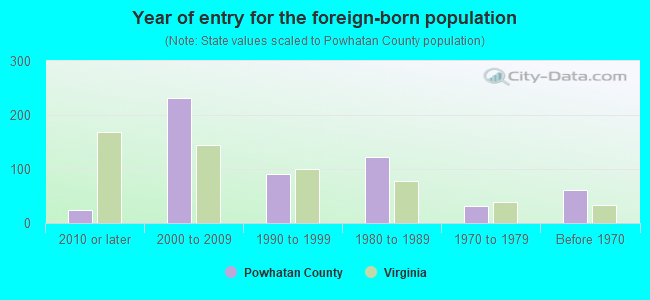
- Year of entry for the foreign-born population
- 1972010 or later
- 2152000 to 2009
- 371990 to 1999
- 1221980 to 1989
- 321970 to 1979
- 61Before 1970
Mean travel time to work (commute): minutes
Percentage of county residents living and working in this county: 100.1%

Housing units in structures:
- One, detached: 11,199
- One, attached: 225
- Two: 96
- 5 to 9: 22
- Mobile homes: 260
- Boats, RVs, vans, etc.: 9
Housing units in Powhatan County with a mortgage: 7,178 (1,085 second mortgage, 46 home equity loan, 908 both second mortgage and home equity loan)
Houses without a mortgage: 400
| Here: | 1.7% with mortgage |
| State: | 97.2% with mortgage |
Food Environment Statistics:
| Powhatan County: | 1.09 / 10,000 pop. |
| State: | 2.03 / 10,000 pop. |
| This county: | 1.45 / 10,000 pop. |
| Virginia: | 1.43 / 10,000 pop. |
| Powhatan County: | 1.81 / 10,000 pop. |
| Virginia: | 4.03 / 10,000 pop. |
| This county: | 3.99 / 10,000 pop. |
| State: | 7.65 / 10,000 pop. |
| Powhatan County: | 8.3% |
| Virginia: | 9.3% |
| Powhatan County: | 27.6% |
| State: | 26.7% |
| Here: | 20.5% |
| State: | 18.6% |
Agriculture in Powhatan County:
Average size of farms: 239 acresAverage value of agricultural products sold per farm: $35,376
Average value of crops sold per acre for harvested cropland: $119.02
The value of nursery, greenhouse, floriculture, and sod as a percentage of the total market value of agricultural products sold: 7.29%
The value of livestock, poultry, and their products as a percentage of the total market value of agricultural products sold: 80.66%
Average total farm production expenses per farm: $32,111
Harvested cropland as a percentage of land in farms: 24.09%
Irrigated harvested cropland as a percentage of land in farms: 1.74%
Average market value of all machinery and equipment per farm: $39,786
The percentage of farms operated by a family or individual: 90.83%
Average age of principal farm operators: 58 years
Average number of cattle and calves per 100 acres of all land in farms: 12.84
Milk cows as a percentage of all cattle and calves: 12.18%
Corn for grain: 876 harvested acres
All wheat for grain: 711 harvested acres
Soybeans for beans: 1329 harvested acres
Land in orchards: 11 acres
Earthquake activity:
Powhatan County-area historical earthquake activity is significantly above Virginia state average. It is 50% smaller than the overall U.S. average.On 8/23/2011 at 17:51:04, a magnitude 5.8 (5.8 MW, Depth: 3.7 mi, Class: Moderate, Intensity: VI - VII) earthquake occurred 24.8 miles away from Powhatan County center
On 12/9/2003 at 20:59:14, a magnitude 4.5 (4.5 MB, 4.5 LG, Class: Light, Intensity: IV - V) earthquake occurred 2.6 miles away from the county center
On 12/9/2003 at 20:59:18, a magnitude 4.5 (4.5 ML, Depth: 6.2 mi) earthquake occurred 19.4 miles away from the county center
On 8/25/2011 at 05:07:52, a magnitude 4.5 (4.5 ML, Depth: 4.2 mi) earthquake occurred 27.6 miles away from the county center
On 8/9/2020 at 12:07:37, a magnitude 5.1 (5.1 MW, Depth: 4.7 mi) earthquake occurred 192.4 miles away from Powhatan County center
On 8/24/2011 at 00:04:36, a magnitude 4.2 (4.2 ML) earthquake occurred 25.3 miles away from the county center
Magnitude types: regional Lg-wave magnitude (LG), body-wave magnitude (MB), local magnitude (ML), moment magnitude (MW)
Most recent natural disasters:
- Virginia Covid-19 Pandemic, Incident Period: January 20, 2020, Major Disaster (Presidential) Declared DR-4512-VA: April 2, 2020, FEMA Id: 4512, Natural disaster type: Other
- Virginia Tropical Storm Michael, Incident Period: October 9, 2018 - October 16, 2018, FEMA Id: 4411, Natural disaster type: Tropical Storm
- Virginia Hurricane Sandy, Incident Period: October 26, 2012 to November 01, 2012, Emergency Declared EM-3359: October 29, 2012, FEMA Id: 3359, Natural disaster type: Hurricane
- Virginia Severe Storms and Straight-line Winds, Incident Period: June 29, 2012 to July 01, 2012, Major Disaster (Presidential) Declared DR-4072: July 27, 2012, FEMA Id: 4072, Natural disaster type: Storm, Wind
- Virginia Hurricane Irene, Incident Period: August 26, 2011 to August 28, 2011, Major Disaster (Presidential) Declared DR-4024: September 03, 2011, FEMA Id: 4024, Natural disaster type: Hurricane
- Virginia Hurricane Katrina Evacuation, Incident Period: August 29, 2005 to October 01, 2005, Emergency Declared EM-3240: September 12, 2005, FEMA Id: 3240, Natural disaster type: Hurricane
- Virginia Hurricane Isabel, Incident Period: September 18, 2003 to October 01, 2003, Major Disaster (Presidential) Declared DR-1491: September 18, 2003, FEMA Id: 1491, Natural disaster type: Hurricane
- Virginia Winter Storm, Incident Period: January 25, 2000 to January 30, 2000, Major Disaster (Presidential) Declared DR-1318: February 28, 2000, FEMA Id: 1318, Natural disaster type: Winter Storm
- Virginia Hurricane Fran, Incident Period: September 05, 1996 to September 23, 1996, Major Disaster (Presidential) Declared DR-1135: September 06, 1996, FEMA Id: 1135, Natural disaster type: Hurricane
- Virginia Blizzard, Incident Period: January 06, 1996 to January 12, 1996, Major Disaster (Presidential) Declared DR-1086: January 13, 1996, FEMA Id: 1086, Natural disaster type: Blizzard
- 8 other natural disasters have been reported since 1953.
The number of natural disasters in Powhatan County (18) is near the US average (15).
Major Disasters (Presidential) Declared: 12
Emergencies Declared: 5
Causes of natural disasters: Hurricanes: 5, Storms: 5, Floods: 4, Droughts: 2, Tropical Storms: 2, Winter Storms: 2, Blizzard: 1, Ice Storm: 1, Wind: 1, Other: 1 (Note: some incidents may be assigned to more than one category).
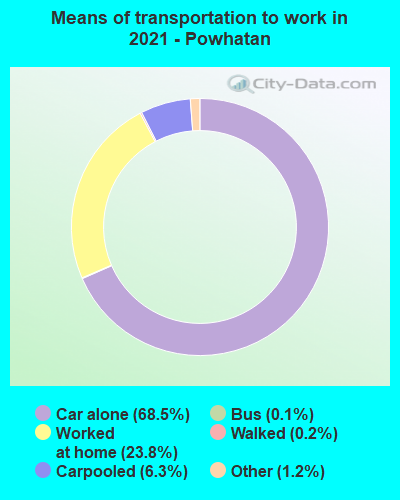
Means of transportation to work:
- Drove a car alone: 6,493 (63.1%)
- Carpooled: 796 (7.7%)
- Bus: 9 (0.1%)
- Taxicab, motorcycle, or other means: 171 (1.7%)
- Walked: 54 (0.5%)
- Worked at home: 3,151 (30.6%)
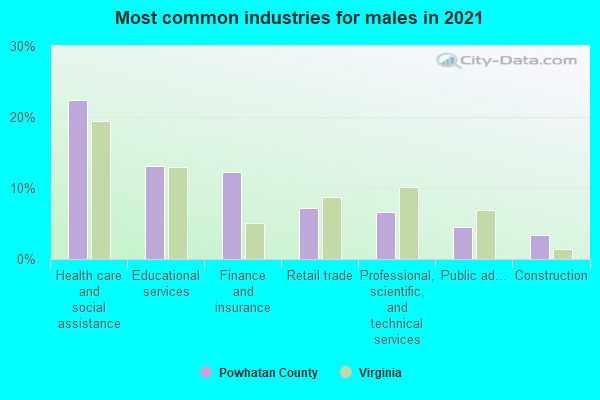
- Health care and social assistance (21%)
- Educational services (13%)
- Retail trade (12%)
- Finance and insurance (11%)
- Professional, scientific, and technical services (8%)
- Public administration (5%)
- Construction (4%)
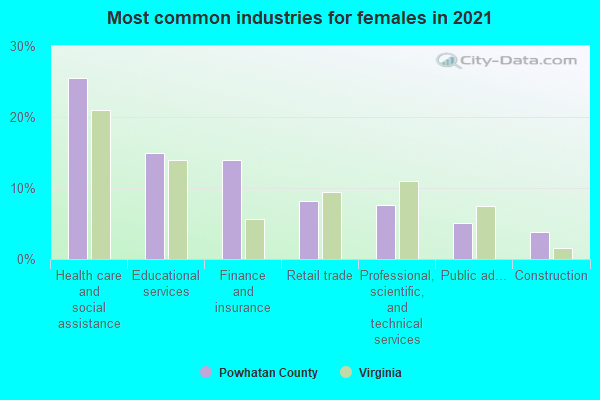
- Health care and social assistance (22%)
- Educational services (14%)
- Retail trade (13%)
- Finance and insurance (12%)
- Professional, scientific, and technical services (8%)
- Public administration (5%)
- Construction (4%)
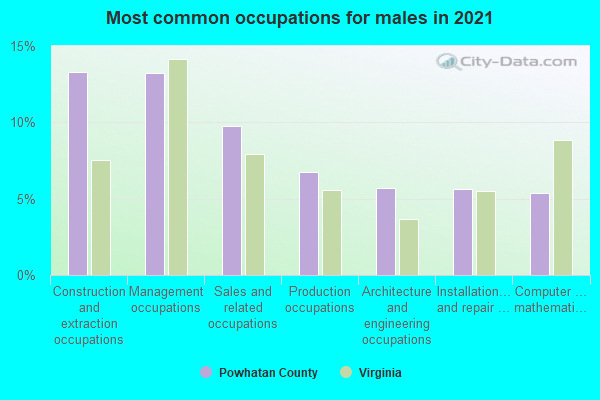
- Management occupations (14%)
- Sales and related occupations (12%)
- Construction and extraction occupations (11%)
- Installation, maintenance, and repair occupations (7%)
- Architecture and engineering occupations (6%)
- Computer and mathematical occupations (5%)
- Transportation occupations (5%)
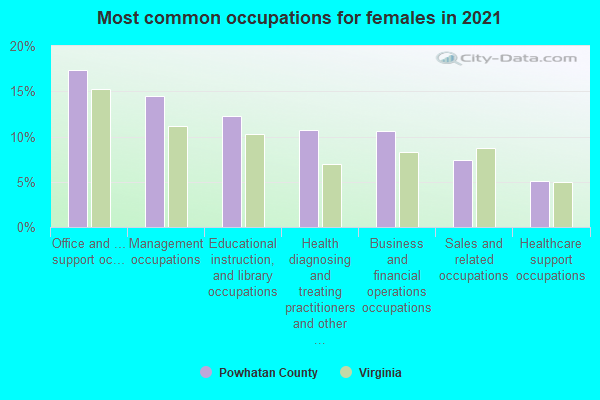
- Management occupations (19%)
- Office and administrative support occupations (14%)
- Sales and related occupations (12%)
- Educational instruction, and library occupations (11%)
- Business and financial operations occupations (11%)
- Health diagnosing and treating practitioners and other technical occupations (8%)
- Health technologists and technicians (5%)
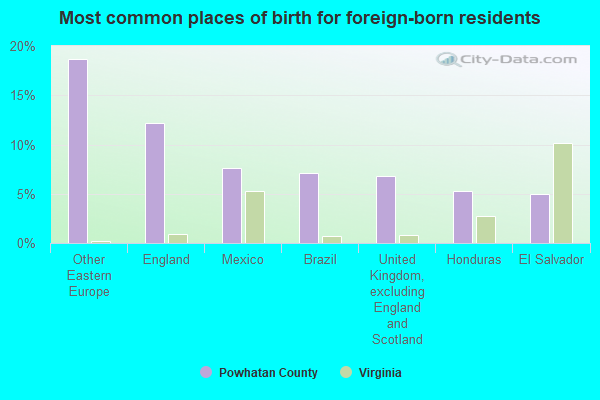
- Other Eastern Europe (24%)
- Jordan (22%)
- France (12%)
- England (9%)
- Mexico (6%)
- Brazil (4%)
- Ecuador (3%)
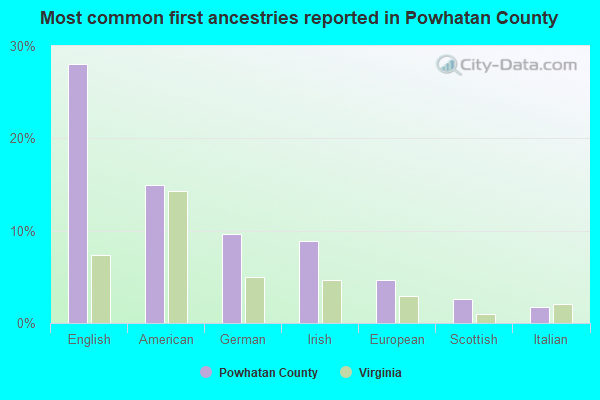
- English (24%)
- American (14%)
- German (9%)
- Irish (8%)
- European (5%)
- Scottish (4%)
- Italian (2%)
People in group quarters in Powhatan County, Virginia in 2010:
- 2,021 people in state prisons
- 340 people in correctional facilities intended for juveniles
- 31 people in workers' group living quarters and job corps centers
- 3 people in group homes intended for adults
People in group quarters in Powhatan County, Virginia in 2000:
- 1,215 people in local jails and other confinement facilities (including police lockups)
- 935 people in state prisons
- 301 people in training schools for juvenile delinquents
- 23 people in homes for the mentally ill
- 5 people in homes for the mentally retarded
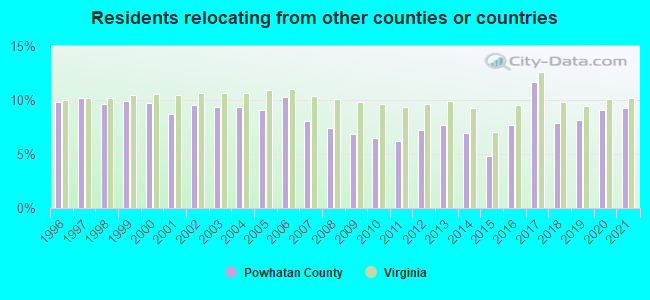
9.27% of this county's 2021 resident taxpayers lived in other counties in 2020 ($86,321 average adjusted gross income)
| Here: | 9.27% |
| Virginia average: | 10.16% |
10 or fewer of this county's residents moved from foreign countries.
7.64% relocated from other counties in Virginia ($73,084 average AGI)
1.64% relocated from other states ($13,237 average AGI)
Powhatan County: 1.64% Virginia average: 3.91%
Top counties from which taxpayers relocated into this county between 2020 and 2021:
| from Chesterfield County, VA | |
| from Henrico County, VA | |
| from Richmond city, VA | |
| from Goochland County, VA | |
| from Cumberland County, VA | |
| from Amelia County, VA | |
| from Hanover County, VA |
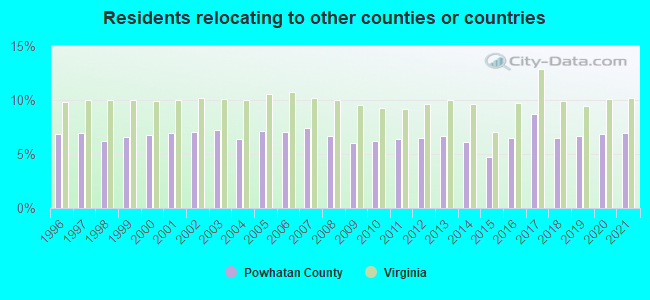
6.91% of this county's 2020 resident taxpayers moved to other counties in 2021 ($87,370 average adjusted gross income)
| Here: | 6.91% |
| Virginia average: | 10.20% |
10 or fewer of this county's residents moved to foreign countries.
5.56% relocated to other counties in Virginia ($60,110 average AGI)
1.35% relocated to other states ($27,260 average AGI)
Powhatan County: 1.35% Virginia average: 3.98%
Top counties to which taxpayers relocated from this county between 2020 and 2021:
| to Chesterfield County, VA | |
| to Henrico County, VA | |
| to Richmond city, VA | |
| to Amelia County, VA | |
| to Goochland County, VA | |
| to Cumberland County, VA |
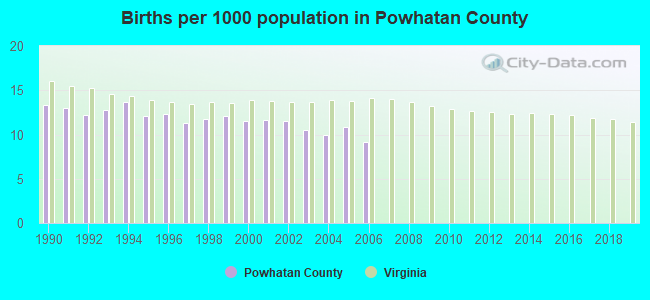
Births per 1000 population from 1990 to 1999: 12.4
Births per 1000 population from 2000 to 2006: 10.7
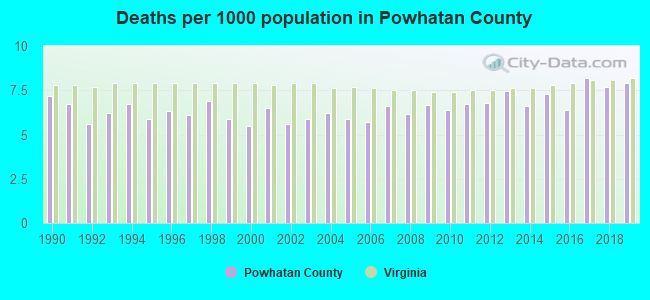
Deaths per 1000 population from 1990 to 1999: 6.4
Deaths per 1000 population from 2000 to 2009: 6.1
Deaths per 1000 population from 2010 to 2020: 7.4
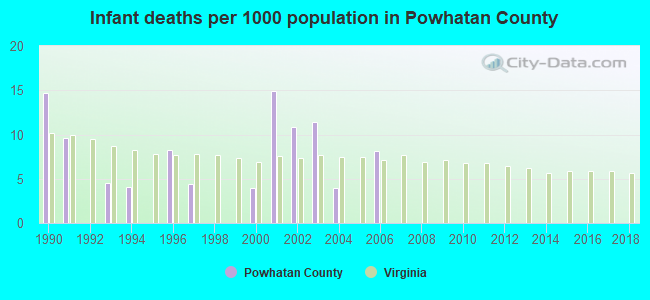
Infant deaths per 1000 live births from 1990 to 1999: 4.6
Infant deaths per 1000 live births from 2000 to 2006: 7.6
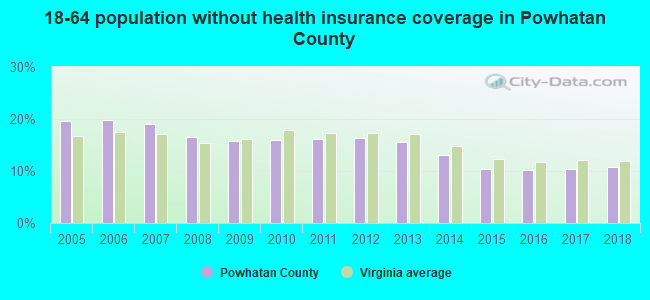
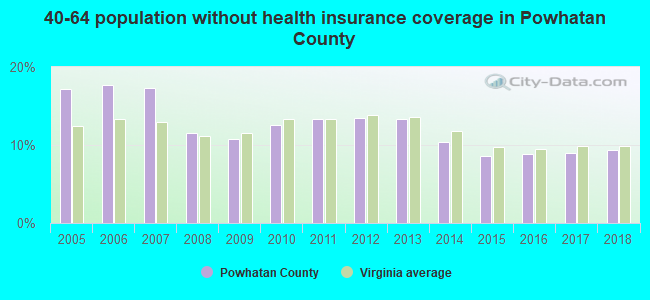
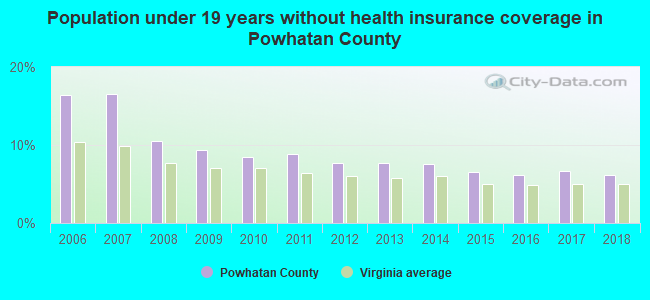
Persons under 19 years old without health insurance coverage in 2018: 6.1%
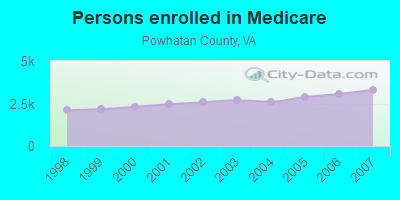
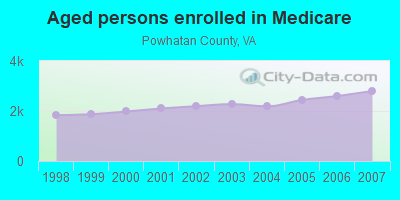
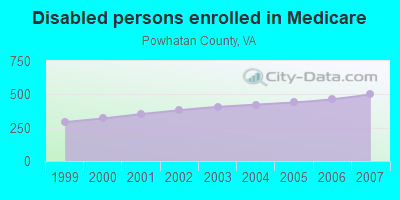
Persons enrolled in hospital insurance and/or supplemental medical insurance (Medicare) in July 1, 2007: 3,298 (2,798 aged, 500 disabled)
Children under 18 without health insurance coverage in 2007: 958 (16%)
Most common underlying causes of death in Powhatan County, Virginia in 1999 - 2019:
- Bronchus or lung, unspecified - Malignant neoplasms (277)
- Atherosclerotic heart disease (112)
- Chronic obstructive pulmonary disease, unspecified (79)
- Acute myocardial infarction, unspecified (43)
- Unspecified dementia (39)
- Alzheimer disease, unspecified (26)
- Breast, unspecified - Malignant neoplasms (10)
- Pancreas, unspecified - Malignant neoplasms (10)
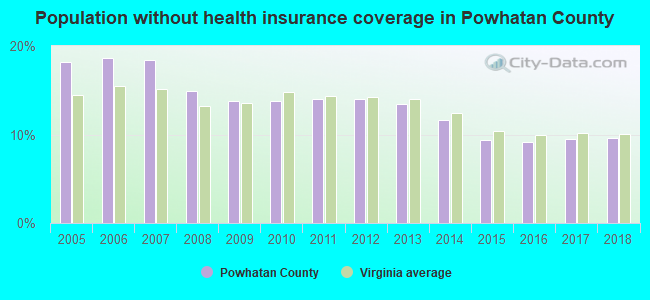
Population without health insurance coverage in 2000: 7%
Children under 18 without health insurance coverage in 2000: 4%
Medical specialist MDs per 100,000 population in 2005: 602
Dentists per 100,000 population in 1998: 11
Total births per 100,000 population, July 2005 - July 2006 : 14
Total deaths per 100,000 population, July 2005 - July 2006: 30
Limited-service eating places per 100,000 population in 2005 : 11
Suicides per 1,000,000 population from 2000 to 2006: 144.2. This is more than state average.
Household type by relationship:
Households: 30,712- Male householders: 5,896 (809 living alone), Female householders: 5,482 (994 living alone)
7,478 spouses (7,394 opposite-sex spouses), 602 unmarried partners, (602 opposite-sex unmarried partners), 7,385 children (6,976 natural, 170 adopted, 236 stepchildren), 552 grandchildren, 192 brothers or sisters, 552 parents, 0 foster children, 421 other relatives, 512 non-relatives
- In group quarters: 1,688
Size of family households: 4,768 2-persons, 1,933 3-persons, 1,391 4-persons, 671 5-persons, 132 6-persons, 105 7-or-more-persons.
Size of nonfamily households: 1,803 1-person, 453 2-persons, 56 3-persons, 32 4-persons.
3,948 married couples with children.
728 single-parent households (237 men, 491 women).
96.0% of residents of Powhatan speak English at home.
1.3% of residents speak Spanish at home (74% speak English very well, 12% speak English well, 7% speak English not well, 7% don't speak English at all).
1.2% of residents speak other Indo-European language at home (91% speak English very well, 9% speak English well).
1.3% of residents speak other language at home (67% speak English very well, 33% speak English well).
In fiscal year 2004:
Federal Government expenditure: $76,106,000 ($2,942 per capita)
Department of Defense expenditure: $7,358,000
Federal direct payments to individuals for retirement and disability: $50,083,000
Federal other direct payments to individuals: $11,769,000
Federal direct payments not to individuals: $267,000
Federal grants: $5,285,000
Federal procurement contracts: $925,000 ($6,000 Department of Defense)
Federal salaries and wages: $7,777,000 ($3,951,000 Department of Defense)
Federal Government direct loans: $354,000
Federal guaranteed/insured loans: $22,970,000
Federal Government insurance: $2,681,000
Population change from April 1, 2000 to July 1, 2005:
Births: 1,413| Here: | 53 per 1000 residents |
| State: | 70 per 1000 residents |
Deaths: 742
| Here: | 28 per 1000 residents |
| State: | 40 per 1000 residents |
Net international migration: 0
| Here: | 0 per 1000 residents |
| State: | +18 per 1000 residents |
Net internal migration: +3,587
| Here: | +135 per 1000 residents |
| State: | +14 per 1000 residents |
Total withdrawal of fresh water for public supply: 0.08 millions of gallons per day (all from ground)
| Here: | 7.0 |
| State: | 7.0 |
| Here: | 5.5 |
| State: | 4.3 |
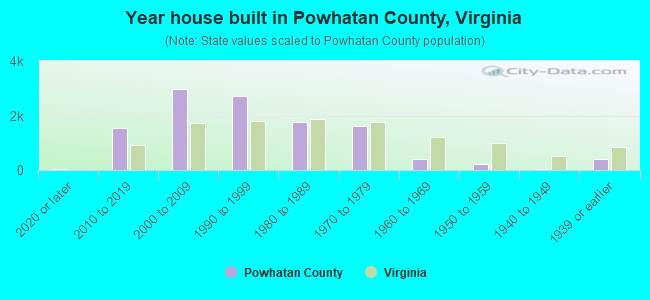
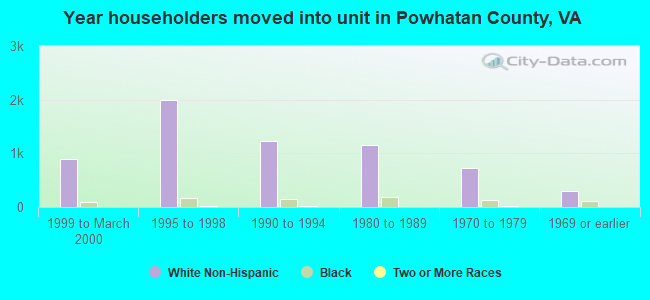
- Year house built in Powhatan County, Virginia
- 1222020 or later
- 1,6352010 to 2019
- 2,8242000 to 2009
- 2,6111990 to 1999
- 1,7151980 to 1989
- 1,8501970 to 1979
- 3671960 to 1969
- 2201950 to 1959
- 1111940 to 1949
- 3111939 or earlier
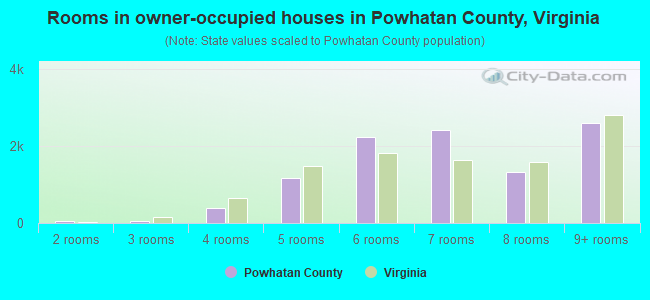
- Rooms in owner-occupied houses in Powhatan County, Virginia
- 201 room
- 292 rooms
- 563 rooms
- 3284 rooms
- 1,1755 rooms
- 2,5156 rooms
- 2,2417 rooms
- 1,3598 rooms
- 2,7209+ rooms

- Rooms in renter-occupied apartments in Powhatan County, Virginia
- 01 room
- 252 rooms
- 733 rooms
- 1254 rooms
- 2325 rooms
- 4166 rooms
- 207 rooms
- 268 rooms
- 479+ rooms
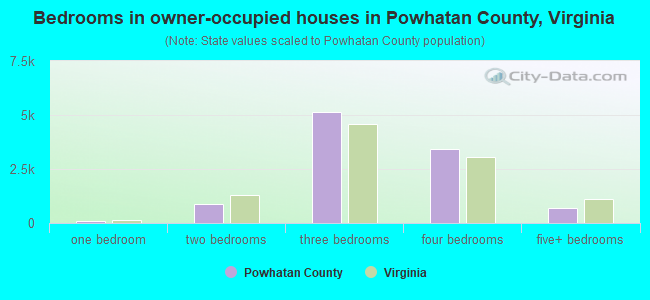
- Bedrooms in owner-occupied houses in Powhatan County, Virginia
- 47no bedroom
- 441 bedroom
- 7402 bedrooms
- 5,2993 bedrooms
- 3,4724 bedrooms
- 8645+ bedrooms
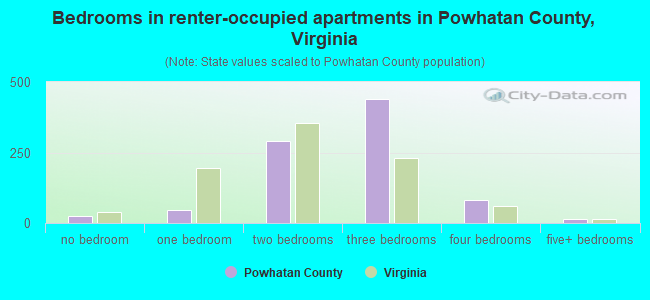
- Bedrooms in renter-occupied apartments in Powhatan County, Virginia
- 0no bedroom
- 801 bedroom
- 3612 bedrooms
- 3733 bedrooms
- 1254 bedrooms
- 405+ bedrooms
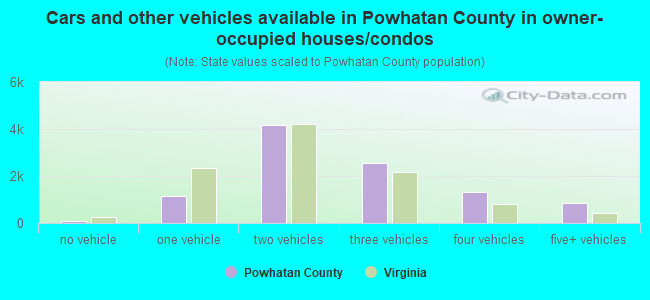
- Cars and other vehicles available in Powhatan County in owner-occupied houses/condos
- 151no vehicle
- 1,2971 vehicle
- 4,3012 vehicles
- 2,5083 vehicles
- 1,2194 vehicles
- 9225+ vehicles
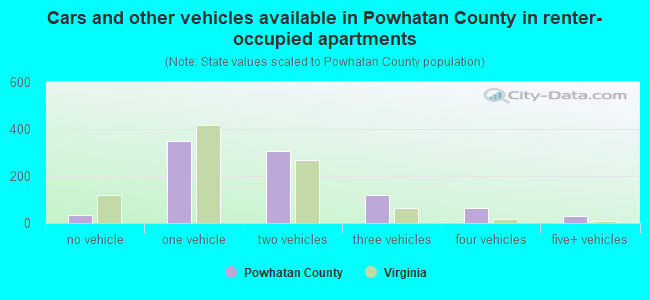
- Cars and other vehicles available in Powhatan County in renter-occupied apartments
- 34no vehicle
- 3411 vehicle
- 2952 vehicles
- 1723 vehicles
- 964 vehicles
- 405+ vehicles
89.8% of Powhatan County residents lived in the same house 1 years ago.
Out of people who lived in different houses, 20% lived in this county.
Out of people who lived in different counties, 78% lived in Virginia.
| Powhatan County: | 89.8% |
| State average: | 86.6% |
Place of birth for U.S.-born residents:
- This state: 20,177
- Other state: 9,429
- Northeast: 3,160
- Midwest: 1,316
- South: 4,139
- West: 798
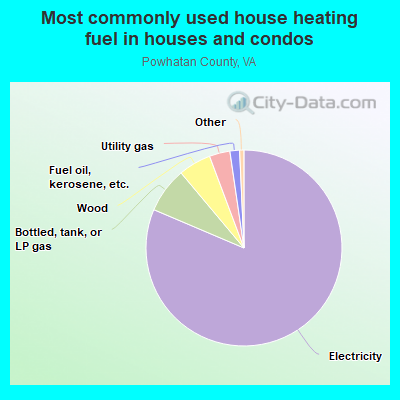
- 81.2%Electricity
- 7.4%Bottled, tank, or LP gas
- 4.7%Wood
- 3.7%Utility gas
- 2.0%Fuel oil, kerosene, etc.
- 0.5%No fuel used
- 0.3%Other fuel
- 0.2%Solar energy
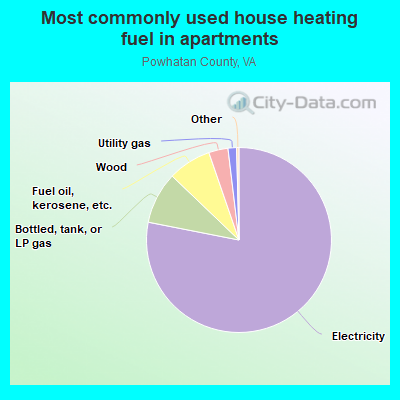
- 72.3%Electricity
- 13.3%Bottled, tank, or LP gas
- 7.9%Fuel oil, kerosene, etc.
- 3.4%Utility gas
- 3.2%Wood
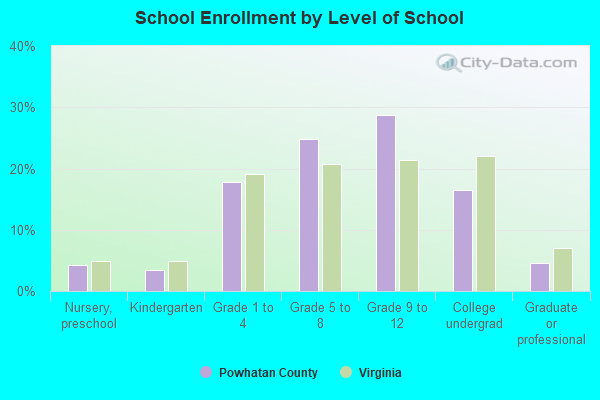
Private vs. public school enrollment:
| Here: | 9.1% |
| Virginia: | 13.2% |
| Here: | 1.9% |
| Virginia: | 10.2% |
| Here: | 21.9% |
| Virginia: | 18.7% |
Powhatan County government finances - Expenditure in 2017:
- Assistance and Subsidies - Public Welfare, Federal Categorical Assistance Programs: $689,000
Public Welfare, Cash Assistance Programs - Other: $51,000
- Bond Funds - Cash and Securities: $46,920,000
- Charges - Elementary and Secondary Education School Lunch: $659,000
Other: $572,000
Elementary and Secondary Education School Tuition and Transportation: $149,000
Solid Waste Management: $55,000
Elementary and Secondary Education - Other: $20,000
Parks and Recreation: $11,000
- Construction - Parks and Recreation: $704,000
General Public Buildings: $390,000
Sewerage: $311,000
Police Protection: $197,000
Elementary and Secondary Education: $176,000
Local Fire Protection: $5,000
- Current Operations - Elementary and Secondary Education: $45,023,000
Police Protection: $4,565,000
Central Staff Services: $1,986,000
Local Fire Protection: $1,700,000
Financial Administration: $1,664,000
Public Welfare - Other: $1,656,000
Sewerage: $1,607,000
General Public Buildings: $1,502,000
Judicial and Legal Services: $886,000
Correctional Institutions: $583,000
General - Other: $527,000
Solid Waste Management: $481,000
Libraries: $454,000
Health - Other: $299,000
Public Welfare Institutions: $266,000
Protective Inspection and Regulation - Other: $246,000
Parks and Recreation: $82,000
- Federal Intergovernmental - Education: $72,000
- Intergovernmental to Local - Other - Elementary and Secondary Education: $348,000
- Local Intergovernmental - Education: $282,000
- Long Term Debt - Outstanding Unspecified Public Purpose: $128,463,000
Beginning Outstanding - Unspecified Public Purpose: $78,685,000
Issue, Unspecified Public Purpose: $58,883,000
Retired Unspecified Public Purpose: $9,105,000
- Miscellaneous - Fines and Forfeits: $271,000
General Revenue - Other: $201,000
Rents: $133,000
Interest Earnings: $127,000
Sale of Property: $69,000
Donations From Private Sources: $5,000
- Other Capital Outlay - Local Fire Protection: $916,000
Police Protection: $186,000
General Public Building: $122,000
Elementary and Secondary Education: $89,000
Sewerage: $27,000
- Other Funds - Cash and Securities: $20,350,000
- Revenue - Water Utilities: $310,000
- State Intergovernmental - Education: $22,809,000
General Local Government Support: $6,047,000
Public Welfare: $2,349,000
Other: $438,000
- Tax - Property: $39,177,000
Motor Vehicle License: $1,054,000
Public Utility License: $666,000
General Sales and Gross Receipts: $405,000
Other License: $219,000
Occupation and Business License - Other: $109,000
- Total Salaries and Wages: $28,054,000
- Water Utilities - Interest on Debt: $3,148,000
Powhatan County government finances - Revenue in 2017:
- Assistance and Subsidies - Public Welfare, Federal Categorical Assistance Programs: $689,000
Public Welfare, Cash Assistance Programs - Other: $51,000
- Bond Funds - Cash and Securities: $46,920,000
- Charges - Elementary and Secondary Education School Lunch: $659,000
Other: $572,000
Elementary and Secondary Education School Tuition and Transportation: $149,000
Solid Waste Management: $55,000
Elementary and Secondary Education - Other: $20,000
Parks and Recreation: $11,000
- Construction - Parks and Recreation: $704,000
General Public Buildings: $390,000
Sewerage: $311,000
Police Protection: $197,000
Elementary and Secondary Education: $176,000
Local Fire Protection: $5,000
- Current Operations - Elementary and Secondary Education: $45,023,000
Police Protection: $4,565,000
Central Staff Services: $1,986,000
Local Fire Protection: $1,700,000
Financial Administration: $1,664,000
Public Welfare - Other: $1,656,000
Sewerage: $1,607,000
General Public Buildings: $1,502,000
Judicial and Legal Services: $886,000
Correctional Institutions: $583,000
General - Other: $527,000
Solid Waste Management: $481,000
Libraries: $454,000
Health - Other: $299,000
Public Welfare Institutions: $266,000
Protective Inspection and Regulation - Other: $246,000
Parks and Recreation: $82,000
- Federal Intergovernmental - Education: $72,000
- Intergovernmental to Local - Other - Elementary and Secondary Education: $348,000
- Local Intergovernmental - Education: $282,000
- Long Term Debt - Outstanding Unspecified Public Purpose: $128,463,000
Beginning Outstanding - Unspecified Public Purpose: $78,685,000
Issue, Unspecified Public Purpose: $58,883,000
Retired Unspecified Public Purpose: $9,105,000
- Miscellaneous - Fines and Forfeits: $271,000
General Revenue - Other: $201,000
Rents: $133,000
Interest Earnings: $127,000
Sale of Property: $69,000
Donations From Private Sources: $5,000
- Other Capital Outlay - Local Fire Protection: $916,000
Police Protection: $186,000
General Public Building: $122,000
Elementary and Secondary Education: $89,000
Sewerage: $27,000
- Other Funds - Cash and Securities: $20,350,000
- Revenue - Water Utilities: $310,000
- State Intergovernmental - Education: $22,809,000
General Local Government Support: $6,047,000
Public Welfare: $2,349,000
Other: $438,000
- Tax - Property: $39,177,000
Motor Vehicle License: $1,054,000
Public Utility License: $666,000
General Sales and Gross Receipts: $405,000
Other License: $219,000
Occupation and Business License - Other: $109,000
- Total Salaries and Wages: $28,054,000
- Water Utilities - Interest on Debt: $3,148,000
Powhatan County government finances - Debt in 2017:
- Assistance and Subsidies - Public Welfare, Federal Categorical Assistance Programs: $689,000
Public Welfare, Cash Assistance Programs - Other: $51,000
- Bond Funds - Cash and Securities: $46,920,000
- Charges - Elementary and Secondary Education School Lunch: $659,000
Other: $572,000
Elementary and Secondary Education School Tuition and Transportation: $149,000
Solid Waste Management: $55,000
Elementary and Secondary Education - Other: $20,000
Parks and Recreation: $11,000
- Construction - Parks and Recreation: $704,000
General Public Buildings: $390,000
Sewerage: $311,000
Police Protection: $197,000
Elementary and Secondary Education: $176,000
Local Fire Protection: $5,000
- Current Operations - Elementary and Secondary Education: $45,023,000
Police Protection: $4,565,000
Central Staff Services: $1,986,000
Local Fire Protection: $1,700,000
Financial Administration: $1,664,000
Public Welfare - Other: $1,656,000
Sewerage: $1,607,000
General Public Buildings: $1,502,000
Judicial and Legal Services: $886,000
Correctional Institutions: $583,000
General - Other: $527,000
Solid Waste Management: $481,000
Libraries: $454,000
Health - Other: $299,000
Public Welfare Institutions: $266,000
Protective Inspection and Regulation - Other: $246,000
Parks and Recreation: $82,000
- Federal Intergovernmental - Education: $72,000
- Intergovernmental to Local - Other - Elementary and Secondary Education: $348,000
- Local Intergovernmental - Education: $282,000
- Long Term Debt - Outstanding Unspecified Public Purpose: $128,463,000
Beginning Outstanding - Unspecified Public Purpose: $78,685,000
Issue, Unspecified Public Purpose: $58,883,000
Retired Unspecified Public Purpose: $9,105,000
- Miscellaneous - Fines and Forfeits: $271,000
General Revenue - Other: $201,000
Rents: $133,000
Interest Earnings: $127,000
Sale of Property: $69,000
Donations From Private Sources: $5,000
- Other Capital Outlay - Local Fire Protection: $916,000
Police Protection: $186,000
General Public Building: $122,000
Elementary and Secondary Education: $89,000
Sewerage: $27,000
- Other Funds - Cash and Securities: $20,350,000
- Revenue - Water Utilities: $310,000
- State Intergovernmental - Education: $22,809,000
General Local Government Support: $6,047,000
Public Welfare: $2,349,000
Other: $438,000
- Tax - Property: $39,177,000
Motor Vehicle License: $1,054,000
Public Utility License: $666,000
General Sales and Gross Receipts: $405,000
Other License: $219,000
Occupation and Business License - Other: $109,000
- Total Salaries and Wages: $28,054,000
- Water Utilities - Interest on Debt: $3,148,000
Powhatan County government finances - Cash and Securities in 2017:
- Assistance and Subsidies - Public Welfare, Federal Categorical Assistance Programs: $689,000
Public Welfare, Cash Assistance Programs - Other: $51,000
- Bond Funds - Cash and Securities: $46,920,000
- Charges - Elementary and Secondary Education School Lunch: $659,000
Other: $572,000
Elementary and Secondary Education School Tuition and Transportation: $149,000
Solid Waste Management: $55,000
Elementary and Secondary Education - Other: $20,000
Parks and Recreation: $11,000
- Construction - Parks and Recreation: $704,000
General Public Buildings: $390,000
Sewerage: $311,000
Police Protection: $197,000
Elementary and Secondary Education: $176,000
Local Fire Protection: $5,000
- Current Operations - Elementary and Secondary Education: $45,023,000
Police Protection: $4,565,000
Central Staff Services: $1,986,000
Local Fire Protection: $1,700,000
Financial Administration: $1,664,000
Public Welfare - Other: $1,656,000
Sewerage: $1,607,000
General Public Buildings: $1,502,000
Judicial and Legal Services: $886,000
Correctional Institutions: $583,000
General - Other: $527,000
Solid Waste Management: $481,000
Libraries: $454,000
Health - Other: $299,000
Public Welfare Institutions: $266,000
Protective Inspection and Regulation - Other: $246,000
Parks and Recreation: $82,000
- Federal Intergovernmental - Education: $72,000
- Intergovernmental to Local - Other - Elementary and Secondary Education: $348,000
- Local Intergovernmental - Education: $282,000
- Long Term Debt - Outstanding Unspecified Public Purpose: $128,463,000
Beginning Outstanding - Unspecified Public Purpose: $78,685,000
Issue, Unspecified Public Purpose: $58,883,000
Retired Unspecified Public Purpose: $9,105,000
- Miscellaneous - Fines and Forfeits: $271,000
General Revenue - Other: $201,000
Rents: $133,000
Interest Earnings: $127,000
Sale of Property: $69,000
Donations From Private Sources: $5,000
- Other Capital Outlay - Local Fire Protection: $916,000
Police Protection: $186,000
General Public Building: $122,000
Elementary and Secondary Education: $89,000
Sewerage: $27,000
- Other Funds - Cash and Securities: $20,350,000
- Revenue - Water Utilities: $310,000
- State Intergovernmental - Education: $22,809,000
General Local Government Support: $6,047,000
Public Welfare: $2,349,000
Other: $438,000
- Tax - Property: $39,177,000
Motor Vehicle License: $1,054,000
Public Utility License: $666,000
General Sales and Gross Receipts: $405,000
Other License: $219,000
Occupation and Business License - Other: $109,000
- Total Salaries and Wages: $28,054,000
- Water Utilities - Interest on Debt: $3,148,000
Supplemental Security Income (SSI) in 2006:
- Total number of recipients: 242
- Number of aged recipients: 36
- Number of blind and disabled recipients: 206
- Number of recipients under 18: 36
- Number of recipients between 18 and 64: 145
- Number of recipients older than 64: 61
- Number of recipients also receiving OASDI: 98
- Amount of payments (thousands of dollars): 98
Powhatan County on our top lists:
- #64 on the list of "Top 101 counties with the lowest total withdrawal of fresh water for public supply"