Ripley County, Missouri (MO)
County owner-occupied free and clear houses and condos in 2010: 2,116
County owner-occupied houses and condos in 2000: 4,225
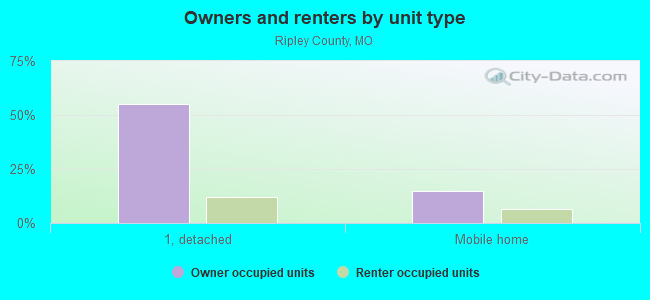
Renter-occupied apartments: 1,313 (it was 1,191 in 2000)
| % of renters here: | 22% |
| State: | 31% |
Land area: 629 sq. mi.
Water area: 2.2 sq. mi.
Population density: 17 people per square mile (low).
Industries providing employment: Educational, health and social services (25.6%), Manufacturing (16.7%), Retail trade (11.4%), Transportation and warehousing,and utilities (10.1%).
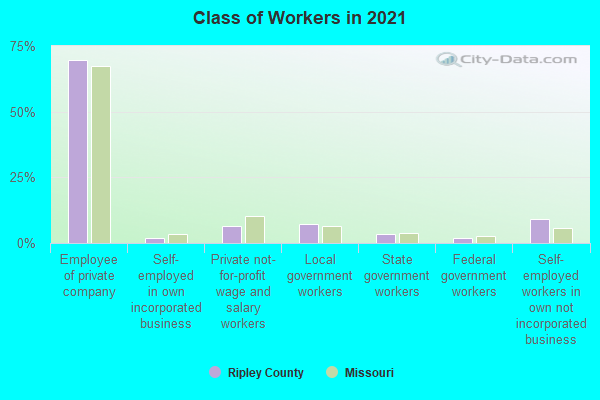
Type of workers:
- Private wage or salary: 78%
- Government: 12%
- Self-employed, not incorporated: 11%
- Unpaid family work: 0%
- OSM Map
- General Map
- Google Map
- MSN Map

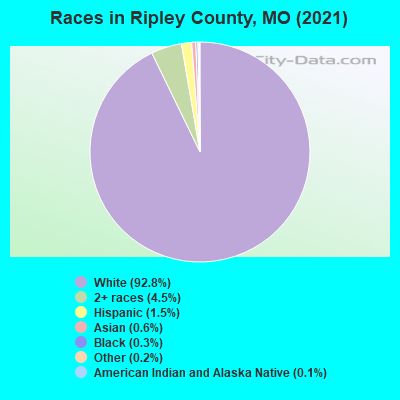
- 9,98591.7%White Non-Hispanic Alone
- 4984.6%Two or more races
- 2532.3%Hispanic or Latino
- 970.9%Asian alone
- 310.3%Some other race alone
- 110.1%American Indian and Alaska Native alone
- 100.09%Black Non-Hispanic Alone
| Median resident age: | 41.4 years |
| Missouri median age: | 39.1 years |
| Males: 5,414 | |
| Females: 5,466 |

 | Interesting Missouri facts. (1186 replies) |
| Missouri Outlaw History (3407 replies) |
| Missouri...Southern or Midwestern? (1475 replies) |
| Ripley County: | 2.0 people |
| Missouri: | 2 people |
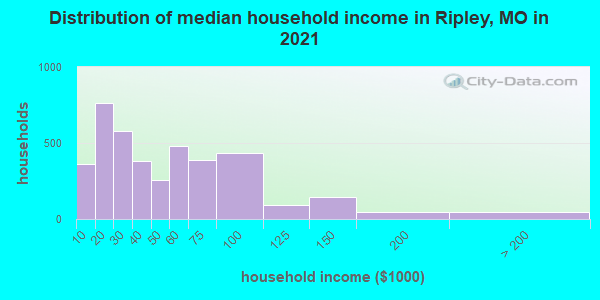
Estimated median household income in 2022: $41,825 ($22,761 in 1999)
| This county: | $41,825 |
| Missouri: | $64,811 |
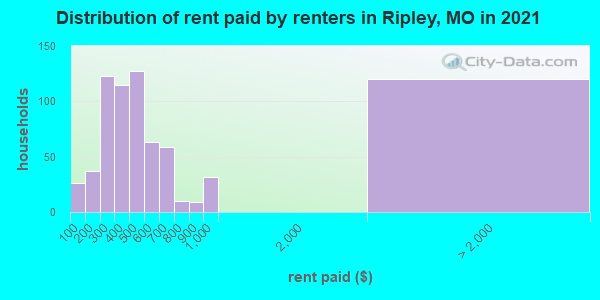
Median contract rent in 2022 for apartments: $476 (lower quartile is $339, upper quartile is $598)
| This county: | $476 |
| State: | $757 |
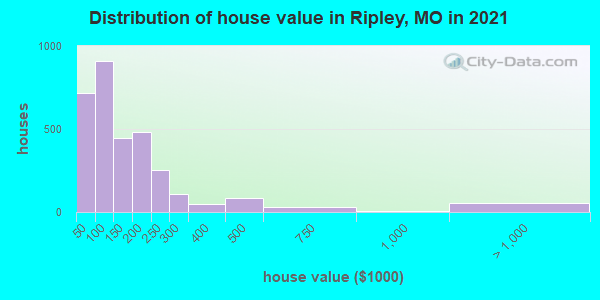
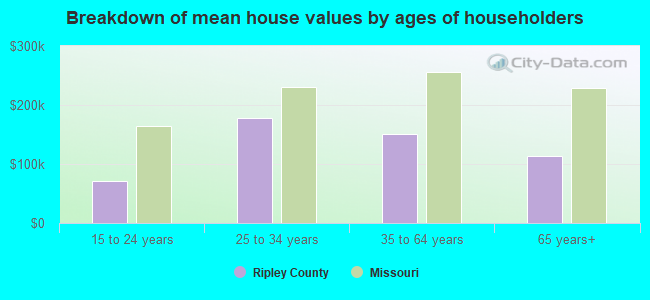
Estimated median house or condo value in 2022: $115,037 (it was $46,500 in 2000)
| Ripley: | $115,037 |
| Missouri: | $221,200 |
Mean price in 2022:
Median monthly housing costs for homes and condos with a mortgage: $904Detached houses: $164,170
Here: $164,170 State: $278,068 Townhouses or other attached units: $163,709
Here: $163,709 State: $260,773 Mobile homes: $89,242
Here: $89,242 State: $95,912
Median monthly housing costs for units without a mortgage: $324
Institutionalized population: 60
Crime in 2021 (reported by the sheriff's office or county police, not the county total):
- Murders: 0
- Rapes: 0
- Robberies: 0
- Assaults: 5
- Burglaries: 11
- Thefts: 22
- Auto thefts: 12
Crime in 2020 (reported by the sheriff's office or county police, not the county total):
- Murders: 1
- Rapes: 0
- Robberies: 0
- Assaults: 2
- Burglaries: 27
- Thefts: 54
- Auto thefts: 19
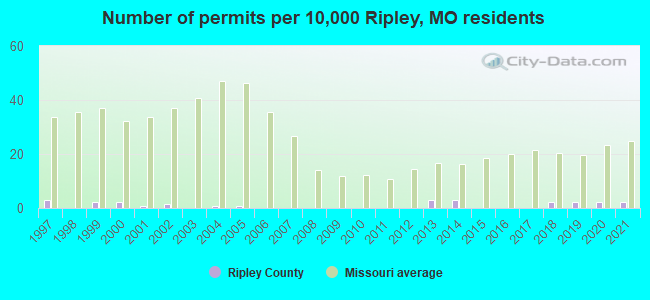
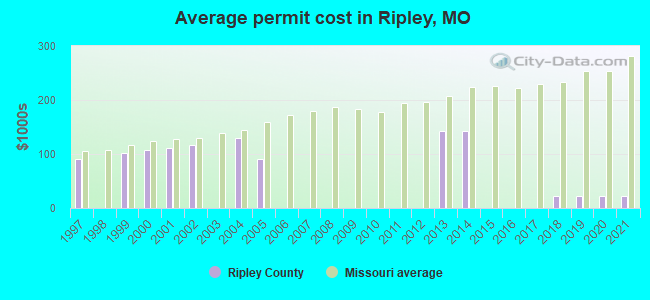
Single-family new house construction building permits:
- 2022: 0 buildings
- 2021: 3 buildings, average cost: $21,700
- 2020: 3 buildings, average cost: $21,700
- 2019: 3 buildings, average cost: $21,700
- 2018: 3 buildings, average cost: $21,700
- 2017: 0 buildings
- 2016: 0 buildings
- 2015: 0 buildings
- 2014: 4 buildings, average cost: $142,500
- 2013: 4 buildings, average cost: $142,500
- 2012: 0 buildings
- 2011: 0 buildings
- 2010: 0 buildings
- 2009: 0 buildings
- 2008: 0 buildings
- 2007: 0 buildings
- 2006: 0 buildings
- 2005: 1 building, cost: $90,000
- 2004: 1 building, cost: $129,600
- 2003: 0 buildings
- 2002: 2 buildings, average cost: $116,300
- 2001: 1 building, cost: $111,900
- 2000: 3 buildings, average cost: $108,200
- 1999: 3 buildings, average cost: $101,700
- 1998: 0 buildings
- 1997: 4 buildings, average cost: $90,300
Median real estate property taxes paid for housing units with mortgages in 2022: $581 (0.4%)
Median real estate property taxes paid for housing units with no mortgage in 2022: $493 (0.5%)
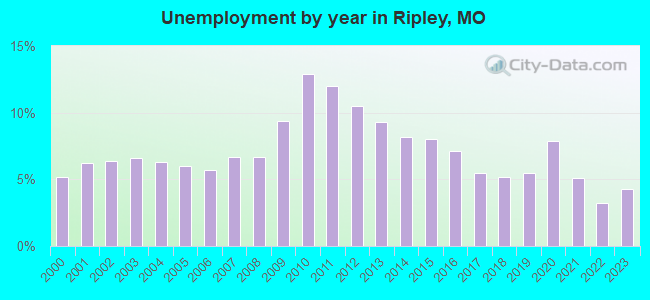
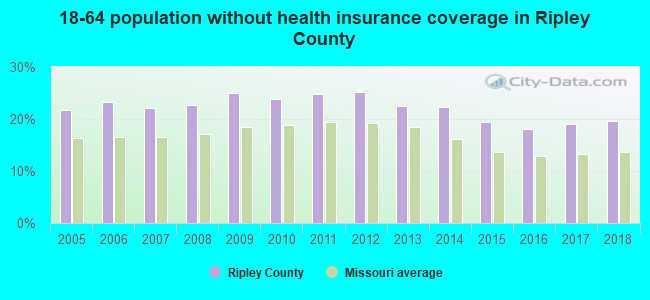
| Ripley County: | 21.1% |
| Missouri: | 13.2% |
Median age of residents in 2022: 41.4 years old
(Males: 39.0 years old, Females: 42.7 years old)
(Median age for: White residents: 41.9 years old, Black residents: 67.2 years old, Asian residents: 56.3 years old, Hispanic or Latino residents: 11.8 years old, Other race residents: 21.4 years old)
Fair market rent in 2006 for a 1-bedroom apartment in Ripley County is $386 a month.
Fair market rent for a 2-bedroom apartment is $464 a month.
Fair market rent for a 3-bedroom apartment is $645 a month.
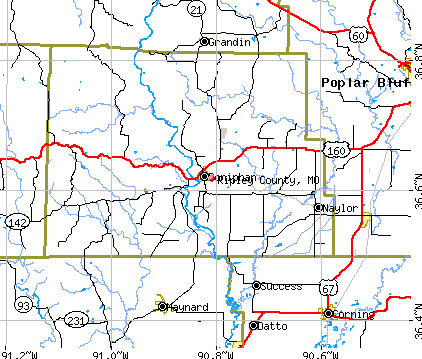
Cities in this county include: Doniphan, Fairdealing, Naylor, Oxly.
Neighboring counties: Garfield County, Oklahoma  , Union County, New Mexico , Kingfisher County, Oklahoma , Obion County, Tennessee
  , Trigg County, Kentucky .
| Here: | 3.7% |
| Missouri: | 2.8% |
Current college students: 272
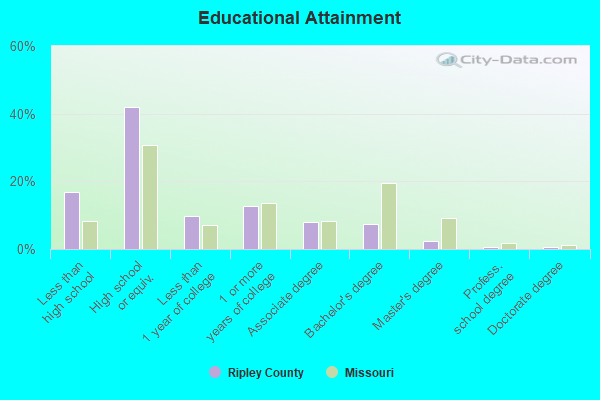
People 25 years of age or older with a high school degree or higher: 82.2%
People 25 years of age or older with a bachelor's degree or higher: 11.9%
Number of foreign born residents: 134 (77.1% naturalized citizens)
| Ripley County: | 1.2% |
| Whole state: | 4.1% |
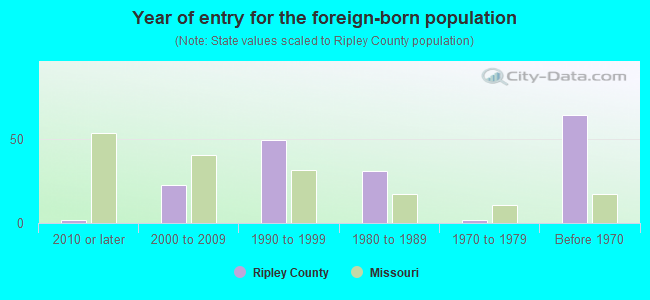
- Year of entry for the foreign-born population
- 362010 or later
- 442000 to 2009
- 411990 to 1999
- 311980 to 1989
- 21970 to 1979
- 64Before 1970
Mean travel time to work (commute): # minutes
Percentage of county residents living and working in this county: 90.8%
Housing units in structures:
- One, detached: 3,811
- One, attached: 25
- Two: 34
- 3 or 4: 123
- 5 to 9: 18
- 10 to 19: 35
- 20 or more: 11
- Mobile homes: 1,167
Housing units in Ripley County with a mortgage: 1,597 (84 second mortgage, 0 home equity loan, 57 both second mortgage and home equity loan)
Houses without a mortgage: 54
| Here: | 1.8% with mortgage |
| State: | 98.0% with mortgage |
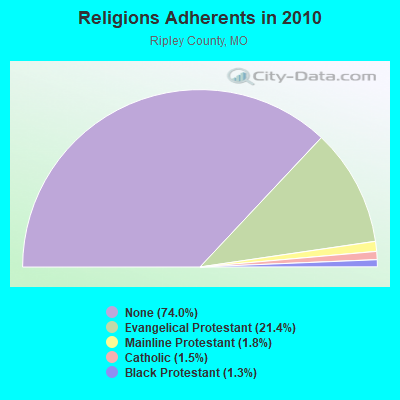
Religion statistics for Ripley County
| Religion | Adherents | Congregations |
|---|---|---|
| Evangelical Protestant | 3,016 | 31 |
| Mainline Protestant | 259 | 4 |
| Catholic | 208 | 1 |
| Black Protestant | 182 | 1 |
| Other | - | 1 |
| None | 10,435 | - |
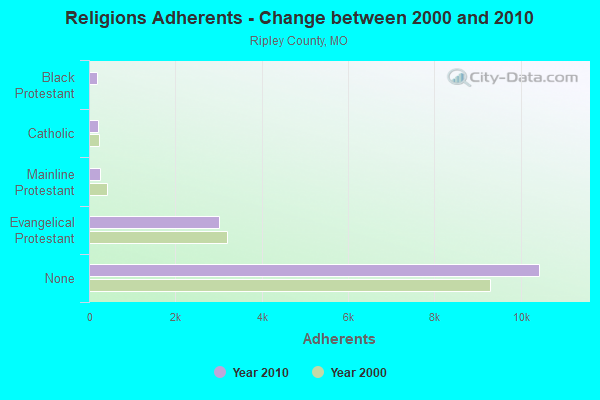
Source: Clifford Grammich, Kirk Hadaway, Richard Houseal, Dale E.Jones, Alexei Krindatch, Richie Stanley and Richard H.Taylor. 2012. 2010 U.S.Religion Census: Religious Congregations & Membership Study. Association of Statisticians of American Religious Bodies. Jones, Dale E., et al. 2002. Congregations and Membership in the United States 2000. Nashville, TN: Glenmary Research Center.
Food Environment Statistics:
| Ripley County: | 1.48 / 10,000 pop. |
| State: | 1.88 / 10,000 pop. |
| This county: | 0.74 / 10,000 pop. |
| Missouri: | 0.60 / 10,000 pop. |
| Ripley County: | 6.65 / 10,000 pop. |
| Missouri: | 4.34 / 10,000 pop. |
| This county: | 0.74 / 10,000 pop. |
| State: | 7.37 / 10,000 pop. |
| Ripley County: | 9.5% |
| Missouri: | 8.8% |
| Ripley County: | 29.3% |
| State: | 29.6% |
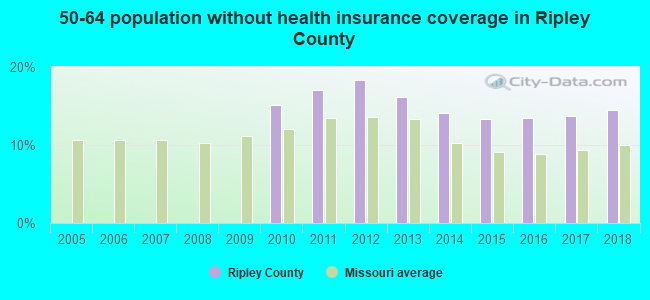
| Here: | 9.2% |
| State: | 13.5% |
Agriculture in Ripley County:
Average size of farms: 293 acresAverage value of agricultural products sold per farm: $20,187
Average value of crops sold per acre for harvested cropland: $133.55
The value of nursery, greenhouse, floriculture, and sod as a percentage of the total market value of agricultural products sold: 12.04%
The value of livestock, poultry, and their products as a percentage of the total market value of agricultural products sold: 52.32%
Average total farm production expenses per farm: $21,019
Harvested cropland as a percentage of land in farms: 24.57%
Irrigated harvested cropland as a percentage of land in farms: 20.45%
Average market value of all machinery and equipment per farm: $43,994
The percentage of farms operated by a family or individual: 93.93%
Average age of principal farm operators: 56 years
Average number of cattle and calves per 100 acres of all land in farms: 12.96
Milk cows as a percentage of all cattle and calves: 0.12%
Corn for grain: 1224 harvested acres
All wheat for grain: 1032 harvested acres
Soybeans for beans: 11644 harvested acres
Earthquake activity:
Ripley County-area historical earthquake activity is significantly above Missouri state average. It is 450% greater than the overall U.S. average.On 5/4/1991 at 01:18:54, a magnitude 5.0 (4.4 MB, 4.6 LG, 5.0 LG, Depth: 3.1 mi, Class: Moderate, Intensity: VI - VII) earthquake occurred 54.9 miles away from Ripley County center
On 3/25/1976 at 00:41:20, a magnitude 5.0 (4.9 MB, 5.0 LG) earthquake occurred 73.0 miles away from the county center
On 9/26/1990 at 13:18:51, a magnitude 5.0 (4.7 MB, 4.8 LG, 5.0 LG, Depth: 7.7 mi) earthquake occurred 80.1 miles away from the county center
On 4/18/2008 at 09:36:59, a magnitude 5.4 (5.1 MB, 4.8 MS, 5.4 MW, 5.2 MW) earthquake occurred 204.5 miles away from the county center
On 4/27/1989 at 16:47:49, a magnitude 4.7 (4.6 MB, 4.7 LG, 4.3 LG, Class: Light, Intensity: IV - V) earthquake occurred 71.8 miles away from Ripley County center
On 4/18/2008 at 09:36:59, a magnitude 5.2 (5.2 MW, Depth: 8.9 mi) earthquake occurred 204.5 miles away from the county center
Magnitude types: regional Lg-wave magnitude (LG), body-wave magnitude (MB), surface-wave magnitude (MS), moment magnitude (MW)
Most recent natural disasters:
- Missouri Severe Storms, Tornadoes, Straight-line Winds, And Flooding, Incident Period: May 3, 2020 - May 4, 2020, Major Disaster (Presidential) Declared DR-4552-MO: July 9, 2020, FEMA Id: 4552, Natural disaster type: Storm, Tornado, Flood, Wind
- Missouri Covid-19 Pandemic, Incident Period: January 20, 2020, FEMA Id: 4490, Natural disaster type: Other
- Missouri Severe Storms, Tornadoes, Straight-line Winds, And Flooding, Incident Period: April 28, 2017 - May 11, 2017, FEMA Id: 4317, Natural disaster type: Storm, Tornado, Flood, Wind
- Missouri Severe Storms, Tornadoes, Straight-line Winds, and Flooding, Incident Period: December 22, 2015 to January 09, 2016, Emergency Declared EM-3374: January 02, 2016, FEMA Id: 3374, Natural disaster type: Storm, Tornado, Flood, Wind
- Missouri Severe Storms, Tornadoes, and Flooding, Incident Period: April 19, 2011 to June 06, 2011, Major Disaster (Presidential) Declared DR-1980: May 09, 2011, FEMA Id: 1980, Natural disaster type: Storm, Tornado, Flood
- Missouri Severe Winter Storm, Incident Period: January 31, 2011 to February 05, 2011, Emergency Declared EM-3317: February 03, 2011, FEMA Id: 3317, Natural disaster type: Winter Storm
- Missouri Severe Storms, Tornadoes, and Flooding, Incident Period: May 08, 2009 to May 16, 2009, Major Disaster (Presidential) Declared DR-1847: June 19, 2009, FEMA Id: 1847, Natural disaster type: Storm, Tornado, Flood
- Missouri Severe Winter Storm, Incident Period: January 26, 2009 to January 28, 2009, Major Disaster (Presidential) Declared DR-1822: February 17, 2009, FEMA Id: 1822, Natural disaster type: Winter Storm
- Missouri Severe Winter Storm, Incident Period: January 26, 2009 to January 28, 2009, Emergency Declared EM-3303: January 30, 2009, FEMA Id: 3303, Natural disaster type: Winter Storm
- Missouri Severe Storms, Flooding, and a Tornado, Incident Period: September 11, 2008 to September 24, 2008, Major Disaster (Presidential) Declared DR-1809: November 13, 2008, FEMA Id: 1809, Natural disaster type: Storm, Tornado, Flood
- 8 other natural disasters have been reported since 1953.
The number of natural disasters in Ripley County (18) is near the US average (15).
Major Disasters (Presidential) Declared: 10
Emergencies Declared: 6
Causes of natural disasters: Floods: 10, Storms: 10, Tornadoes: 9, Winter Storms: 4, Winds: 3, Drought: 1, Heavy Rain: 1, Hurricane: 1, Other: 1 (Note: some incidents may be assigned to more than one category).
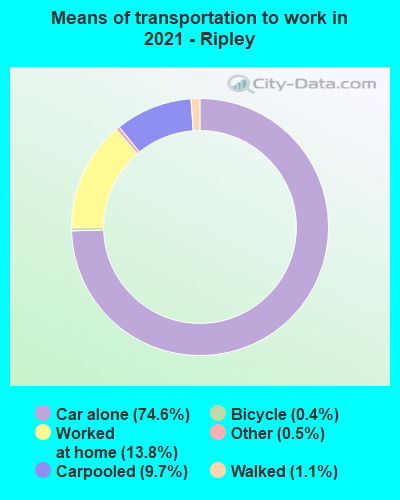
Means of transportation to work:
- Drove a car alone: 2,042 (71.9%)
- Carpooled: 243 (8.6%)
- Taxicab, motorcycle, or other means: 8 (0.3%)
- Bicycle: 10 (0.4%)
- Walked: 33 (1.2%)
- Worked at home: 560 (19.7%)
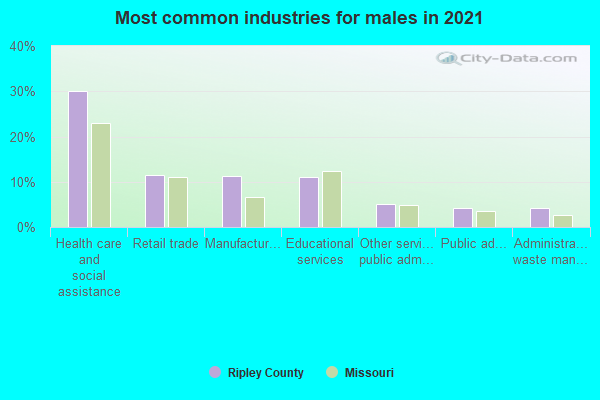
- Health care and social assistance (31%)
- Retail trade (11%)
- Educational services (9%)
- Manufacturing (8%)
- Accommodation and food services (6%)
- Other services, except public administration (6%)
- Finance and insurance (5%)
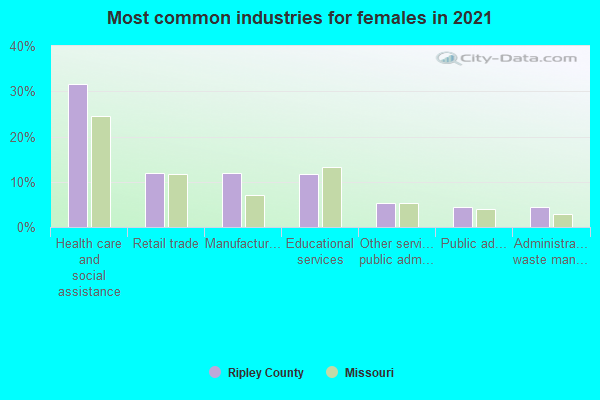
- Health care and social assistance (33%)
- Retail trade (12%)
- Educational services (10%)
- Manufacturing (8%)
- Accommodation and food services (6%)
- Other services, except public administration (6%)
- Finance and insurance (5%)
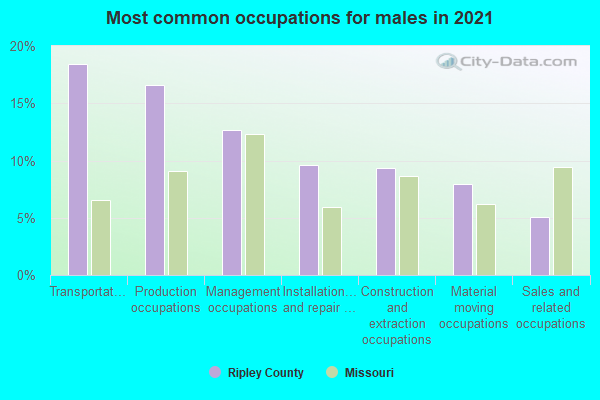
- Transportation occupations (14%)
- Management occupations (14%)
- Production occupations (13%)
- Installation, maintenance, and repair occupations (12%)
- Construction and extraction occupations (10%)
- Material moving occupations (7%)
- Sales and related occupations (5%)
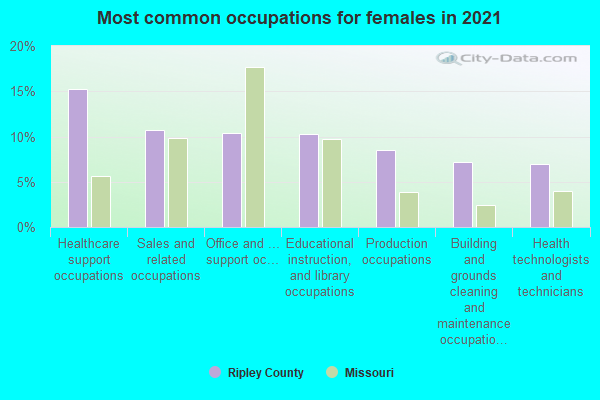
- Healthcare support occupations (17%)
- Sales and related occupations (13%)
- Office and administrative support occupations (9%)
- Educational instruction, and library occupations (8%)
- Management occupations (8%)
- Production occupations (7%)
- Building and grounds cleaning and maintenance occupations (7%)
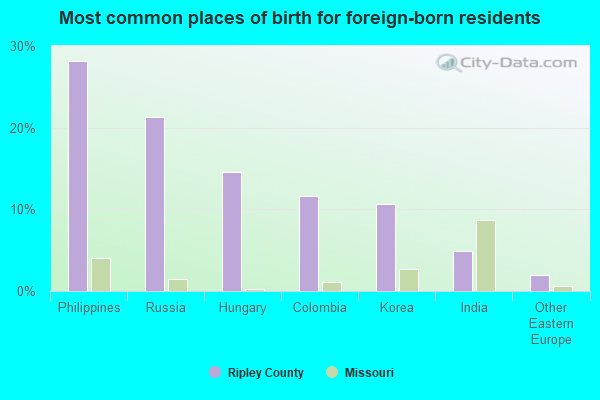
- Philippines (61%)
- Russia (16%)
- Hungary (9%)
- Korea (3%)
- Colombia (2%)
- India (1%)
- Poland (1%)
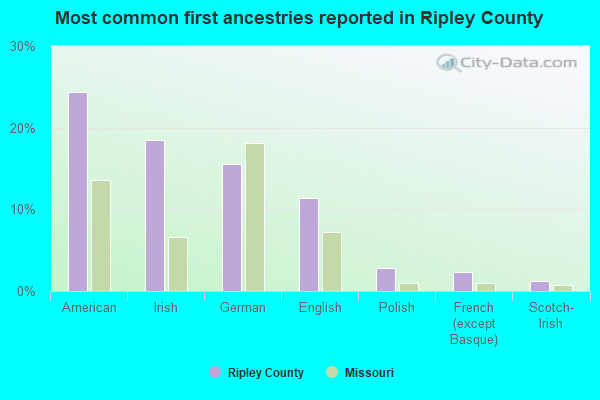
- American (34%)
- German (20%)
- Irish (11%)
- English (10%)
- Polish (1%)
- European (1%)
- Scotch-Irish (1%)
3 people in other noninstitutional facilities
People in group quarters in Ripley County, Missouri in 2000:
- 127 people in nursing homes
- 14 people in other noninstitutional group quarters
- 11 people in local jails and other confinement facilities (including police lockups)
- 6 people in other nonhousehold living situations
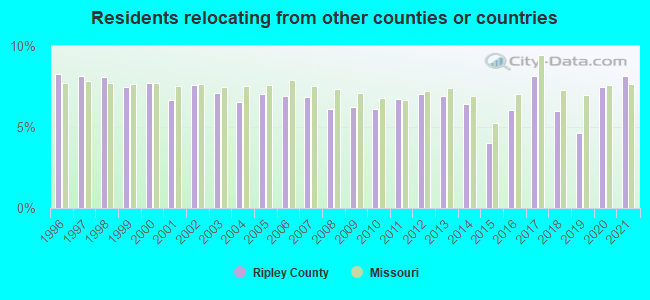
8.16% of this county's 2021 resident taxpayers lived in other counties in 2020 ($36,970 average adjusted gross income)
| Here: | 8.16% |
| Missouri average: | 7.67% |
10 or fewer of this county's residents moved from foreign countries.
4.72% relocated from other counties in Missouri ($18,786 average AGI)
3.44% relocated from other states ($18,184 average AGI)
Ripley County: 3.44% Missouri average: 3.04%
Top counties from which taxpayers relocated into this county between 2020 and 2021:
| from Butler County, MO |
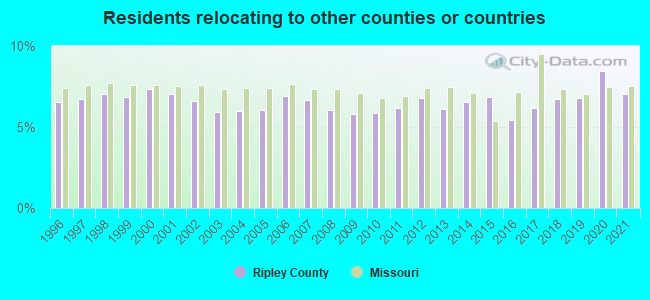
7.04% of this county's 2020 resident taxpayers moved to other counties in 2021 ($30,042 average adjusted gross income)
| Here: | 7.04% |
| Missouri average: | 7.51% |
10 or fewer of this county's residents moved to foreign countries.
4.83% relocated to other counties in Missouri ($19,596 average AGI)
2.21% relocated to other states ($10,446 average AGI)
Ripley County: 2.21% Missouri average: 2.88%
Top counties to which taxpayers relocated from this county between 2020 and 2021:
| to Butler County, MO |
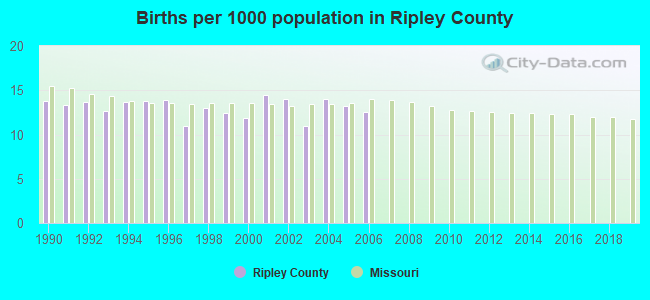
Births per 1000 population from 1990 to 1999: 13.1
Births per 1000 population from 2000 to 2006: 13.0
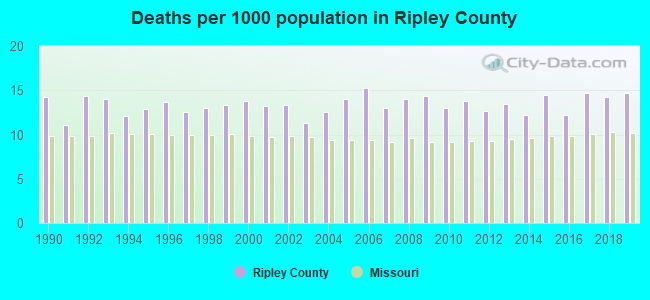
Deaths per 1000 population from 1990 to 1999: 13.1
Deaths per 1000 population from 2000 to 2009: 13.5
Deaths per 1000 population from 2010 to 2020: 13.8
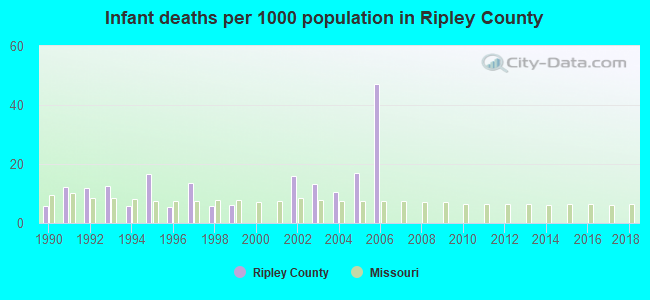
Infant deaths per 1000 live births from 1990 to 1999: 9.5
Infant deaths per 1000 live births from 2000 to 2006: 14.8
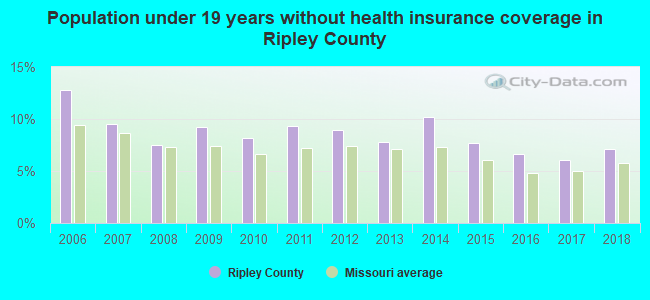
Persons under 19 years old without health insurance coverage in 2018: 7.1%

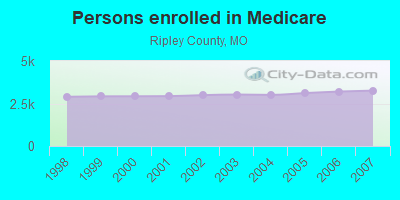
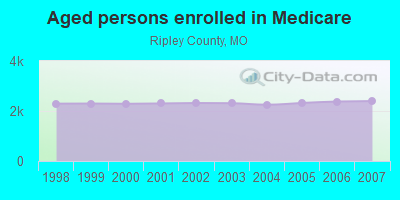
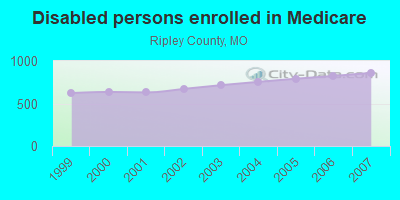
Persons enrolled in hospital insurance and/or supplemental medical insurance (Medicare) in July 1, 2007: 3,257 (2,397 aged, 860 disabled)
Children under 18 without health insurance coverage in 2007: 277 (9%)
Most common underlying causes of death in Ripley County, Missouri in 1999 - 2019:
- Acute myocardial infarction, unspecified (565)
- Bronchus or lung, unspecified - Malignant neoplasms (265)
- Atherosclerotic heart disease (115)
- Chronic obstructive pulmonary disease, unspecified (102)
- Stroke, not specified as haemorrhage or infarction (60)
- Pneumonia, unspecified (38)
- Cardiac arrest, unspecified (32)
- Congestive heart failure (32)
- Chronic obstructive pulmonary disease with acute lower respiratory infection (13)
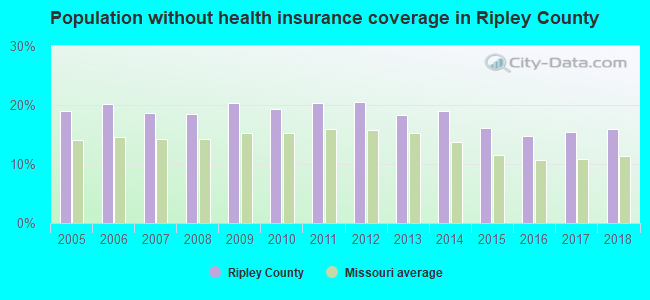
Population without health insurance coverage in 2000: 20%
Children under 18 without health insurance coverage in 2000: 17%
Short term general hospital admissions per 100,000 population in 2004: 6,489
Short term general hospital beds per 100,000 population in 2004: 195
Emergency room visits per 100,000 population in 2004: 45,336
General practice office based MDs per 100,000 population in 2005: 1,379
Medical specialist MDs per 100,000 population in 2005: 1,220
Dentists per 100,000 population in 1998: 29
Total births per 100,000 population, July 2005 - July 2006 : 14
Total deaths per 100,000 population, July 2005 - July 2006: 43
Limited-service eating places per 100,000 population in 2005 : 7
Crimes per 100,000 population in 1996: 1
Household type by relationship:
Households: 10,880- Male householders: 1,951 (483 living alone), Female householders: 2,086 (623 living alone)
2,101 spouses (2,101 opposite-sex spouses), 209 unmarried partners, (209 opposite-sex unmarried partners), 3,201 children (2,871 natural, 185 adopted, 135 stepchildren), 428 grandchildren, 161 brothers or sisters, 144 parents, 18 foster children, 186 other relatives, 276 non-relatives
- In group quarters: 72
Size of family households: 1,381 2-persons, 526 3-persons, 487 4-persons, 186 5-persons, 102 6-persons, 41 7-or-more-persons.
Size of nonfamily households: 1,107 1-person, 196 2-persons, 5 4-persons.
1,524 married couples with children.
530 single-parent households (318 men, 212 women).
98.7% of residents of Ripley speak English at home.
0.4% of residents speak other Indo-European language at home (100% speak English very well).
0.7% of residents speak Asian or Pacific Island language at home (96% speak English very well, 4% speak English well).
0.1% of residents speak other language at home (100% speak English very well).
In fiscal year 2004:
Federal Government expenditure: $111,174,000 ($8,033 per capita)
Department of Defense expenditure: $3,691,000
Federal direct payments to individuals for retirement and disability: $46,356,000
Federal other direct payments to individuals: $21,543,000
Federal direct payments not to individuals: $1,418,000
Federal grants: $37,493,000
Federal procurement contracts: $1,448,000 ($1,013,000 Department of Defense)
Federal salaries and wages: $2,917,000 ($102,000 Department of Defense)
Federal Government direct loans: $274,000
Federal guaranteed/insured loans: $5,079,000
Federal Government insurance: $6,467,000
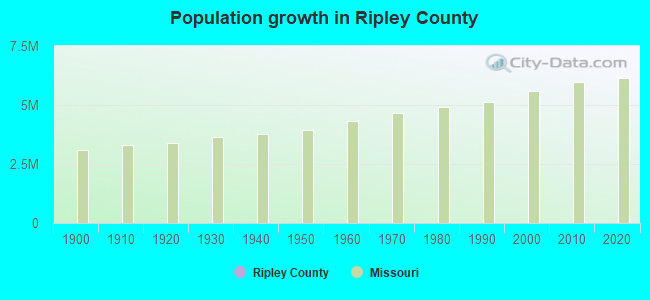
Population change from April 1, 2000 to July 1, 2005:
Births: 884| Here: | 64 per 1000 residents |
| State: | 69 per 1000 residents |
Deaths: 860
| Here: | 62 per 1000 residents |
| State: | 49 per 1000 residents |
Net international migration: +4
| Here: | +0 per 1000 residents |
| State: | +7 per 1000 residents |
Net internal migration: +348
| Here: | +25 per 1000 residents |
| State: | +5 per 1000 residents |
Total withdrawal of fresh water for public supply: 0.85 millions of gallons per day (all from ground)
| Here: | 5.7 |
| State: | 6.4 |
| Here: | 5.1 |
| State: | 4.4 |
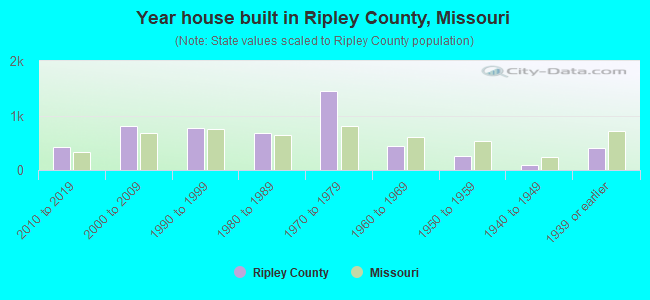
- Year house built in Ripley County, Missouri
- 342020 or later
- 4022010 to 2019
- 8162000 to 2009
- 8351990 to 1999
- 6971980 to 1989
- 1,2251970 to 1979
- 4331960 to 1969
- 2421950 to 1959
- 1161940 to 1949
- 4061939 or earlier
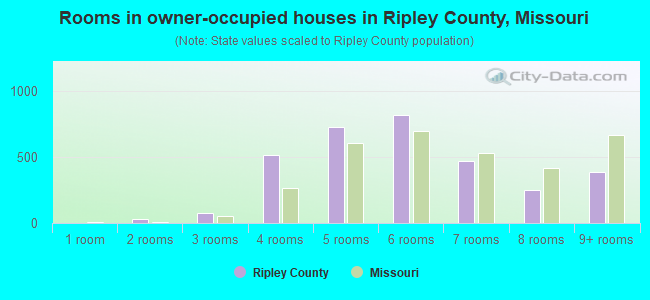
- Rooms in owner-occupied houses in Ripley County, Missouri
- 01 room
- 142 rooms
- 763 rooms
- 4354 rooms
- 7505 rooms
- 1,0016 rooms
- 3357 rooms
- 2448 rooms
- 3669+ rooms
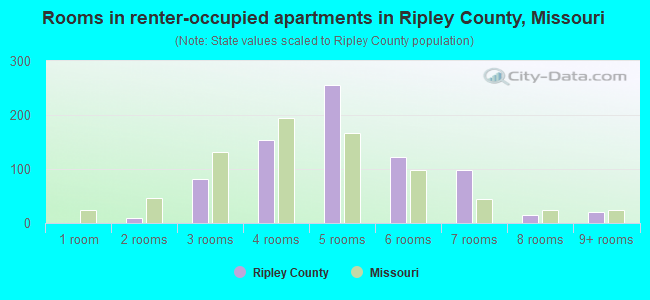
- Rooms in renter-occupied apartments in Ripley County, Missouri
- 01 room
- 122 rooms
- 603 rooms
- 1624 rooms
- 2885 rooms
- 1356 rooms
- 957 rooms
- 368 rooms
- 249+ rooms
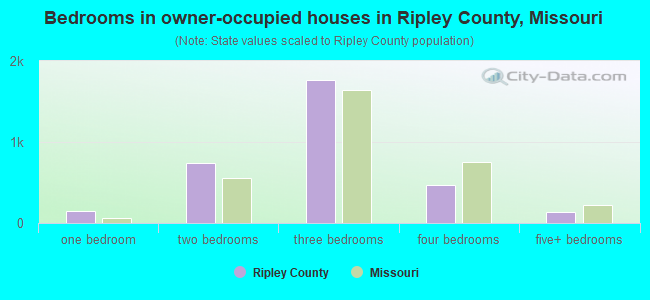
- Bedrooms in owner-occupied houses in Ripley County, Missouri
- 0no bedroom
- 1361 bedroom
- 6992 bedrooms
- 1,7923 bedrooms
- 4694 bedrooms
- 1095+ bedrooms
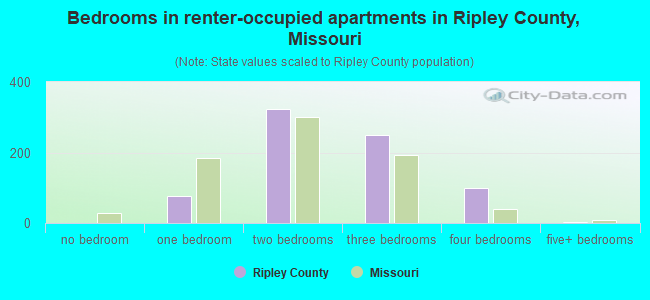
- Bedrooms in renter-occupied apartments in Ripley County, Missouri
- 0no bedroom
- 811 bedroom
- 2992 bedrooms
- 3153 bedrooms
- 1094 bedrooms
- 145+ bedrooms
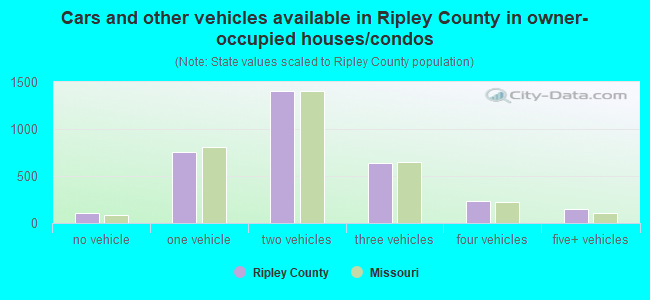
- Cars and other vehicles available in Ripley County in owner-occupied houses/condos
- 67no vehicle
- 7561 vehicle
- 1,4282 vehicles
- 5993 vehicles
- 2244 vehicles
- 1405+ vehicles
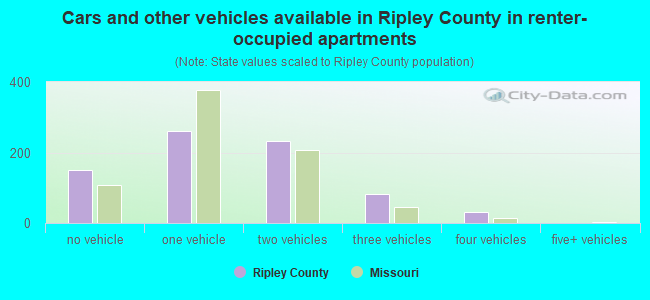
- Cars and other vehicles available in Ripley County in renter-occupied apartments
- 136no vehicle
- 3371 vehicle
- 2512 vehicles
- 923 vehicles
- 24 vehicles
- 05+ vehicles
86.4% of Ripley County residents lived in the same house 1 years ago.
Out of people who lived in different houses, 37% lived in this county.
Out of people who lived in different counties, 63% lived in Missouri.
| Ripley County: | 86.4% |
| State average: | 87.1% |
Place of birth for U.S.-born residents:
- This state: 7,102
- Other state: 3,598
- Northeast: 214
- Midwest: 1,128
- South: 1,708
- West: 540
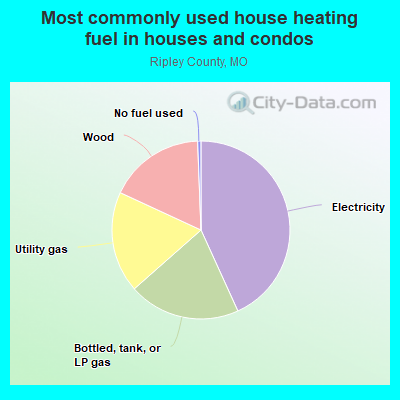
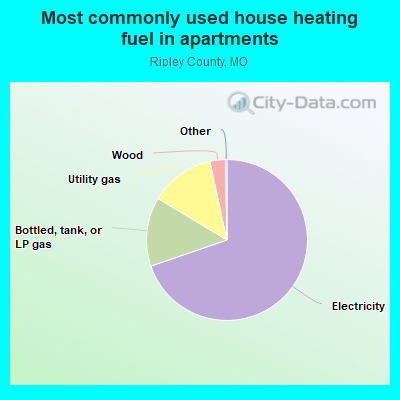
- 47.2%Electricity
- 20.4%Bottled, tank, or LP gas
- 17.7%Utility gas
- 14.2%Wood
- 0.5%No fuel used
- 72.8%Electricity
- 15.7%Bottled, tank, or LP gas
- 7.2%Utility gas
- 4.2%Wood
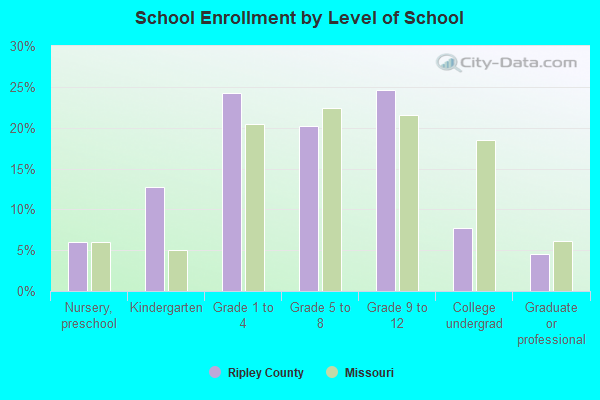
Private vs. public school enrollment:
| Here: | 8.6% |
| Missouri: | 15.4% |
| Here: | 15.1% |
| Missouri: | 13.9% |
| Here: | 26.1% |
| Missouri: | 22.6% |
Ripley County government finances - Expenditure in 2017:
- Charges - Other: $1,001,000
Parks and Recreation: $414,000
- Current Operations - Correctional Institutions: $2,756,000
Regular Highways: $1,945,000
Police Protection: $1,507,000
General - Other: $850,000
Parks and Recreation: $665,000
Central Staff Services: $624,000
Financial Administration: $577,000
Judicial and Legal Services: $452,000
Health - Other: $336,000
Public Welfare - Other: $267,000
General Public Buildings: $74,000
- General - Interest on Debt: $190,000
- Long Term Debt - Beginning Outstanding - Unspecified Public Purpose: $7,877,000
Outstanding Unspecified Public Purpose: $6,952,000
Retired Unspecified Public Purpose: $925,000
- Miscellaneous - General Revenue - Other: $347,000
Interest Earnings: $255,000
- Other Capital Outlay - General - Other: $623,000
- Other Funds - Cash and Securities: $3,631,000
- State Intergovernmental - General Local Government Support: $3,738,000
Highways: $1,012,000
Other: $512,000
Health and Hospitals: $68,000
- Tax - General Sales and Gross Receipts: $2,919,000
Property: $1,922,000
Ripley County government finances - Revenue in 2017:
- Charges - Other: $1,001,000
Parks and Recreation: $414,000
- Current Operations - Correctional Institutions: $2,756,000
Regular Highways: $1,945,000
Police Protection: $1,507,000
General - Other: $850,000
Parks and Recreation: $665,000
Central Staff Services: $624,000
Financial Administration: $577,000
Judicial and Legal Services: $452,000
Health - Other: $336,000
Public Welfare - Other: $267,000
General Public Buildings: $74,000
- General - Interest on Debt: $190,000
- Long Term Debt - Beginning Outstanding - Unspecified Public Purpose: $7,877,000
Outstanding Unspecified Public Purpose: $6,952,000
Retired Unspecified Public Purpose: $925,000
- Miscellaneous - General Revenue - Other: $347,000
Interest Earnings: $255,000
- Other Capital Outlay - General - Other: $623,000
- Other Funds - Cash and Securities: $3,631,000
- State Intergovernmental - General Local Government Support: $3,738,000
Highways: $1,012,000
Other: $512,000
Health and Hospitals: $68,000
- Tax - General Sales and Gross Receipts: $2,919,000
Property: $1,922,000
Ripley County government finances - Debt in 2017:
- Charges - Other: $1,001,000
Parks and Recreation: $414,000
- Current Operations - Correctional Institutions: $2,756,000
Regular Highways: $1,945,000
Police Protection: $1,507,000
General - Other: $850,000
Parks and Recreation: $665,000
Central Staff Services: $624,000
Financial Administration: $577,000
Judicial and Legal Services: $452,000
Health - Other: $336,000
Public Welfare - Other: $267,000
General Public Buildings: $74,000
- General - Interest on Debt: $190,000
- Long Term Debt - Beginning Outstanding - Unspecified Public Purpose: $7,877,000
Outstanding Unspecified Public Purpose: $6,952,000
Retired Unspecified Public Purpose: $925,000
- Miscellaneous - General Revenue - Other: $347,000
Interest Earnings: $255,000
- Other Capital Outlay - General - Other: $623,000
- Other Funds - Cash and Securities: $3,631,000
- State Intergovernmental - General Local Government Support: $3,738,000
Highways: $1,012,000
Other: $512,000
Health and Hospitals: $68,000
- Tax - General Sales and Gross Receipts: $2,919,000
Property: $1,922,000
Ripley County government finances - Cash and Securities in 2017:
- Charges - Other: $1,001,000
Parks and Recreation: $414,000
- Current Operations - Correctional Institutions: $2,756,000
Regular Highways: $1,945,000
Police Protection: $1,507,000
General - Other: $850,000
Parks and Recreation: $665,000
Central Staff Services: $624,000
Financial Administration: $577,000
Judicial and Legal Services: $452,000
Health - Other: $336,000
Public Welfare - Other: $267,000
General Public Buildings: $74,000
- General - Interest on Debt: $190,000
- Long Term Debt - Beginning Outstanding - Unspecified Public Purpose: $7,877,000
Outstanding Unspecified Public Purpose: $6,952,000
Retired Unspecified Public Purpose: $925,000
- Miscellaneous - General Revenue - Other: $347,000
Interest Earnings: $255,000
- Other Capital Outlay - General - Other: $623,000
- Other Funds - Cash and Securities: $3,631,000
- State Intergovernmental - General Local Government Support: $3,738,000
Highways: $1,012,000
Other: $512,000
Health and Hospitals: $68,000
- Tax - General Sales and Gross Receipts: $2,919,000
Property: $1,922,000
Supplemental Security Income (SSI) in 2006:
- Total number of recipients: 856
- Number of aged recipients: 78
- Number of blind and disabled recipients: 778
- Number of recipients under 18: 70
- Number of recipients between 18 and 64: 602
- Number of recipients older than 64: 184
- Number of recipients also receiving OASDI: 360
- Amount of payments (thousands of dollars): 368
| Most common first names in Ripley County, MO among deceased individuals | ||
| Name | Count | Lived (average) |
|---|---|---|
| William | 127 | 76.6 years |
| Mary | 120 | 77.0 years |
| James | 120 | 73.1 years |
| John | 119 | 76.7 years |
| Charles | 82 | 70.9 years |
| Robert | 73 | 73.5 years |
| George | 49 | 72.6 years |
| Roy | 41 | 73.4 years |
| Joseph | 38 | 78.4 years |
| Walter | 33 | 72.8 years |
| Most common last names in Ripley County, MO among deceased individuals | ||
| Last name | Count | Lived (average) |
|---|---|---|
| Smith | 63 | 77.1 years |
| Johnson | 47 | 73.2 years |
| Miller | 46 | 78.5 years |
| Thompson | 37 | 74.6 years |
| Payne | 31 | 77.3 years |
| Jones | 30 | 68.9 years |
| Brooks | 29 | 71.8 years |
| Davis | 28 | 73.1 years |
| Adams | 26 | 74.4 years |
| Moore | 26 | 73.8 years |
| Businesses in Ripley County, MO | ||||
| Name | Count | Name | Count | |
|---|---|---|---|---|
| Chevrolet | 1 | RadioShack | 1 | |
| Days Inn | 1 | SONIC Drive-In | 1 | |
| FedEx | 1 | Subway | 1 | |
| Ford | 1 | True Value | 1 | |
| H&R Block | 1 | U-Haul | 1 | |
| McDonald's | 1 | U.S. Cellular | 1 | |
Ripley County on our top lists:
- #82 on the list of "Top 101 counties with the smallest number of children under 18 without health insurance coverage in 2000"