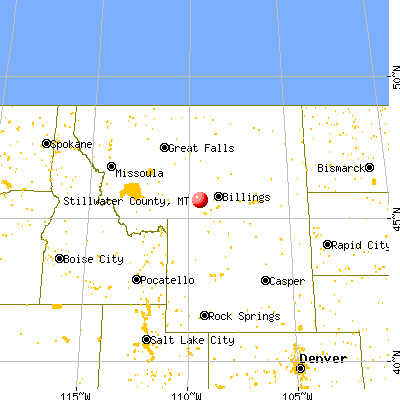
Stillwater County, Montana (MT)
County owner-occupied free and clear houses and condos in 2010: 1,183
County owner-occupied houses and condos in 2000: 2,457
Renter-occupied apartments: 836 (it was 777 in 2000)
| % of renters here: | 24% |
| State: | 32% |
Land area: 1795 sq. mi.
Water area: 9.5 sq. mi.
Population density: 5 people per square mile (very low).
Industries providing employment: Agriculture,forestry,fishing and hunting, and mining (24.1%), Educational, health and social services (18.1%).
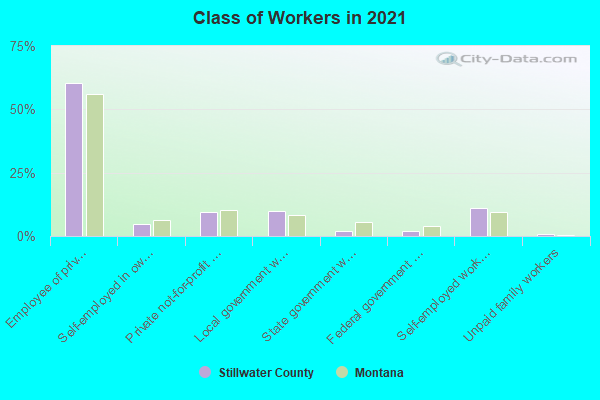
Type of workers:
- Private wage or salary: 75%
- Government: 15%
- Self-employed, not incorporated: 9%
- Unpaid family work: 1%
- OSM Map
- General Map
- Google Map
- MSN Map

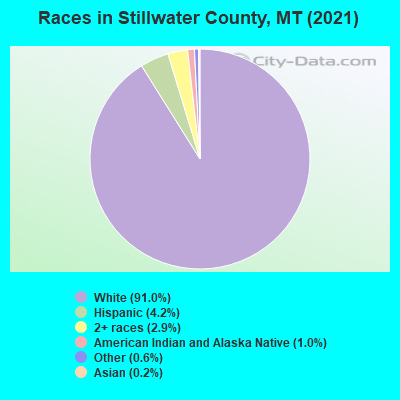
- 8,35890.6%White Non-Hispanic Alone
- 4114.5%Hispanic or Latino
- 3373.7%Two or more races
- 540.6%Some other race alone
- 340.4%American Indian and Alaska Native alone
- 300.3%Asian alone
- 50.05%Black Non-Hispanic Alone
| Median resident age: | 48.1 years |
| Montana median age: | 40.2 years |
| Males: 4,671 | |
| Females: 4,562 |


| Stillwater County: | 2.0 people |
| Montana: | 2 people |
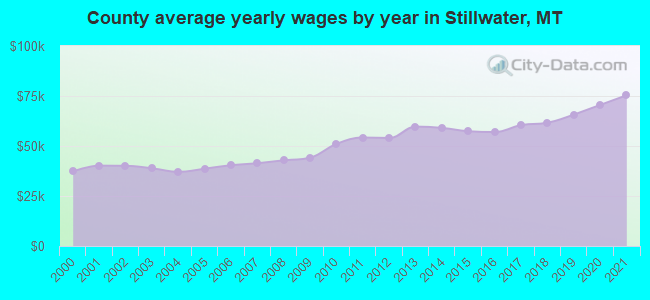
Estimated median household income in 2022: $79,904 ($39,205 in 1999)
| This county: | $79,904 |
| Montana: | $67,631 |
Median contract rent in 2022 for apartments: $748 (lower quartile is $548, upper quartile is $956)
| This county: | $748 |
| State: | $871 |
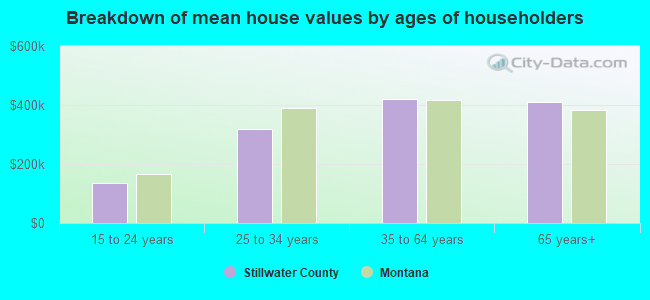
Estimated median house or condo value in 2022: $378,985 (it was $103,200 in 2000)
| Stillwater: | $378,985 |
| Montana: | $366,400 |
Median monthly housing costs for homes and condos with a mortgage: $1,684
Median monthly housing costs for units without a mortgage: $493
Institutionalized population: 47
Crime in 2021 (reported by the sheriff's office or county police, not the county total):
- Murders: 0
- Rapes: 3
- Robberies: 0
- Assaults: 16
- Burglaries: 23
- Thefts: 52
- Auto thefts: 7
Crime in 2020 (reported by the sheriff's office or county police, not the county total):
- Murders: 0
- Rapes: 3
- Robberies: 0
- Assaults: 22
- Burglaries: 12
- Thefts: 31
- Auto thefts: 7
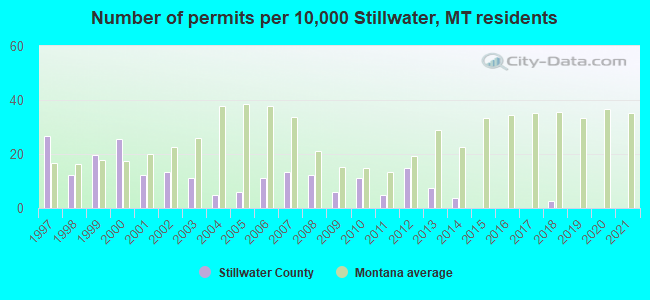
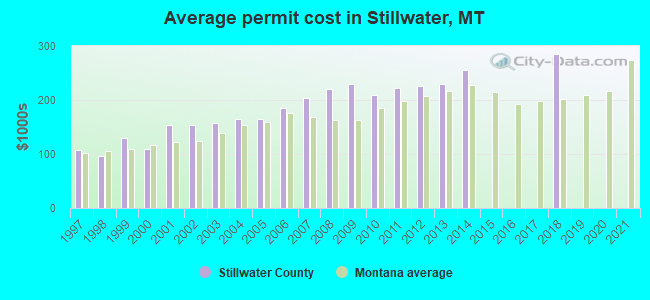
Single-family new house construction building permits:
- 2022: 0 buildings
- 2021: 0 buildings
- 2020: 0 buildings
- 2019: 0 buildings
- 2018: 2 buildings, average cost: $285,200
- 2017: 0 buildings
- 2016: 0 buildings
- 2015: 0 buildings
- 2014: 3 buildings, average cost: $255,200
- 2013: 6 buildings, average cost: $229,000
- 2012: 12 buildings, average cost: $225,100
- 2011: 4 buildings, average cost: $222,100
- 2010: 9 buildings, average cost: $209,100
- 2009: 5 buildings, average cost: $229,000
- 2008: 10 buildings, average cost: $219,800
- 2007: 11 buildings, average cost: $202,600
- 2006: 9 buildings, average cost: $186,300
- 2005: 5 buildings, average cost: $163,700
- 2004: 4 buildings, average cost: $163,700
- 2003: 9 buildings, average cost: $157,800
- 2002: 11 buildings, average cost: $152,700
- 2001: 10 buildings, average cost: $152,700
- 2000: 21 buildings, average cost: $108,600
- 1999: 16 buildings, average cost: $129,100
- 1998: 10 buildings, average cost: $96,000
- 1997: 22 buildings, average cost: $107,200
Median real estate property taxes paid for housing units with mortgages in 2022: $2,284 (0.6%)
Median real estate property taxes paid for housing units with no mortgage in 2022: $1,929 (0.5%)


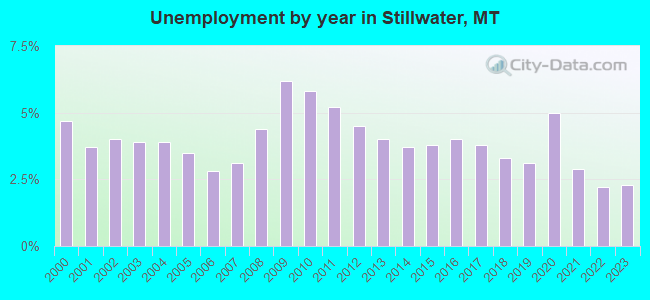
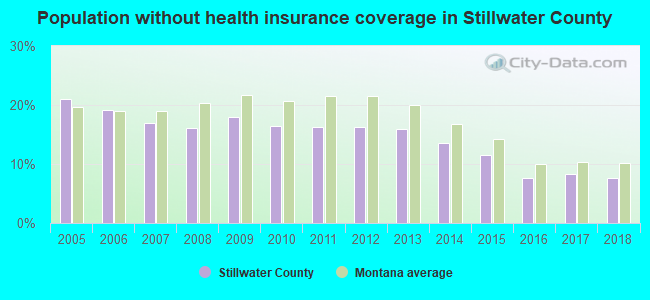
| Stillwater County: | 7.8% |
| Montana: | 12.1% |
Median age of residents in 2022: 48.1 years old
(Males: 48.1 years old, Females: 47.7 years old)
(Median age for: White residents: 48.8 years old, American Indian residents: 74.1 years old, Asian residents: 55.0 years old, Hispanic or Latino residents: 27.1 years old, Other race residents: 30.2 years old)
Fair market rent in 2006 for a 1-bedroom apartment in Stillwater County is $424 a month.
Fair market rent for a 2-bedroom apartment is $503 a month.
Fair market rent for a 3-bedroom apartment is $678 a month.
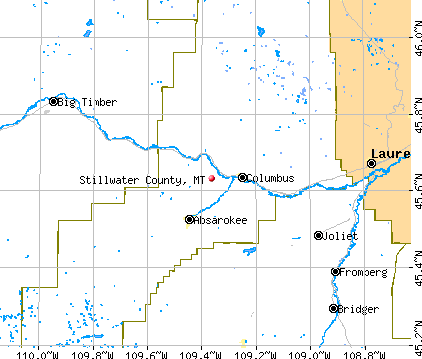
Cities in this county include: Columbus, Absarokee, Park City, North Stillwater, Reed Point.
Neighboring counties: Big Horn County  , Benton County, Washington
  , Charlevoix County, Michigan , Hettinger County, North Dakota , Grant County, Minnesota , Stevens County, Minnesota .
| Here: | 3.0% |
| Montana: | 3.8% |
Current college students: 138
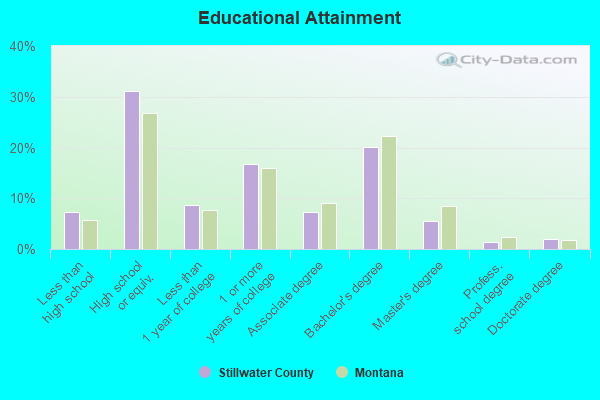
People 25 years of age or older with a high school degree or higher: 92.9%
People 25 years of age or older with a bachelor's degree or higher: 29.3%
Number of foreign born residents: 119 (72.2% naturalized citizens)
| Stillwater County: | 1.3% |
| Whole state: | 2.3% |
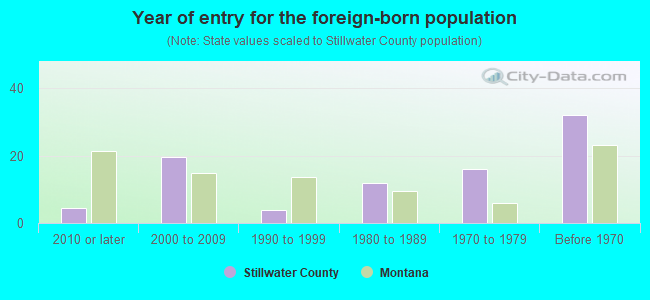
- Year of entry for the foreign-born population
- 72010 or later
- 212000 to 2009
- 111990 to 1999
- 121980 to 1989
- 161970 to 1979
- 32Before 1970
Mean travel time to work (commute): minutes
Percentage of county residents living and working in this county: 97.3%

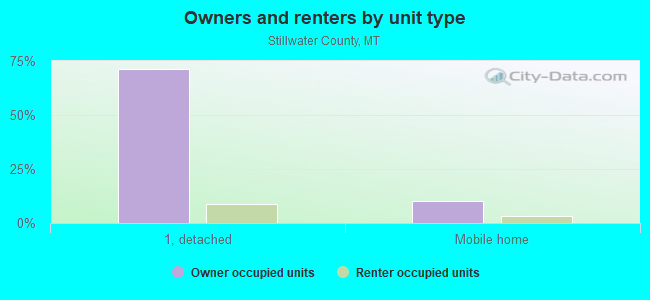
Housing units in structures:
- One, detached: 3,904
- One, attached: 100
- Two: 42
- 3 or 4: 85
- 5 to 9: 46
- 20 or more: 21
- Mobile homes: 507
- Boats, RVs, vans, etc.: 5
Housing units in Stillwater County with a mortgage: 1,808 (81 second mortgage, 8 home equity loan, 62 both second mortgage and home equity loan)
Houses without a mortgage: 43
| Here: | 2.3% with mortgage |
| State: | 97.4% with mortgage |
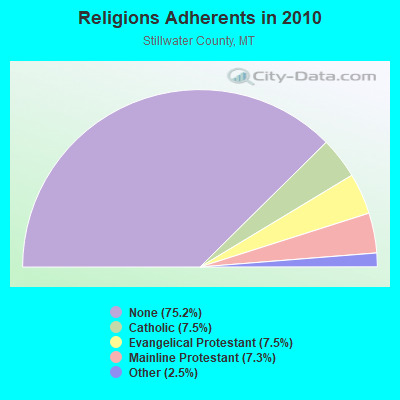
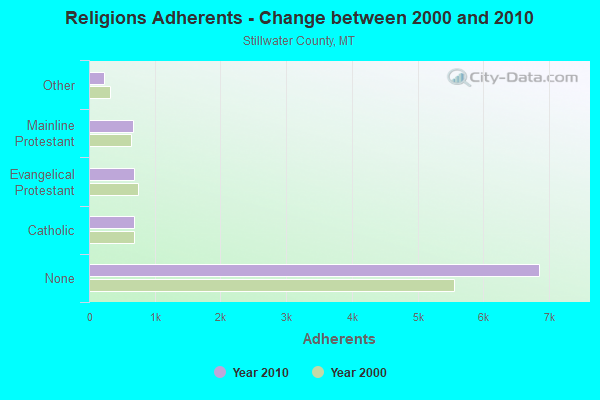
Religion statistics for Stillwater County
| Religion | Adherents | Congregations |
|---|---|---|
| Catholic | 688 | 2 |
| Evangelical Protestant | 682 | 10 |
| Mainline Protestant | 665 | 7 |
| Other | 229 | 2 |
| None | 6,853 | - |
Source: Clifford Grammich, Kirk Hadaway, Richard Houseal, Dale E.Jones, Alexei Krindatch, Richie Stanley and Richard H.Taylor. 2012. 2010 U.S.Religion Census: Religious Congregations & Membership Study. Association of Statisticians of American Religious Bodies. Jones, Dale E., et al. 2002. Congregations and Membership in the United States 2000. Nashville, TN: Glenmary Research Center.
Food Environment Statistics:
| Stillwater County: | 3.48 / 10,000 pop. |
| State: | 2.55 / 10,000 pop. |
| Stillwater County: | 9.27 / 10,000 pop. |
| Montana: | 4.69 / 10,000 pop. |
| This county: | 10.43 / 10,000 pop. |
| State: | 10.38 / 10,000 pop. |
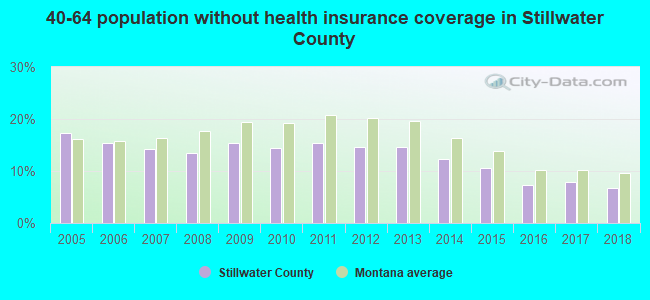
| Stillwater County: | 7.0% |
| Montana: | 7.2% |
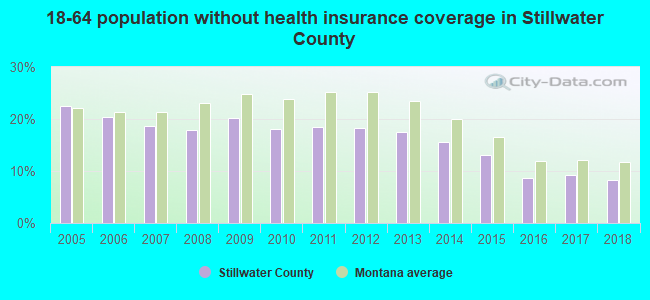
| Stillwater County: | 22.7% |
| State: | 23.1% |
Agriculture in Stillwater County:
Average size of farms: 1613 acresAverage value of agricultural products sold per farm: $52,788
Average value of crops sold per acre for harvested cropland: $42.19
The value of livestock, poultry, and their products as a percentage of the total market value of agricultural products sold: 87.15%
Average total farm production expenses per farm: $56,574
Harvested cropland as a percentage of land in farms: 9.97%
Irrigated harvested cropland as a percentage of land in farms: 20.25%
Average market value of all machinery and equipment per farm: $56,815
The percentage of farms operated by a family or individual: 80.80%
Average age of principal farm operators: 56 years
Average number of cattle and calves per 100 acres of all land in farms: 5.26
Milk cows as a percentage of all cattle and calves: 0.23%
Corn for grain: 454 harvested acres
All wheat for grain: 25202 harvested acres
Earthquake activity:
Stillwater County-area historical earthquake activity is significantly above Montana state average. It is 787% greater than the overall U.S. average.On 8/18/1959 at 06:37:13, a magnitude 7.7 (7.7 UK, Class: Major, Intensity: VIII - XII) earthquake occurred 96.8 miles away from Stillwater County center, causing $26,000,000 total damage
On 10/28/1983 at 14:06:06, a magnitude 7.3 (6.2 MB, 7.3 MS, 7.0 MW) earthquake occurred 242.5 miles away from the county center, causing 2 deaths (2 shaking deaths) and 3 injuries, causing $15,000,000 total damage
On 6/30/1975 at 18:54:13, a magnitude 6.1 (5.6 MB, 5.9 MS, 6.1 UK, 6.1 ML, Class: Strong, Intensity: VII - IX) earthquake occurred 94.1 miles away from the county center
On 3/31/2020 at 23:52:30, a magnitude 6.5 (6.5 MW, Depth: 7.5 mi) earthquake occurred 292.3 miles away from the county center
On 7/6/2017 at 06:30:17, a magnitude 5.8 (5.8 MW, Depth: 7.6 mi, Class: Moderate, Intensity: VI - VII) earthquake occurred 176.2 miles away from Stillwater County center
On 7/26/2005 at 04:08:37, a magnitude 5.7 (5.7 MB, 5.2 MS, 5.6 MW) earthquake occurred 156.3 miles away from the county center
Magnitude types: body-wave magnitude (MB), local magnitude (ML), surface-wave magnitude (MS), moment magnitude (MW)
Most recent natural disasters:
- Montana Covid-19 Pandemic, Incident Period: January 20, 2020, FEMA Id: 4508, Natural disaster type: Other
- Montana Flooding, Incident Period: March 20, 2019 - April 10, 2019, FEMA Id: 4437, Natural disaster type: Flood
- Montana Ice Jams and Flooding, Incident Period: March 01, 2014 to March 17, 2014, Major Disaster (Presidential) Declared DR-4172: April 17, 2014, FEMA Id: 4172, Natural disaster type: Flood
- Montana Severe Storms and Flooding, Incident Period: April 04, 2011 to July 22, 2011, Major Disaster (Presidential) Declared DR-1996: June 17, 2011, FEMA Id: 1996, Natural disaster type: Storm, Flood
- Montana Eagle Mount Fire, Incident Period: September 03, 2009 to September 05, 2009, Fire Management Assistance Declared: September 04, 2009, FEMA Id: 2837, Natural disaster type: Fire
- Montana Derby Fire, Incident Period: August 30, 2006 to September 15, 2006, Fire Management Assistance Declared: August 30, 2006, FEMA Id: 2671, Natural disaster type: Fire
- Montana Saunders Fire, Incident Period: July 10, 2006 to July 13, 2006, Fire Management Assistance Declared: July 11, 2006, FEMA Id: 2652, Natural disaster type: Fire
- Montana Hurricane Katrina Evacuation, Incident Period: August 29, 2005 to October 01, 2005, Emergency Declared EM-3253: September 13, 2005, FEMA Id: 3253, Natural disaster type: Hurricane
- Montana Wildfires, Incident Period: July 13, 2000 to September 25, 2000, Major Disaster (Presidential) Declared DR-1340: August 30, 2000, FEMA Id: 1340, Natural disaster type: Fire
- Montana Severe Storms, Ice Jams, Snowmelt, Flooding, Extreme Soil Saturation, Incident Period: March 01, 1997 to August 06, 1997, Major Disaster (Presidential) Declared DR-1183: July 25, 1997, FEMA Id: 1183, Natural disaster type: Storm, Flood, Snow
- 1 other natural disasters have been reported since 1953.
The number of natural disasters in Stillwater County (11) is smaller than the US average (15).
Major Disasters (Presidential) Declared: 5
Emergencies Declared: 1
Causes of natural disasters: Floods: 5, Fires: 4, Storms: 3, Hurricane: 1, Snow: 1, Other: 1 (Note: some incidents may be assigned to more than one category).
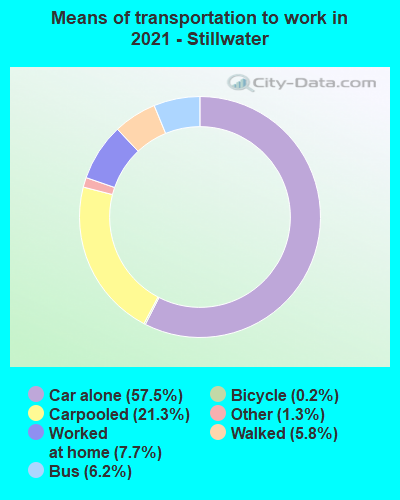
Means of transportation to work:
- Drove a car alone: 2,093 (51.0%)
- Carpooled: 1,121 (27.3%)
- Bus: 215 (5.2%)
- Taxicab, motorcycle, or other means: 76 (1.9%)
- Bicycle: 7 (0.2%)
- Walked: 269 (6.6%)
- Worked at home: 372 (9.1%)
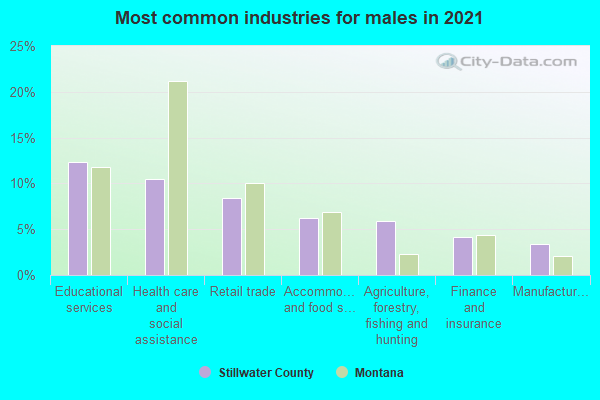
- Educational services (15%)
- Health care and social assistance (11%)
- Retail trade (10%)
- Accommodation and food services (6%)
- Finance and insurance (6%)
- Agriculture, forestry, fishing and hunting (5%)
- Administrative and support and waste management services (4%)
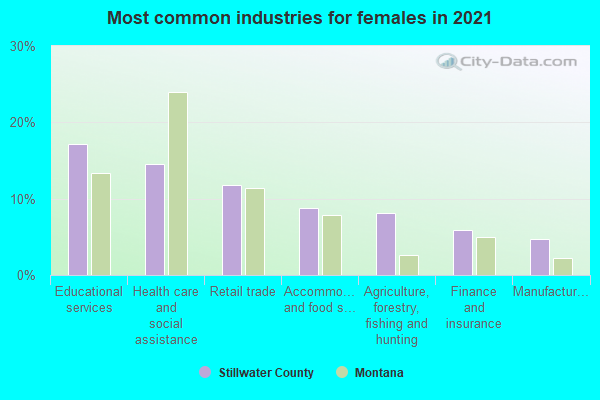
- Educational services (19%)
- Health care and social assistance (15%)
- Retail trade (13%)
- Accommodation and food services (8%)
- Finance and insurance (8%)
- Agriculture, forestry, fishing and hunting (7%)
- Administrative and support and waste management services (5%)

- Construction and extraction occupations (28%)
- Management occupations (10%)
- Installation, maintenance, and repair occupations (9%)
- Production occupations (8%)
- Transportation occupations (6%)
- Sales and related occupations (6%)
- Farming, fishing, and forestry occupations (4%)

- Management occupations (18%)
- Office and administrative support occupations (15%)
- Sales and related occupations (12%)
- Educational instruction, and library occupations (11%)
- Building and grounds cleaning and maintenance occupations (7%)
- Health diagnosing and treating practitioners and other technical occupations (5%)
- Food preparation and serving related occupations (5%)
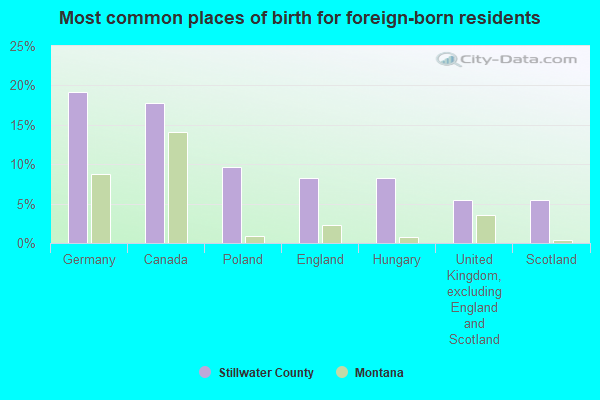
- Spain (38%)
- Germany (13%)
- Canada (9%)
- Hong Kong (6%)
- Poland (6%)
- Philippines (5%)
- Other Northern Europe (4%)

- German (24%)
- English (13%)
- American (9%)
- Irish (9%)
- Norwegian (9%)
- Scotch-Irish (3%)
- Scottish (3%)
People in group quarters in Stillwater County, Montana in 2010:
- 47 people in nursing facilities/skilled-nursing facilities
- 38 people in group homes intended for adults
- 27 people in other noninstitutional facilities
People in group quarters in Stillwater County, Montana in 2000:
- 75 people in nursing homes
- 74 people in other workers' dormitories
- 21 people in homes for the mentally retarded
- 2 people in wards in general hospitals for patients who have no usual home elsewhere
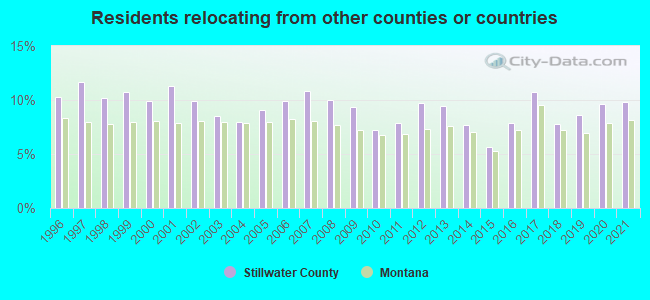
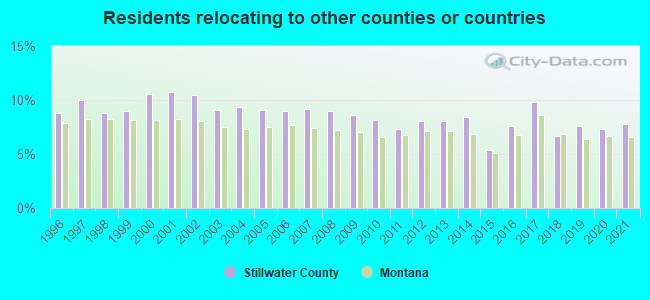
9.77% of this county's 2021 resident taxpayers lived in other counties in 2020 ($95,166 average adjusted gross income)
| Here: | 9.77% |
| Montana average: | 8.17% |
10 or fewer of this county's residents moved from foreign countries.
5.12% relocated from other counties in Montana ($56,139 average AGI)
4.66% relocated from other states ($39,029 average AGI)
Stillwater County: 4.66% Montana average: 5.13%
Top counties from which taxpayers relocated into this county between 2020 and 2021:
| from Yellowstone County, MT |
7.76% of this county's 2020 resident taxpayers moved to other counties in 2021 ($61,980 average adjusted gross income)
| Here: | 7.76% |
| Montana average: | 6.62% |
10 or fewer of this county's residents moved to foreign countries.
4.58% relocated to other counties in Montana ($35,685 average AGI)
3.18% relocated to other states ($26,295 average AGI)
Stillwater County: 3.18% Montana average: 3.54%
Top counties to which taxpayers relocated from this county between 2020 and 2021:
| to Yellowstone County, MT | |
| to Carbon County, MT |
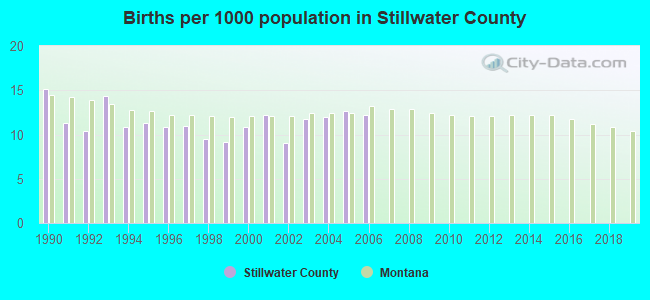
Births per 1000 population from 1990 to 1999: 11.4
Births per 1000 population from 2000 to 2006: 11.5
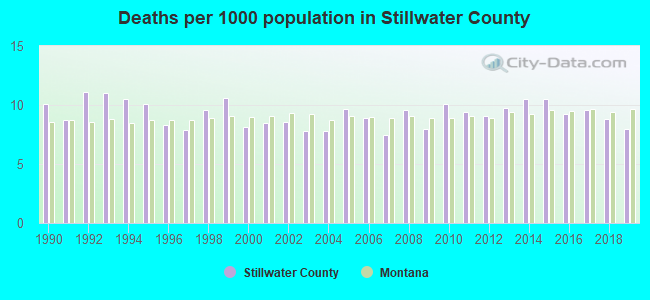
Deaths per 1000 population from 1990 to 1999: 9.8
Deaths per 1000 population from 2000 to 2009: 8.4
Deaths per 1000 population from 2010 to 2020: 9.6
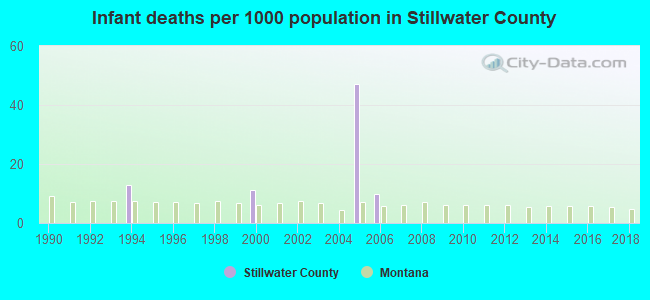
Infant deaths per 1000 live births from 1990 to 1999: 1.3
Infant deaths per 1000 live births from 2000 to 2006: 9.7
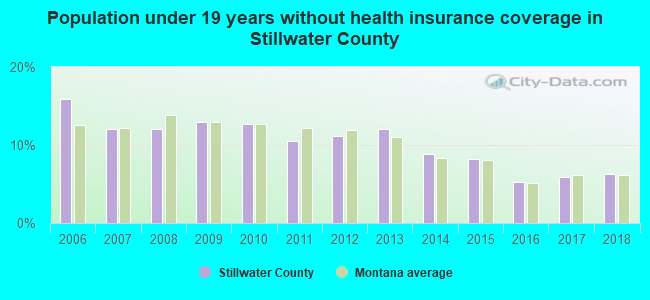
Persons under 19 years old without health insurance coverage in 2018: 6.3%

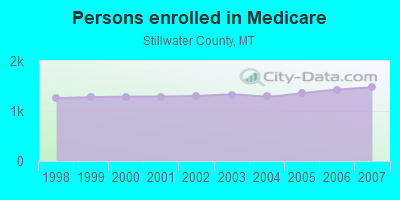
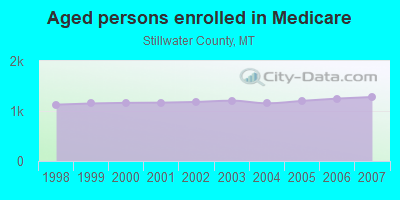
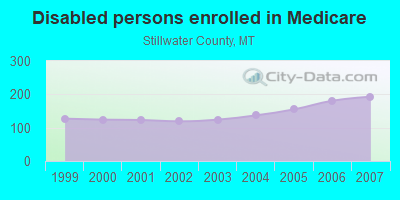
Persons enrolled in hospital insurance and/or supplemental medical insurance (Medicare) in July 1, 2007: 1,473 (1,280 aged, 193 disabled)
Children under 18 without health insurance coverage in 2007: 230 (12%)
Most common underlying causes of death in Stillwater County, Montana in 1999 - 2019:
- Acute myocardial infarction, unspecified (32)
- Chronic obstructive pulmonary disease, unspecified (21)
- Alzheimer disease, unspecified (12)
- Atherosclerotic heart disease (11)
Population without health insurance coverage in 2000: 14%
Children under 18 without health insurance coverage in 2000: 13%
Short term general hospital admissions per 100,000 population in 2004: 2,753
Short term general hospital beds per 100,000 population in 2004: 274
Emergency room visits per 100,000 population in 2004: 16,863
General practice office based MDs per 100,000 population in 2005: 1,236
Medical specialist MDs per 100,000 population in 2005: 1,036
Dentists per 100,000 population in 1998: 24
Total births per 100,000 population, July 2005 - July 2006 : 12
Total deaths per 100,000 population, July 2005 - July 2006: 71
Limited-service eating places per 100,000 population in 2005 : 24
Household type by relationship:
Households: 9,233- Male householders: 1,954 (575 living alone), Female householders: 2,018 (509 living alone)
2,345 spouses (2,336 opposite-sex spouses), 127 unmarried partners, (124 opposite-sex unmarried partners), 2,192 children (2,082 natural, 52 adopted, 53 stepchildren), 202 grandchildren, 46 brothers or sisters, 78 parents, 15 foster children, 64 other relatives, 59 non-relatives
- In group quarters: 125
Size of family households: 1,609 2-persons, 333 3-persons, 418 4-persons, 237 5-persons, 28 6-persons, 86 7-or-more-persons.
Size of nonfamily households: 1,085 1-person, 158 2-persons, 1 3-persons.
1,357 married couples with children.
315 single-parent households (64 men, 251 women).
98.2% of residents of Stillwater speak English at home.
0.3% of residents speak Spanish at home (68% speak English very well, 32% speak English well).
0.8% of residents speak other Indo-European language at home (91% speak English very well, 9% speak English well).
0.6% of residents speak Asian or Pacific Island language at home (81% speak English very well, 19% speak English not well).
0.1% of residents speak other language at home (100% speak English very well).
In fiscal year 2004:
Federal Government expenditure: $41,338,000 ($4,926 per capita)
Department of Defense expenditure: $1,190,000
Federal direct payments to individuals for retirement and disability: $20,811,000
Federal other direct payments to individuals: $7,055,000
Federal direct payments not to individuals: $5,525,000
Federal grants: $5,330,000
Federal procurement contracts: $866,000 ($122,000 Department of Defense)
Federal salaries and wages: $1,751,000 ($0,000 Department of Defense)
Federal Government direct loans: $319,000
Federal guaranteed/insured loans: $5,613,000
Federal Government insurance: $11,734,000
Population change from April 1, 2000 to July 1, 2005:
Births: 480| Here: | 57 per 1000 residents |
| State: | 62 per 1000 residents |
Deaths: 357
| Here: | 42 per 1000 residents |
| State: | 47 per 1000 residents |
Net international migration: +12
| Here: | +1 per 1000 residents |
| State: | +2 per 1000 residents |
Net internal migration: +173
| Here: | +20 per 1000 residents |
| State: | +20 per 1000 residents |
Total withdrawal of fresh water for public supply: 0.81 millions of gallons per day (all from ground)
| Here: | 6.2 |
| State: | 6.4 |
| Here: | 4.4 |
| State: | 4.2 |

- Year house built in Stillwater County, Montana
- 202020 or later
- 5822010 to 2019
- 9202000 to 2009
- 5881990 to 1999
- 6241980 to 1989
- 5931970 to 1979
- 2861960 to 1969
- 2621950 to 1959
- 2571940 to 1949
- 5761939 or earlier
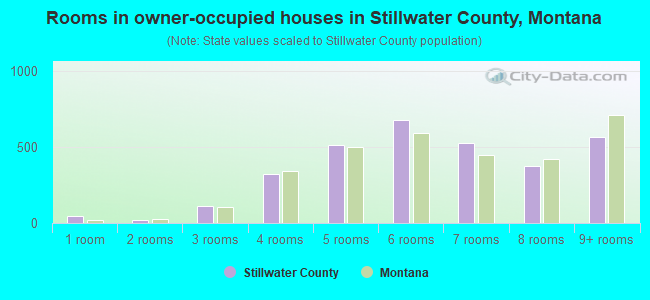
- Rooms in owner-occupied houses in Stillwater County, Montana
- 371 room
- 332 rooms
- 1163 rooms
- 4054 rooms
- 5455 rooms
- 6436 rooms
- 5657 rooms
- 3618 rooms
- 6179+ rooms
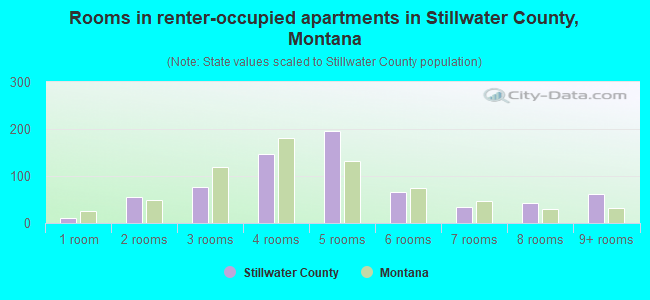
- Rooms in renter-occupied apartments in Stillwater County, Montana
- 161 room
- 742 rooms
- 583 rooms
- 1984 rooms
- 1315 rooms
- 486 rooms
- 317 rooms
- 388 rooms
- 649+ rooms

- Bedrooms in owner-occupied houses in Stillwater County, Montana
- 44no bedroom
- 911 bedroom
- 6992 bedrooms
- 1,4173 bedrooms
- 6634 bedrooms
- 3915+ bedrooms
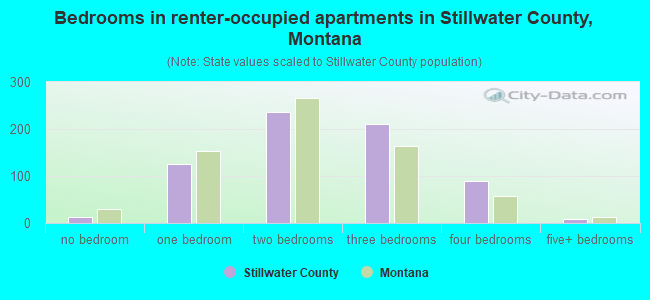
- Bedrooms in renter-occupied apartments in Stillwater County, Montana
- 18no bedroom
- 1331 bedroom
- 2202 bedrooms
- 1993 bedrooms
- 644 bedrooms
- 115+ bedrooms
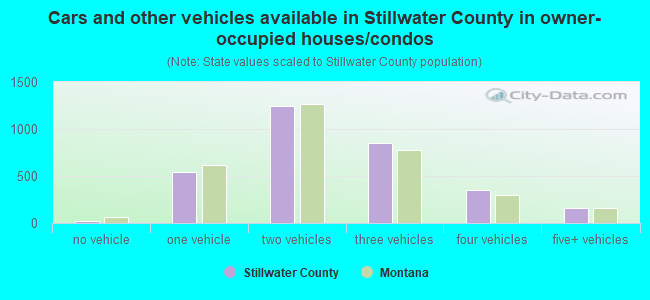
- Cars and other vehicles available in Stillwater County in owner-occupied houses/condos
- 71no vehicle
- 5631 vehicle
- 1,3642 vehicles
- 7663 vehicles
- 3614 vehicles
- 1905+ vehicles
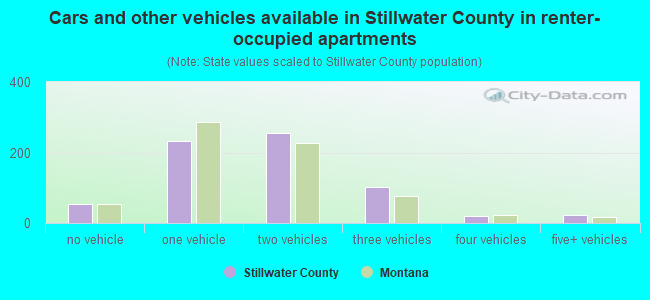
- Cars and other vehicles available in Stillwater County in renter-occupied apartments
- 54no vehicle
- 2461 vehicle
- 2002 vehicles
- 823 vehicles
- 244 vehicles
- 555+ vehicles
94.9% of Stillwater County residents lived in the same house 1 years ago.
Out of people who lived in different houses, 16% lived in this county.
Out of people who lived in different counties, 58% lived in Montana.
| Stillwater County: | 94.9% |
| State average: | 86.7% |
Place of birth for U.S.-born residents:
- This state: 4,499
- Other state: 4,612
- Northeast: 345
- Midwest: 1,245
- South: 674
- West: 2,354

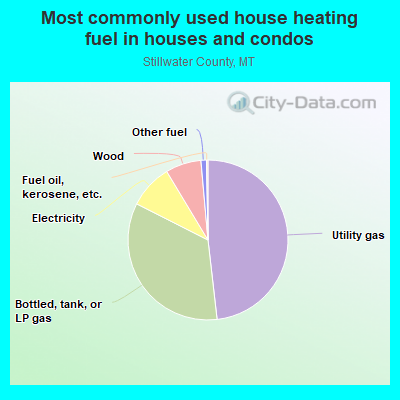
- 47.4%Utility gas
- 32.2%Bottled, tank, or LP gas
- 9.5%Electricity
- 7.2%Wood
- 1.9%Other fuel
- 1.5%Coal or coke
- 0.2%Solar energy
- 0.1%No fuel used

- 50.1%Utility gas
- 17.9%Electricity
- 15.5%Wood
- 15.0%Bottled, tank, or LP gas
- 1.0%Other fuel
- 0.5%Fuel oil, kerosene, etc.
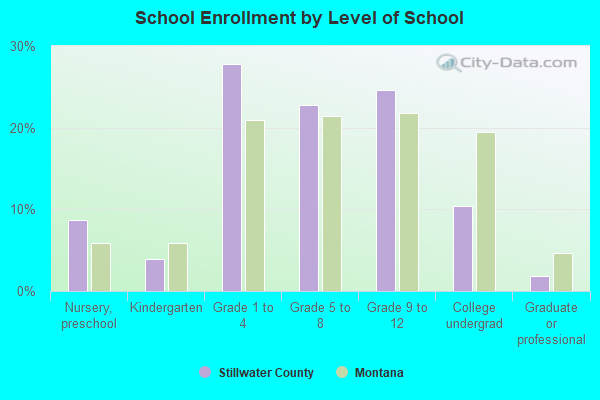
Private vs. public school enrollment:
| Here: | 19.8% |
| Montana: | 15.3% |
| Here: | 23.0% |
| Montana: | 12.2% |
| Here: | 14.2% |
| Montana: | 15.0% |

Stillwater County government finances - Expenditure in 2018:
- Charges - Other: $884,000
Other: $401,000
Solid Waste Management: $136,000
Solid Waste Management: $78,000
Air Transportation: $15,000
Air Transportation: $15,000
- Construction - Regular Highways: $2,225,000
Regular Highways: $1,059,000
- Current Operations - Regular Highways: $4,187,000
Regular Highways: $2,005,000
Police Protection: $1,862,000
Police Protection: $1,440,000
Central Staff Services: $1,280,000
Central Staff Services: $1,145,000
Judicial and Legal Services: $819,000
Judicial and Legal Services: $817,000
Solid Waste Management: $786,000
Financial Administration: $726,000
Solid Waste Management: $647,000
Health - Other: $602,000
Correctional Institutions: $430,000
General Public Buildings: $425,000
Financial Administration: $375,000
Natural Resources - Other: $373,000
General Public Buildings: $364,000
Correctional Institutions: $329,000
Natural Resources - Other: $297,000
Libraries: $192,000
Libraries: $183,000
Housing and Community Development: $178,000
Air Transportation: $142,000
Sewerage: $102,000
Health - Other: $101,000
Sewerage: $89,000
Local Fire Protection: $74,000
Parks and Recreation: $69,000
Local Fire Protection: $49,000
Elementary and Secondary Education: $47,000
Elementary and Secondary Education: $42,000
Corrections - Other: $32,000
Air Transportation: $26,000
Public Welfare - Other: $20,000
Parks and Recreation: $20,000
Public Welfare - Other: $10,000
- Federal Intergovernmental - General Local Government Support: $508,000
General Local Government Support: $475,000
Air Transportation: $175,000
Other: $76,000
Natural Resources: $15,000
Health and Hospitals: $13,000
- General - Interest on Debt: $148,000
Interest on Debt: $5,000
- Intergovernmental to Local - Other - Elementary and Secondary Education: $1,707,000
Other - Elementary and Secondary Education: $1,700,000
- Local Intergovernmental - Other: $7,000
- Long Term Debt - Outstanding Unspecified Public Purpose: $2,170,000
Issue, Unspecified Public Purpose: $2,070,000
Beginning Outstanding - Unspecified Public Purpose: $1,587,000
Retired Unspecified Public Purpose: $1,487,000
Beginning Outstanding - Unspecified Public Purpose: $119,000
Outstanding Unspecified Public Purpose: $60,000
Retired Unspecified Public Purpose: $59,000
- Miscellaneous - Sale of Property: $1,130,000
Special Assessments: $786,000
Special Assessments: $583,000
Interest Earnings: $454,000
Interest Earnings: $222,000
Fines and Forfeits: $141,000
Fines and Forfeits: $123,000
General Revenue - Other: $61,000
Sale of Property: $50,000
General Revenue - Other: $48,000
- Other Capital Outlay - Regular Highways: $454,000
General Public Building: $305,000
General Public Building: $185,000
Police Protection: $85,000
Regular Highways: $72,000
Police Protection: $42,000
- Other Funds - Cash and Securities: $38,320,000
Cash and Securities: $31,109,000
- State Intergovernmental - Other: $1,334,000
General Local Government Support: $1,006,000
General Local Government Support: $985,000
Highways: $309,000
Other: $309,000
Highways: $104,000
Health and Hospitals: $39,000
Health and Hospitals: $2,000
- Tax - Property: $9,176,000
Property: $7,811,000
Other License: $33,000
Other License: $30,000
- Total Salaries and Wages: $4,290,000
: $3,918,000
Stillwater County government finances - Revenue in 2018:
- Charges - Other: $884,000
Other: $401,000
Solid Waste Management: $136,000
Solid Waste Management: $78,000
Air Transportation: $15,000
Air Transportation: $15,000
- Construction - Regular Highways: $2,225,000
Regular Highways: $1,059,000
- Current Operations - Regular Highways: $4,187,000
Regular Highways: $2,005,000
Police Protection: $1,862,000
Police Protection: $1,440,000
Central Staff Services: $1,280,000
Central Staff Services: $1,145,000
Judicial and Legal Services: $819,000
Judicial and Legal Services: $817,000
Solid Waste Management: $786,000
Financial Administration: $726,000
Solid Waste Management: $647,000
Health - Other: $602,000
Correctional Institutions: $430,000
General Public Buildings: $425,000
Financial Administration: $375,000
Natural Resources - Other: $373,000
General Public Buildings: $364,000
Correctional Institutions: $329,000
Natural Resources - Other: $297,000
Libraries: $192,000
Libraries: $183,000
Housing and Community Development: $178,000
Air Transportation: $142,000
Sewerage: $102,000
Health - Other: $101,000
Sewerage: $89,000
Local Fire Protection: $74,000
Parks and Recreation: $69,000
Local Fire Protection: $49,000
Elementary and Secondary Education: $47,000
Elementary and Secondary Education: $42,000
Corrections - Other: $32,000
Air Transportation: $26,000
Public Welfare - Other: $20,000
Parks and Recreation: $20,000
Public Welfare - Other: $10,000
- Federal Intergovernmental - General Local Government Support: $508,000
General Local Government Support: $475,000
Air Transportation: $175,000
Other: $76,000
Natural Resources: $15,000
Health and Hospitals: $13,000
- General - Interest on Debt: $148,000
Interest on Debt: $5,000
- Intergovernmental to Local - Other - Elementary and Secondary Education: $1,707,000
Other - Elementary and Secondary Education: $1,700,000
- Local Intergovernmental - Other: $7,000
- Long Term Debt - Outstanding Unspecified Public Purpose: $2,170,000
Issue, Unspecified Public Purpose: $2,070,000
Beginning Outstanding - Unspecified Public Purpose: $1,587,000
Retired Unspecified Public Purpose: $1,487,000
Beginning Outstanding - Unspecified Public Purpose: $119,000
Outstanding Unspecified Public Purpose: $60,000
Retired Unspecified Public Purpose: $59,000
- Miscellaneous - Sale of Property: $1,130,000
Special Assessments: $786,000
Special Assessments: $583,000
Interest Earnings: $454,000
Interest Earnings: $222,000
Fines and Forfeits: $141,000
Fines and Forfeits: $123,000
General Revenue - Other: $61,000
Sale of Property: $50,000
General Revenue - Other: $48,000
- Other Capital Outlay - Regular Highways: $454,000
General Public Building: $305,000
General Public Building: $185,000
Police Protection: $85,000
Regular Highways: $72,000
Police Protection: $42,000
- Other Funds - Cash and Securities: $38,320,000
Cash and Securities: $31,109,000
- State Intergovernmental - Other: $1,334,000
General Local Government Support: $1,006,000
General Local Government Support: $985,000
Highways: $309,000
Other: $309,000
Highways: $104,000
Health and Hospitals: $39,000
Health and Hospitals: $2,000
- Tax - Property: $9,176,000
Property: $7,811,000
Other License: $33,000
Other License: $30,000
- Total Salaries and Wages: $4,290,000
: $3,918,000
Stillwater County government finances - Debt in 2018:
- Charges - Other: $884,000
Other: $401,000
Solid Waste Management: $136,000
Solid Waste Management: $78,000
Air Transportation: $15,000
Air Transportation: $15,000
- Construction - Regular Highways: $2,225,000
Regular Highways: $1,059,000
- Current Operations - Regular Highways: $4,187,000
Regular Highways: $2,005,000
Police Protection: $1,862,000
Police Protection: $1,440,000
Central Staff Services: $1,280,000
Central Staff Services: $1,145,000
Judicial and Legal Services: $819,000
Judicial and Legal Services: $817,000
Solid Waste Management: $786,000
Financial Administration: $726,000
Solid Waste Management: $647,000
Health - Other: $602,000
Correctional Institutions: $430,000
General Public Buildings: $425,000
Financial Administration: $375,000
Natural Resources - Other: $373,000
General Public Buildings: $364,000
Correctional Institutions: $329,000
Natural Resources - Other: $297,000
Libraries: $192,000
Libraries: $183,000
Housing and Community Development: $178,000
Air Transportation: $142,000
Sewerage: $102,000
Health - Other: $101,000
Sewerage: $89,000
Local Fire Protection: $74,000
Parks and Recreation: $69,000
Local Fire Protection: $49,000
Elementary and Secondary Education: $47,000
Elementary and Secondary Education: $42,000
Corrections - Other: $32,000
Air Transportation: $26,000
Public Welfare - Other: $20,000
Parks and Recreation: $20,000
Public Welfare - Other: $10,000
- Federal Intergovernmental - General Local Government Support: $508,000
General Local Government Support: $475,000
Air Transportation: $175,000
Other: $76,000
Natural Resources: $15,000
Health and Hospitals: $13,000
- General - Interest on Debt: $148,000
Interest on Debt: $5,000
- Intergovernmental to Local - Other - Elementary and Secondary Education: $1,707,000
Other - Elementary and Secondary Education: $1,700,000
- Local Intergovernmental - Other: $7,000
- Long Term Debt - Outstanding Unspecified Public Purpose: $2,170,000
Issue, Unspecified Public Purpose: $2,070,000
Beginning Outstanding - Unspecified Public Purpose: $1,587,000
Retired Unspecified Public Purpose: $1,487,000
Beginning Outstanding - Unspecified Public Purpose: $119,000
Outstanding Unspecified Public Purpose: $60,000
Retired Unspecified Public Purpose: $59,000
- Miscellaneous - Sale of Property: $1,130,000
Special Assessments: $786,000
Special Assessments: $583,000
Interest Earnings: $454,000
Interest Earnings: $222,000
Fines and Forfeits: $141,000
Fines and Forfeits: $123,000
General Revenue - Other: $61,000
Sale of Property: $50,000
General Revenue - Other: $48,000
- Other Capital Outlay - Regular Highways: $454,000
General Public Building: $305,000
General Public Building: $185,000
Police Protection: $85,000
Regular Highways: $72,000
Police Protection: $42,000
- Other Funds - Cash and Securities: $38,320,000
Cash and Securities: $31,109,000
- State Intergovernmental - Other: $1,334,000
General Local Government Support: $1,006,000
General Local Government Support: $985,000
Highways: $309,000
Other: $309,000
Highways: $104,000
Health and Hospitals: $39,000
Health and Hospitals: $2,000
- Tax - Property: $9,176,000
Property: $7,811,000
Other License: $33,000
Other License: $30,000
- Total Salaries and Wages: $4,290,000
: $3,918,000
Stillwater County government finances - Cash and Securities in 2018:
- Charges - Other: $884,000
Other: $401,000
Solid Waste Management: $136,000
Solid Waste Management: $78,000
Air Transportation: $15,000
Air Transportation: $15,000
- Construction - Regular Highways: $2,225,000
Regular Highways: $1,059,000
- Current Operations - Regular Highways: $4,187,000
Regular Highways: $2,005,000
Police Protection: $1,862,000
Police Protection: $1,440,000
Central Staff Services: $1,280,000
Central Staff Services: $1,145,000
Judicial and Legal Services: $819,000
Judicial and Legal Services: $817,000
Solid Waste Management: $786,000
Financial Administration: $726,000
Solid Waste Management: $647,000
Health - Other: $602,000
Correctional Institutions: $430,000
General Public Buildings: $425,000
Financial Administration: $375,000
Natural Resources - Other: $373,000
General Public Buildings: $364,000
Correctional Institutions: $329,000
Natural Resources - Other: $297,000
Libraries: $192,000
Libraries: $183,000
Housing and Community Development: $178,000
Air Transportation: $142,000
Sewerage: $102,000
Health - Other: $101,000
Sewerage: $89,000
Local Fire Protection: $74,000
Parks and Recreation: $69,000
Local Fire Protection: $49,000
Elementary and Secondary Education: $47,000
Elementary and Secondary Education: $42,000
Corrections - Other: $32,000
Air Transportation: $26,000
Public Welfare - Other: $20,000
Parks and Recreation: $20,000
Public Welfare - Other: $10,000
- Federal Intergovernmental - General Local Government Support: $508,000
General Local Government Support: $475,000
Air Transportation: $175,000
Other: $76,000
Natural Resources: $15,000
Health and Hospitals: $13,000
- General - Interest on Debt: $148,000
Interest on Debt: $5,000
- Intergovernmental to Local - Other - Elementary and Secondary Education: $1,707,000
Other - Elementary and Secondary Education: $1,700,000
- Local Intergovernmental - Other: $7,000
- Long Term Debt - Outstanding Unspecified Public Purpose: $2,170,000
Issue, Unspecified Public Purpose: $2,070,000
Beginning Outstanding - Unspecified Public Purpose: $1,587,000
Retired Unspecified Public Purpose: $1,487,000
Beginning Outstanding - Unspecified Public Purpose: $119,000
Outstanding Unspecified Public Purpose: $60,000
Retired Unspecified Public Purpose: $59,000
- Miscellaneous - Sale of Property: $1,130,000
Special Assessments: $786,000
Special Assessments: $583,000
Interest Earnings: $454,000
Interest Earnings: $222,000
Fines and Forfeits: $141,000
Fines and Forfeits: $123,000
General Revenue - Other: $61,000
Sale of Property: $50,000
General Revenue - Other: $48,000
- Other Capital Outlay - Regular Highways: $454,000
General Public Building: $305,000
General Public Building: $185,000
Police Protection: $85,000
Regular Highways: $72,000
Police Protection: $42,000
- Other Funds - Cash and Securities: $38,320,000
Cash and Securities: $31,109,000
- State Intergovernmental - Other: $1,334,000
General Local Government Support: $1,006,000
General Local Government Support: $985,000
Highways: $309,000
Other: $309,000
Highways: $104,000
Health and Hospitals: $39,000
Health and Hospitals: $2,000
- Tax - Property: $9,176,000
Property: $7,811,000
Other License: $33,000
Other License: $30,000
- Total Salaries and Wages: $4,290,000
: $3,918,000
Supplemental Security Income (SSI) in 2006:
- Total number of recipients: 75
- Number of aged recipients: 8
- Number of blind and disabled recipients: 67
- Number of recipients under 18: 6
- Number of recipients between 18 and 64: 56
- Number of recipients older than 64: 13
- Number of recipients also receiving OASDI: 43
- Amount of payments (thousands of dollars): 31
| Most common first names in Stillwater County, MT among deceased individuals | ||
| Name | Count | Lived (average) |
|---|---|---|
| John | 48 | 76.1 years |
| William | 40 | 75.4 years |
| Mary | 31 | 83.0 years |
| Robert | 29 | 75.8 years |
| George | 23 | 77.5 years |
| Charles | 23 | 79.6 years |
| Margaret | 22 | 80.1 years |
| Dorothy | 20 | 81.0 years |
| James | 19 | 75.1 years |
| Elizabeth | 19 | 81.6 years |
| Most common last names in Stillwater County, MT among deceased individuals | ||
| Last name | Count | Lived (average) |
|---|---|---|
| Johnson | 20 | 75.1 years |
| Kober | 19 | 73.2 years |
| Smith | 15 | 74.2 years |
| Anderson | 14 | 81.6 years |
| Brown | 13 | 81.8 years |
| Jensen | 12 | 78.8 years |
| Nelson | 12 | 68.3 years |
| Arthun | 12 | 78.3 years |
| Peterson | 12 | 79.1 years |
| Scott | 10 | 86.0 years |
| Businesses in Stillwater County, MT | ||||
| Name | Count | Name | Count | |
|---|---|---|---|---|
| Ace Hardware | 1 | Subway | 1 | |
| FedEx | 1 | Super 8 | 1 | |
| Ford | 1 | U-Haul | 1 | |
| McDonald's | 1 | |||