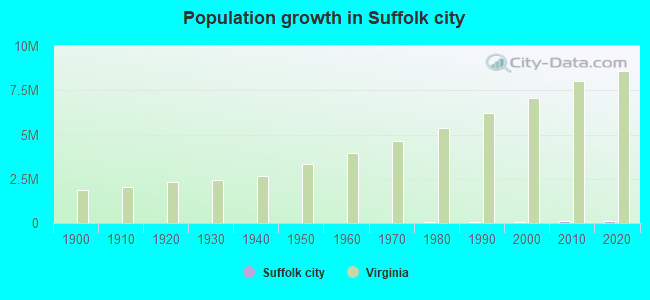
Suffolk city, Virginia (VA)
County owner-occupied free and clear houses and condos in 2010: 4,568
County owner-occupied houses and condos in 2000: 16,814
Renter-occupied apartments: 8,396 (it was 6,469 in 2000)
| % of renters here: | 28% |
| State: | 33% |
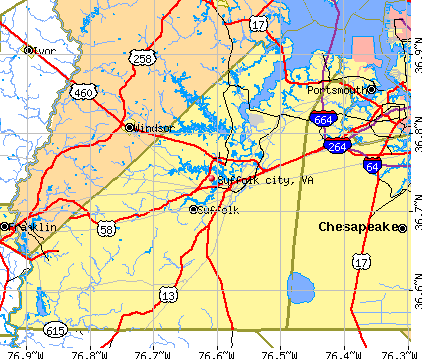
Land area: 400 sq. mi.
Water area: 29.0 sq. mi.
Population density: 246 people per square mile (high).
Industries providing employment: Educational, health and social services (23.6%), Manufacturing (12.7%), Professional, scientific, management, administrative, and waste management services (11.8%).
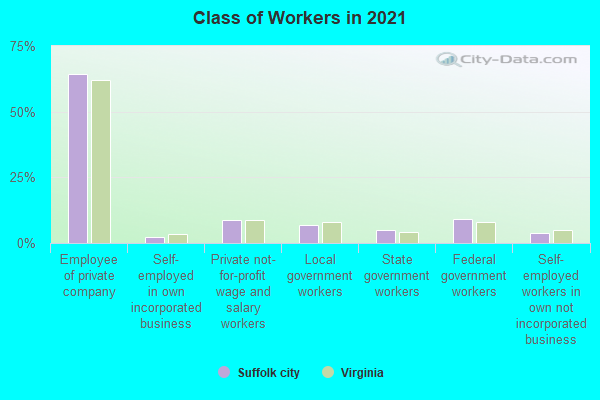
Type of workers:
- Private wage or salary: 69%
- Government: 28%
- Self-employed, not incorporated: 3%
- Unpaid family work: 0%
- OSM Map
- General Map
- Google Map
- MSN Map

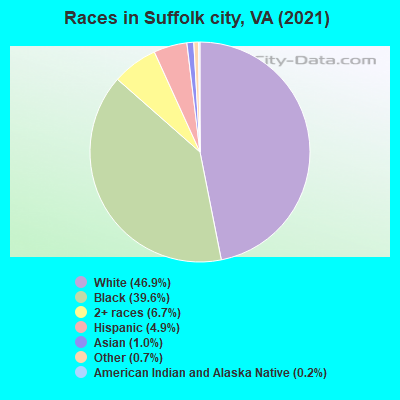
- 44,98445.7%White Non-Hispanic Alone
- 41,31241.9%Black Non-Hispanic Alone
- 5,1375.2%Hispanic or Latino
- 4,3314.4%Two or more races
- 1,7251.8%Asian alone
- 8750.9%Some other race alone
- 1730.2%American Indian and Alaska Native alone
| Median resident age: | 38.7 years |
| Virginia median age: | 39.0 years |
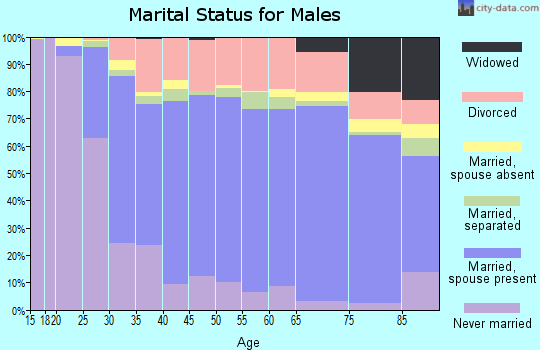
| Males: 48,345 | |
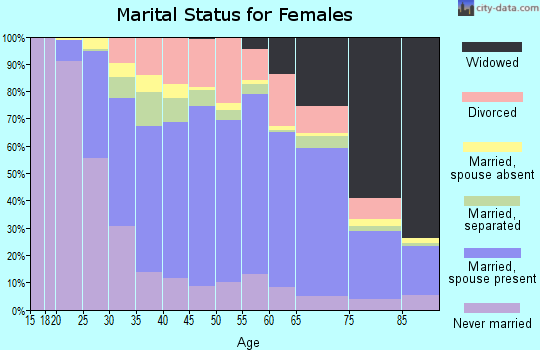
| Females: 50,192 |

 | Metro Silver Line and the Resurgence of Catoctin County (110 replies) |
| Provincialism in Hampton Roads (6 replies) |
| Suffolk city: | 2.0 people |
| Virginia: | 3 people |
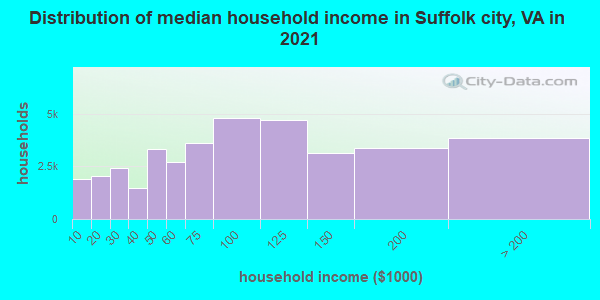
Estimated median household income in 2022: $83,144 ($41,115 in 1999)
| This county: | $83,144 |
| Virginia: | $85,873 |
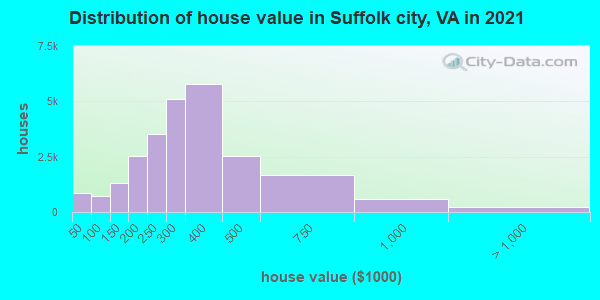
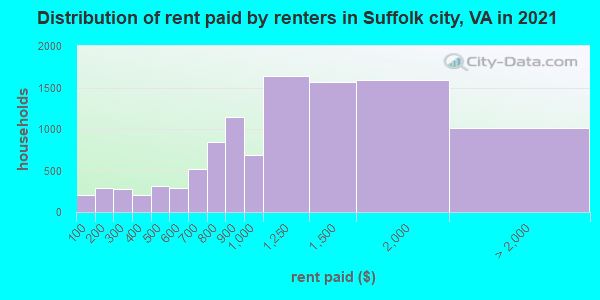
Median contract rent in 2022 for apartments: $1,209 (lower quartile is $759, upper quartile is $1,728)
| This county: | $1209 |
| State: | $1270 |
Estimated median house or condo value in 2022: $328,200 (it was $104,500 in 2000)
| Suffolk city: | $328,200 |
| Virginia: | $365,700 |
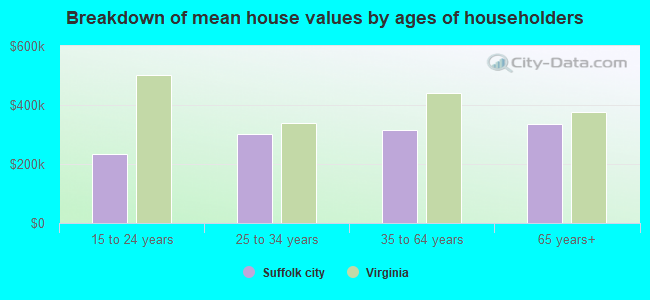
Mean price in 2022:
Median monthly housing costs for homes and condos with a mortgage: $1,845Detached houses: $448,004
Here: $448,004 State: $472,865 Townhouses or other attached units: $333,553
Here: $333,553 State: $457,437 In 2-unit structures: $240,319
Here: $240,319 State: $396,289 In 3-to-4-unit structures: $358,285
Here: $358,285 State: $252,346 In 5-or-more-unit structures: $342,221
Here: $342,221 State: $382,551 Mobile homes: $96,279
Here: $96,279 State: $100,736
Median monthly housing costs for units without a mortgage: $621
Institutionalized population: 1,029
Health of residents in Suffolk city based on CDC Behavioral Risk Factor Surveillance System Survey Questionnaires from 2013 to 2021:
General health status score of residents in this county from 1 (poor) to 5 (excellent) is 3.5. This is about average.73.3% of residents exercised in the past month. This is about average.
43.6% of residents smoked 100+ cigarettes in their lives. This is about average.
53.2% of adult residents drank alcohol in the past 30 days. This is less than average.
72.5% of residents visited a dentist within the past year. This is about average.
Average weight of males is 200 pounds. This is more than average.
Average weight of females is 167 pounds. This is more than average.
Median real estate property taxes paid for housing units with mortgages in 2022: $2,993 (0.9%)
Median real estate property taxes paid for housing units with no mortgage in 2022: $3,205 (1.0%)
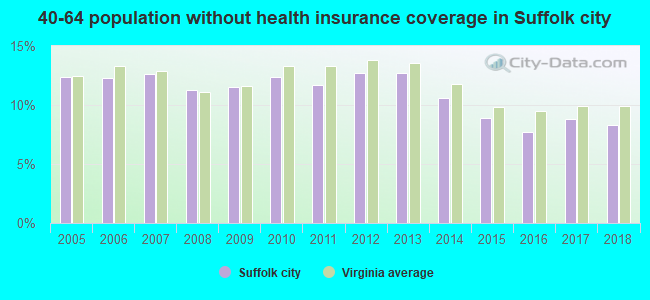
| Suffolk city: | 11.9% |
| Virginia: | 10.6% |
Median age of residents in 2022: 38.7 years old
(Males: 36.0 years old, Females: 39.9 years old)
(Median age for: White residents: 42.2 years old, Black residents: 38.3 years old, American Indian residents: 49.8 years old, Asian residents: 42.4 years old, Hispanic or Latino residents: 30.9 years old, Other race residents: 18.8 years old)
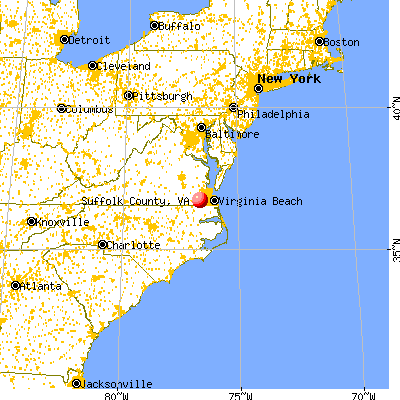
Area name: Virginia Beach-Norfolk-Newport News, VA-NC MSA
Fair market rent in 2006 for a 1-bedroom apartment in Suffolk city is $706 a month.
Fair market rent for a 2-bedroom apartment is $811 a month.
Fair market rent for a 3-bedroom apartment is $1118 a month.
Cities in this county include: Suffolk.
2023 air pollution in Suffolk city:
Ozone (1-hour): 0.035 ppm (standard limit: 0.12 ppm). Near U.S. average.
Neighboring counties: Marion County, Arkansas  , Macon County, Tennessee , Montgomery County , Leslie County, Kentucky , Monroe County, Kentucky , Sussex County
  .
.
| Here: | 2.8% |
| Virginia: | 2.7% |
Current college students: 3,129
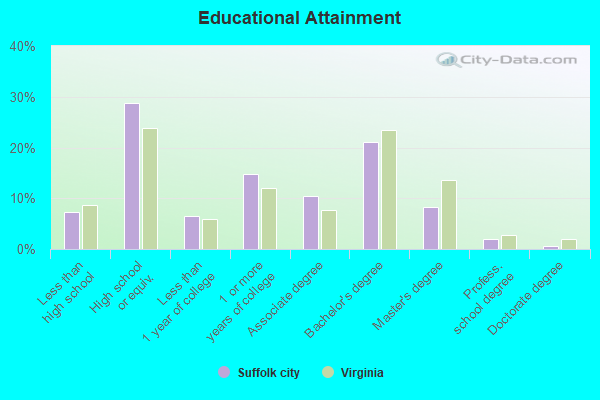
People 25 years of age or older with a high school degree or higher: 91.5%
People 25 years of age or older with a bachelor's degree or higher: 32.8%
Number of foreign born residents: 3,175 (79.6% naturalized citizens)
| Suffolk city: | 3.2% |
| Whole state: | 12.7% |
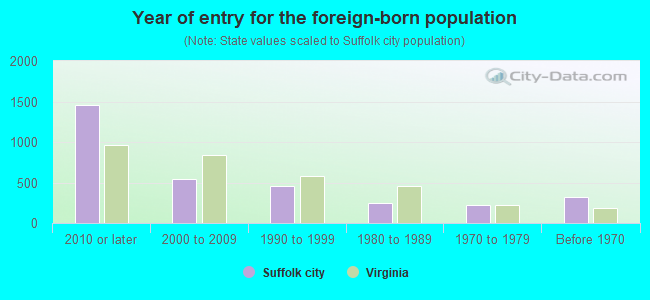
- Year of entry for the foreign-born population
- 1,4002010 or later
- 6252000 to 2009
- 5341990 to 1999
- 2431980 to 1989
- 2241970 to 1979
- 326Before 1970
Mean travel time to work (commute): minutes
Percentage of county residents living and working in this county: 99.2%
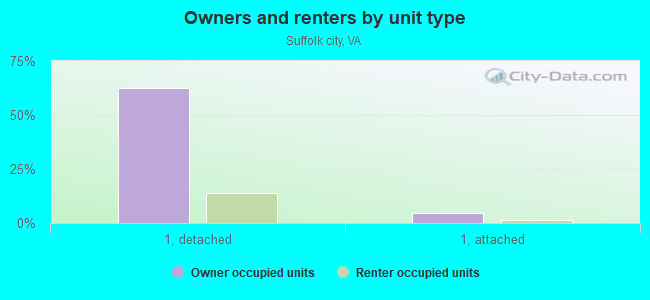
Housing units in structures:
- One, detached: 30,514
- One, attached: 3,310
- Two: 1,052
- 3 or 4: 1,012
- 5 to 9: 849
- 10 to 19: 1,082
- 20 to 49: 545
- 50 or more: 1,724
- Mobile homes: 712
- Boats, RVs, vans, etc.: 49
Housing units in Suffolk city with a mortgage: 21,748 (1,511 second mortgage, 37 home equity loan, 1,161 both second mortgage and home equity loan)
Houses without a mortgage: 348
| Here: | 5.7% with mortgage |
| State: | 97.2% with mortgage |
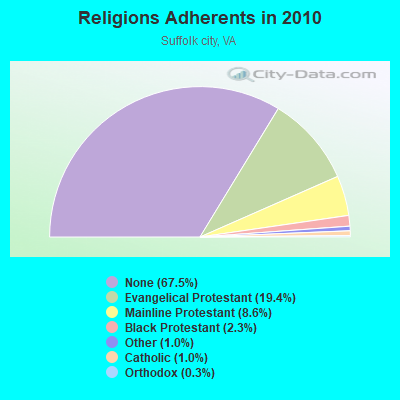
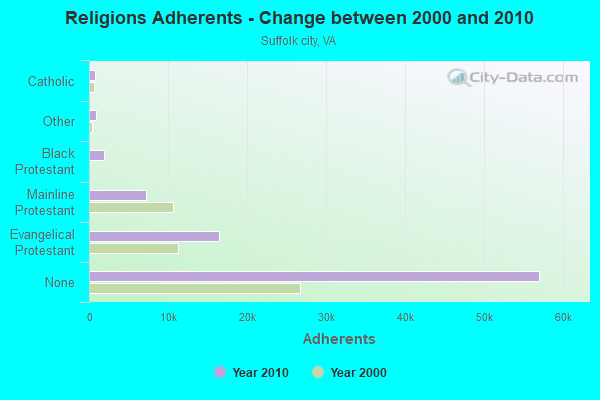
Religion statistics for Suffolk city
| Religion | Adherents | Congregations |
|---|---|---|
| Evangelical Protestant | 16,421 | 48 |
| Mainline Protestant | 7,260 | 26 |
| Black Protestant | 1,948 | 10 |
| Other | 844 | 3 |
| Catholic | 819 | 1 |
| Orthodox | 240 | 1 |
| None | 57,053 | - |
Source: Clifford Grammich, Kirk Hadaway, Richard Houseal, Dale E.Jones, Alexei Krindatch, Richie Stanley and Richard H.Taylor. 2012. 2010 U.S.Religion Census: Religious Congregations & Membership Study. Association of Statisticians of American Religious Bodies. Jones, Dale E., et al. 2002. Congregations and Membership in the United States 2000. Nashville, TN: Glenmary Research Center.
Food Environment Statistics:
| Suffolk city: | 1.36 / 10,000 pop. |
| State: | 2.03 / 10,000 pop. |
| Here: | 0.25 / 10,000 pop. |
| Virginia: | 0.17 / 10,000 pop. |
| This county: | 0.49 / 10,000 pop. |
| Virginia: | 1.43 / 10,000 pop. |
| Suffolk city: | 3.94 / 10,000 pop. |
| Virginia: | 4.03 / 10,000 pop. |
| This county: | 5.92 / 10,000 pop. |
| State: | 7.65 / 10,000 pop. |
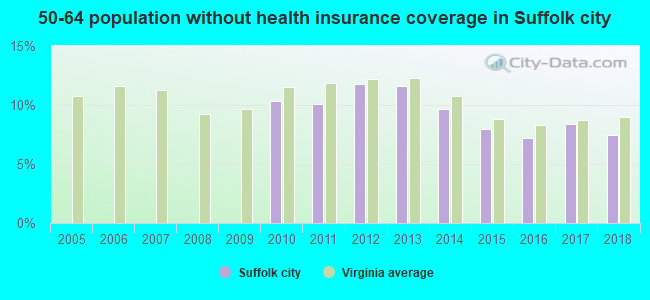
| Suffolk city: | 9.7% |
| Virginia: | 9.3% |
| Suffolk city: | 29.7% |
| State: | 26.7% |
| Here: | 15.7% |
| State: | 18.6% |
Agriculture in Suffolk city:
Average size of farms: 286 acresAverage value of agricultural products sold per farm: $165,746
Average value of crops sold per acre for harvested cropland: $662.52
The value of nursery, greenhouse, floriculture, and sod as a percentage of the total market value of agricultural products sold: 53.77%
The value of livestock, poultry, and their products as a percentage of the total market value of agricultural products sold: 12.69%
Average total farm production expenses per farm: $167,045
Harvested cropland as a percentage of land in farms: 76.43%
Irrigated harvested cropland as a percentage of land in farms: 2.07%
Average market value of all machinery and equipment per farm: $108,078
The percentage of farms operated by a family or individual: 84.62%
Average age of principal farm operators: 56 years
Average number of cattle and calves per 100 acres of all land in farms: 1.53
Corn for grain: 10780 harvested acres
All wheat for grain: 4777 harvested acres
Upland cotton: 15389 harvested acres
Soybeans for beans: 14590 harvested acres
Vegetables: 300 harvested acres
Land in orchards: 12 acres
Earthquake activity:
Suffolk city-area historical earthquake activity is significantly above Virginia state average. It is 62% smaller than the overall U.S. average.On 8/23/2011 at 17:51:04, a magnitude 5.8 (5.8 MW, Depth: 3.7 mi, Class: Moderate, Intensity: VI - VII) earthquake occurred 108.9 miles away from Suffolk city center
On 12/9/2003 at 20:59:14, a magnitude 4.5 (4.5 MB, 4.5 LG, Class: Light, Intensity: IV - V) earthquake occurred 92.2 miles away from the county center
On 12/9/2003 at 20:59:18, a magnitude 4.5 (4.5 ML, Depth: 6.2 mi) earthquake occurred 108.8 miles away from the county center
On 8/25/2011 at 05:07:52, a magnitude 4.5 (4.5 ML, Depth: 4.2 mi) earthquake occurred 111.9 miles away from the county center
On 8/9/2020 at 12:07:37, a magnitude 5.1 (5.1 MW, Depth: 4.7 mi) earthquake occurred 249.6 miles away from Suffolk city center
On 8/24/2011 at 00:04:36, a magnitude 4.2 (4.2 ML) earthquake occurred 109.8 miles away from the county center
Magnitude types: regional Lg-wave magnitude (LG), body-wave magnitude (MB), local magnitude (ML), moment magnitude (MW)
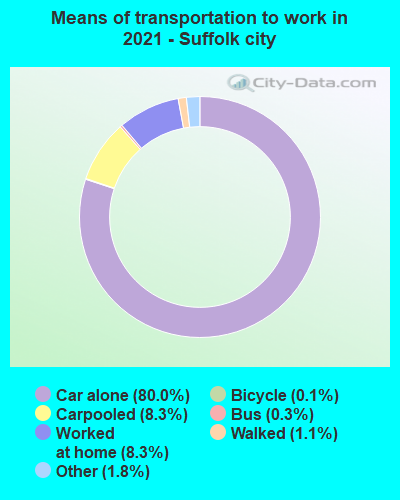
Means of transportation to work:
- Drove a car alone: 29,966 (74.7%)
- Carpooled: 3,365 (8.4%)
- Bus: 43 (0.1%)
- Light rail, streetcar or trolley: 1 (0.0%)
- Taxicab, motorcycle, or other means: 867 (2.2%)
- Bicycle: 111 (0.3%)
- Walked: 544 (1.4%)
- Worked at home: 4,804 (12.0%)
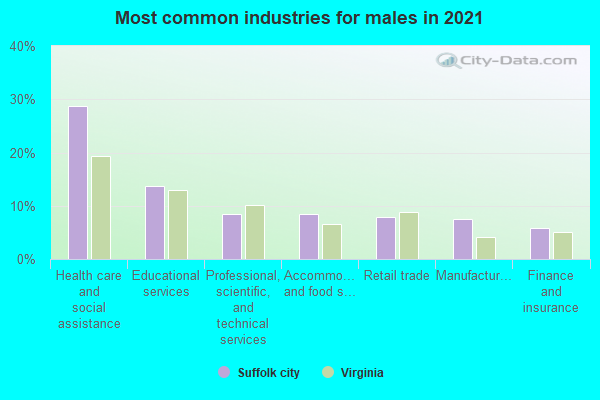
- Health care and social assistance (25%)
- Professional, scientific, and technical services (11%)
- Retail trade (10%)
- Public administration (10%)
- Educational services (7%)
- Manufacturing (6%)
- Other services, except public administration (5%)
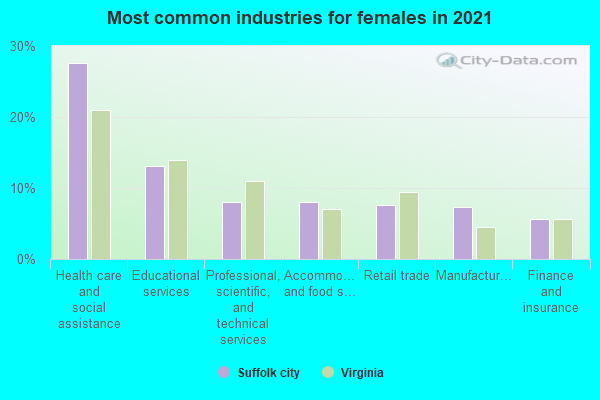
- Health care and social assistance (26%)
- Professional, scientific, and technical services (11%)
- Retail trade (10%)
- Public administration (10%)
- Educational services (8%)
- Manufacturing (6%)
- Other services, except public administration (5%)
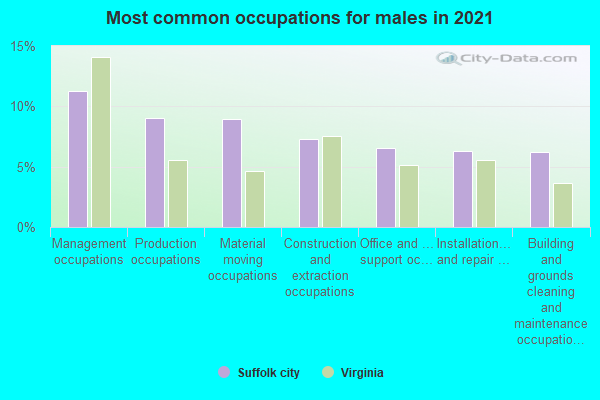
- Installation, maintenance, and repair occupations (9%)
- Management occupations (9%)
- Production occupations (9%)
- Business and financial operations occupations (8%)
- Sales and related occupations (8%)
- Construction and extraction occupations (7%)
- Office and administrative support occupations (7%)
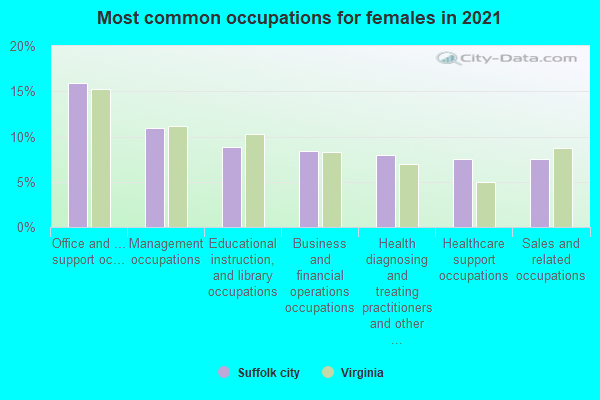
- Management occupations (15%)
- Office and administrative support occupations (15%)
- Business and financial operations occupations (10%)
- Health diagnosing and treating practitioners and other technical occupations (8%)
- Sales and related occupations (7%)
- Educational instruction, and library occupations (6%)
- Healthcare support occupations (6%)
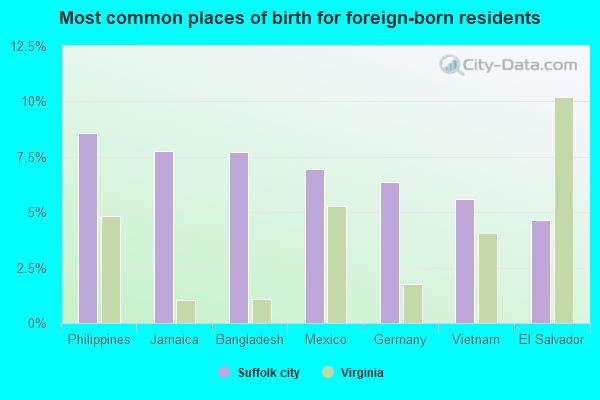
- Philippines (10%)
- Vietnam (8%)
- Dominican Republic (7%)
- Mexico (6%)
- El Salvador (6%)
- Jamaica (6%)
- Germany (5%)
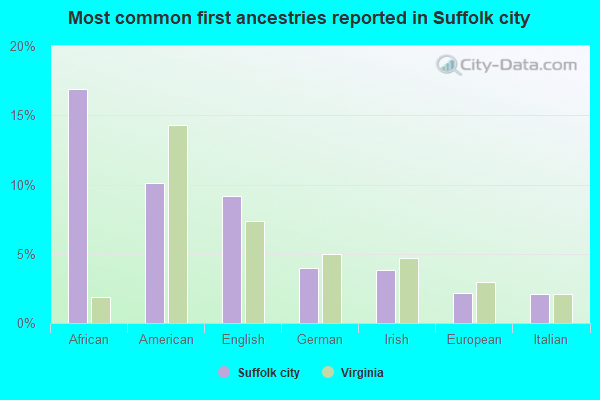
- African (17%)
- English (9%)
- American (9%)
- German (4%)
- Irish (4%)
- European (2%)
- Italian (2%)
People in group quarters in Suffolk city, Virginia in 2010:
- 762 people in local jails and other municipal confinement facilities
- 267 people in nursing facilities/skilled-nursing facilities
- 67 people in group homes intended for adults
- 15 people in emergency and transitional shelters (with sleeping facilities) for people experiencing homelessness
- 12 people in workers' group living quarters and job corps centers
- 3 people in residential treatment centers for adults
- 2 people in other noninstitutional facilities
People in group quarters in Suffolk city, Virginia in 2000:
- 441 people in local jails and other confinement facilities (including police lockups)
- 417 people in nursing homes
- 81 people in other noninstitutional group quarters
- 24 people in homes for the mentally retarded
- 16 people in mental (psychiatric) hospitals or wards
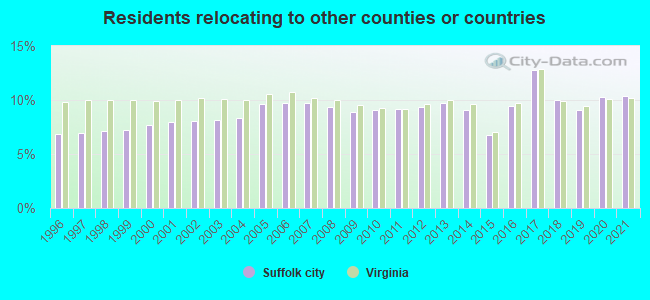
12.29% of this county's 2021 resident taxpayers lived in other counties in 2020 ($61,180 average adjusted gross income)
| Here: | 12.29% |
| Virginia average: | 10.16% |
0.19% of residents moved from foreign countries ($1,032 average AGI)
Suffolk city: 0.19% Virginia average: 0.12%
8.26% relocated from other counties in Virginia ($41,356 average AGI)
3.84% relocated from other states ($18,792 average AGI)
Suffolk city: 3.84% Virginia average: 3.91%

Top counties from which taxpayers relocated into this county between 2020 and 2021:
| from Chesapeake city, VA | |
| from Portsmouth city, VA | |
| from Virginia Beach city, VA | |
| from Norfolk city, VA | |
| from Newport News city, VA | |
| from Isle of Wight County, VA | |
| from Hampton city, VA |
10.40% of this county's 2020 resident taxpayers moved to other counties in 2021 ($65,776 average adjusted gross income)
| Here: | 10.40% |
| Virginia average: | 10.20% |
0.09% of residents moved to foreign countries ($696 average AGI)
Suffolk city: 0.09% Virginia average: 0.09%
6.57% relocated to other counties in Virginia ($37,934 average AGI)
3.74% relocated to other states ($27,146 average AGI)
Suffolk city: 3.74% Virginia average: 3.98%
Top counties to which taxpayers relocated from this county between 2020 and 2021:
| to Chesapeake city, VA | |
| to Portsmouth city, VA | |
| to Virginia Beach city, VA | |
| to Isle of Wight County, VA | |
| to Norfolk city, VA | |
| to Newport News city, VA | |
| to Hampton city, VA |
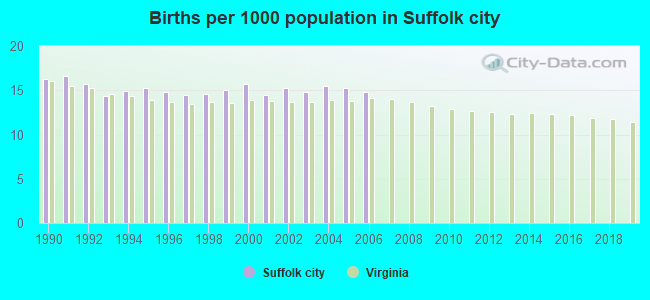
Births per 1000 population from 1990 to 1999: 15.2
Births per 1000 population from 2000 to 2006: 15.1
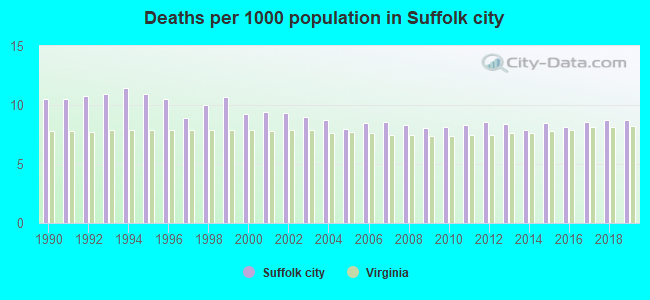
Deaths per 1000 population from 1990 to 1999: 10.5
Deaths per 1000 population from 2000 to 2009: 8.7
Deaths per 1000 population from 2010 to 2020: 8.6
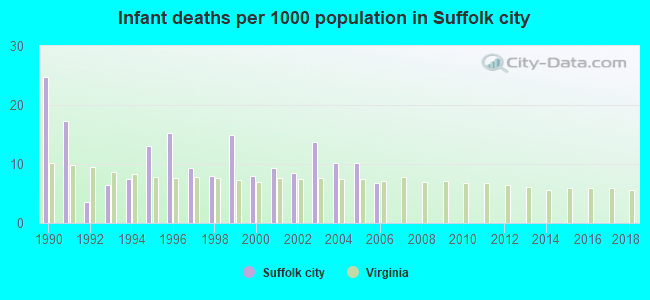
Infant deaths per 1000 live births from 1990 to 1999: 12.0
Infant deaths per 1000 live births from 2000 to 2006: 9.5
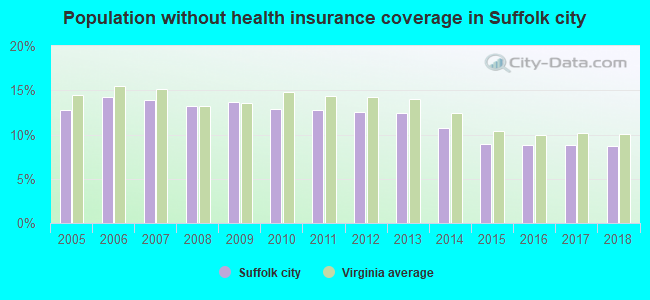
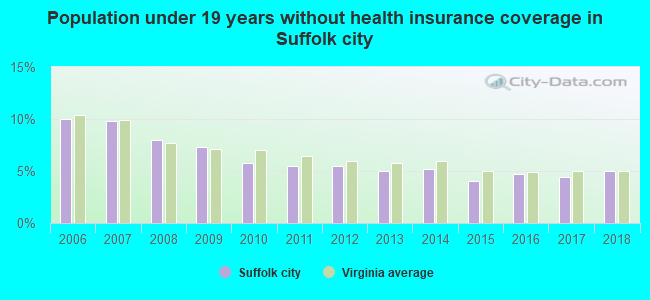
Persons under 19 years old without health insurance coverage in 2018: 5.0%
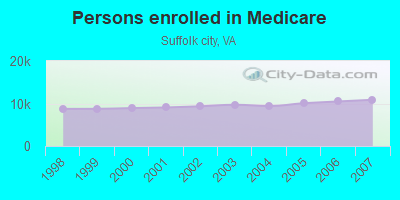
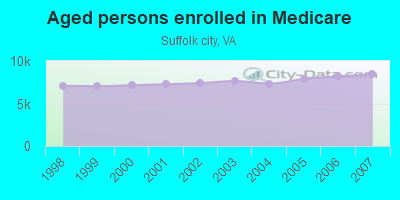
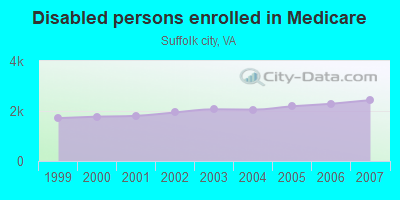
Persons enrolled in hospital insurance and/or supplemental medical insurance (Medicare) in July 1, 2007: 10,870 (8,434 aged, 2,436 disabled)
Children under 18 without health insurance coverage in 2007: 2,107 (9%)
Most common underlying causes of death in Suffolk city, Virginia in 1999 - 2019:
- Atherosclerotic heart disease (893)
- Bronchus or lung, unspecified - Malignant neoplasms (892)
- Chronic obstructive pulmonary disease, unspecified (561)
- Acute myocardial infarction, unspecified (512)
- Alzheimer disease, unspecified (490)
- Unspecified dementia (488)
- Stroke, not specified as haemorrhage or infarction (448)
- Breast, unspecified - Malignant neoplasms (296)
- Congestive heart failure (283)
- Other forms of acute ischaemic heart disease (280)
Population without health insurance coverage in 2000: 12%
Children under 18 without health insurance coverage in 2000: 9%
Short term general hospital admissions per 100,000 population in 2004: 10,757
Short term general hospital beds per 100,000 population in 2004: 180
Emergency room visits per 100,000 population in 2004: 48,833
General practice office based MDs per 100,000 population in 2005: 1,487
Medical specialist MDs per 100,000 population in 2005: 914
Dentists per 100,000 population in 1998: 5
Total births per 100,000 population, July 2005 - July 2006 : 30
Total deaths per 100,000 population, July 2005 - July 2006: 56
Limited-service eating places per 100,000 population in 2005 : 6
Beer, wine & liquor stores per 100,000 population in 2005: 1
EPA green book nonattainment status in 2004-2006: 1
Homicides per 1,000,000 population from 2000 to 2006: 65.2. This is more than state average.
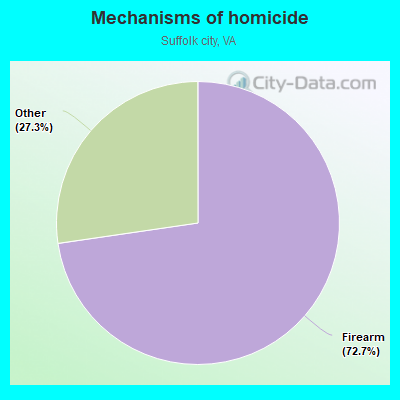
- Firearm - 47.4
- Other - 17.8
Suicides per 1,000,000 population from 2000 to 2006: 98.8. This is less than state average.
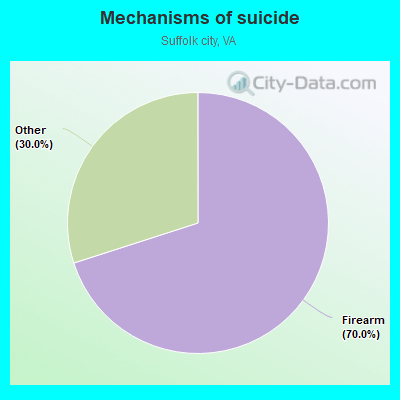
- Firearm - 69.2
- Other - 29.6
Household type by relationship:
Households: 98,537- Male householders: 19,242 (3,810 living alone), Female householders: 19,471 (5,551 living alone)
18,226 spouses (17,982 opposite-sex spouses), 3,435 unmarried partners, (3,435 opposite-sex unmarried partners), 29,467 children (26,628 natural, 966 adopted, 1,873 stepchildren), 2,283 grandchildren, 1,184 brothers or sisters, 801 parents, 289 foster children, 1,032 other relatives, 1,895 non-relatives
- In group quarters: 1,212
Size of family households: 11,218 2-persons, 7,148 3-persons, 4,731 4-persons, 2,338 5-persons, 1,366 6-persons, 518 7-or-more-persons.
Size of nonfamily households: 9,361 1-person, 1,311 2-persons, 444 3-persons, 278 4-persons.
12,314 married couples with children.
7,793 single-parent households (2,345 men, 5,448 women).
93.8% of residents of Suffolk city speak English at home.
2.9% of residents speak Spanish at home (73% speak English very well, 19% speak English well, 7% speak English not well, 1% don't speak English at all).
1.5% of residents speak other Indo-European language at home (83% speak English very well, 11% speak English well, 5% speak English not well, 1% don't speak English at all).
1.0% of residents speak Asian or Pacific Island language at home (56% speak English very well, 17% speak English well, 16% speak English not well, 11% don't speak English at all).
0.3% of residents speak other language at home (31% speak English very well, 30% speak English well, 38% speak English not well).
In fiscal year 2004:
Federal Government expenditure: $584,582,000 ($7,633 per capita)
Department of Defense expenditure: $221,408,000
Federal direct payments to individuals for retirement and disability: $216,905,000
Federal other direct payments to individuals: $69,212,000
Federal direct payments not to individuals: $5,894,000
Federal grants: $65,997,000
Federal procurement contracts: $189,858,000 ($158,718,000 Department of Defense)
Federal salaries and wages: $36,715,000 ($27,552,000 Department of Defense)
Federal Government direct loans: $1,926,000
Federal guaranteed/insured loans: $161,769,000
Federal Government insurance: $125,417,000
Population change from April 1, 2000 to July 1, 2005:
Births: 5,692| Here: | 72 per 1000 residents |
| State: | 70 per 1000 residents |
Deaths: 3,380
| Here: | 43 per 1000 residents |
| State: | 40 per 1000 residents |
Net international migration: +191
| Here: | +2 per 1000 residents |
| State: | +18 per 1000 residents |
Net internal migration: +12,916
| Here: | +164 per 1000 residents |
| State: | +14 per 1000 residents |
Total withdrawal of fresh water for public supply: 79.12 millions of gallons per day (7% from ground, 93% from surface)
| Here: | 7.0 |
| State: | 7.0 |
| Here: | 5.0 |
| State: | 4.3 |
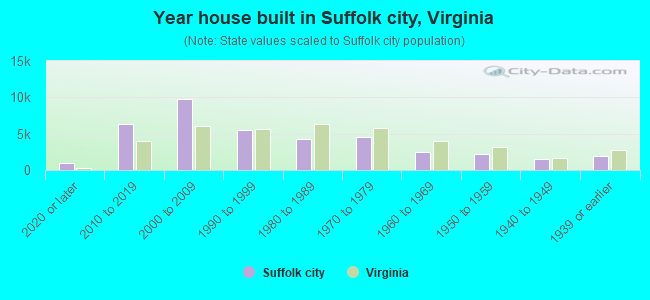
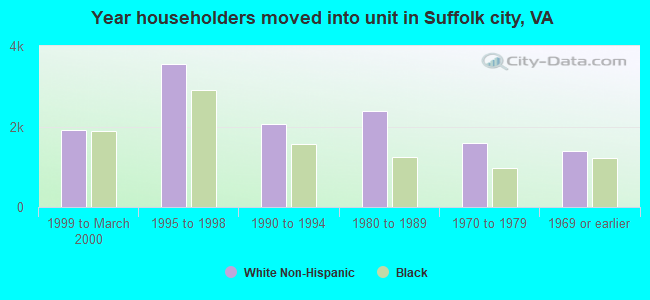
- Year house built in Suffolk city, Virginia
- 2,1102020 or later
- 6,7562010 to 2019
- 8,7732000 to 2009
- 5,6561990 to 1999
- 4,0111980 to 1989
- 3,8581970 to 1979
- 3,6741960 to 1969
- 2,7641950 to 1959
- 1,2191940 to 1949
- 2,0281939 or earlier
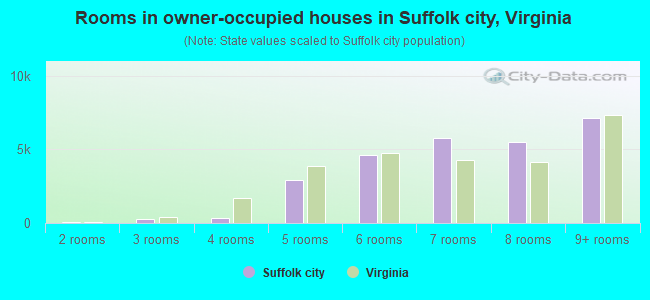
- Rooms in owner-occupied houses in Suffolk city, Virginia
- 341 room
- 02 rooms
- 1493 rooms
- 1,8774 rooms
- 5,3635 rooms
- 4,8976 rooms
- 4,5237 rooms
- 5,0688 rooms
- 7,1609+ rooms
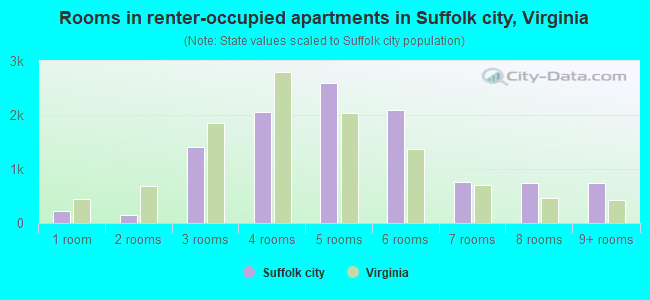
- Rooms in renter-occupied apartments in Suffolk city, Virginia
- 1641 room
- 1412 rooms
- 1,0163 rooms
- 2,6164 rooms
- 1,7455 rooms
- 1,5966 rooms
- 1,8487 rooms
- 3128 rooms
- 2049+ rooms
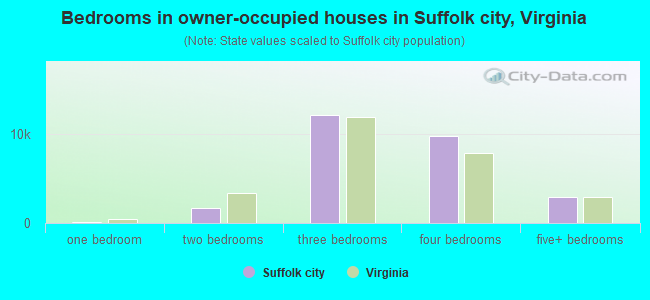
- Bedrooms in owner-occupied houses in Suffolk city, Virginia
- 34no bedroom
- 681 bedroom
- 2,7412 bedrooms
- 13,0563 bedrooms
- 10,8154 bedrooms
- 2,3575+ bedrooms
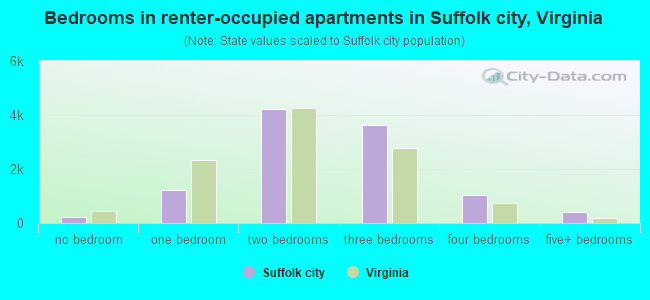
- Bedrooms in renter-occupied apartments in Suffolk city, Virginia
- 220no bedroom
- 1,3691 bedroom
- 3,1592 bedrooms
- 2,9153 bedrooms
- 1,8224 bedrooms
- 1575+ bedrooms
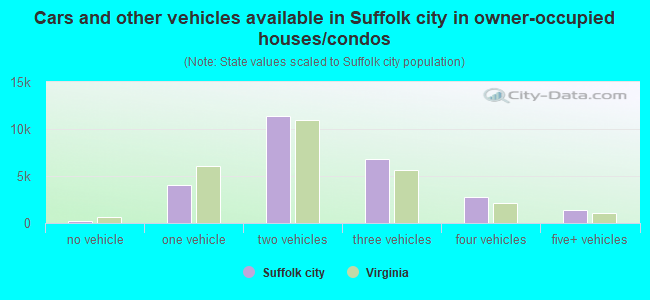
- Cars and other vehicles available in Suffolk city in owner-occupied houses/condos
- 766no vehicle
- 5,0541 vehicle
- 11,9102 vehicles
- 6,3253 vehicles
- 3,2774 vehicles
- 1,7395+ vehicles
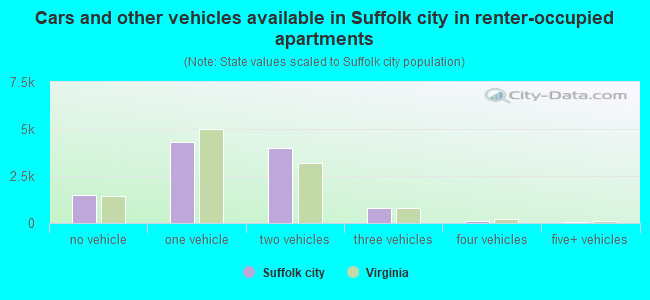
- Cars and other vehicles available in Suffolk city in renter-occupied apartments
- 1,752no vehicle
- 4,4451 vehicle
- 2,4072 vehicles
- 1,0383 vehicles
- 04 vehicles
- 05+ vehicles
86.9% of Suffolk city residents lived in the same house 1 years ago.
Out of people who lived in different houses, 21% lived in this county.
Out of people who lived in different counties, 69% lived in Virginia.
| Suffolk city: | 86.9% |
| State average: | 86.6% |
Place of birth for U.S.-born residents:
- This state: 58,811
- Other state: 34,778
- Northeast: 8,736
- Midwest: 5,404
- South: 14,391
- West: 6,247
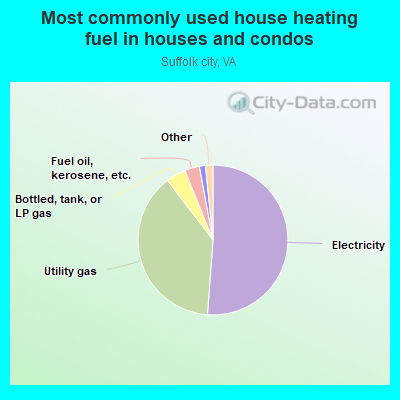
- 46.6%Electricity
- 43.2%Utility gas
- 5.0%Bottled, tank, or LP gas
- 3.3%Fuel oil, kerosene, etc.
- 0.6%Wood
- 0.5%No fuel used
- 0.5%Solar energy
- 0.3%Other fuel
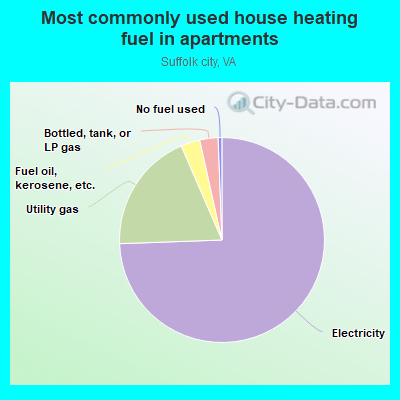
- 73.6%Electricity
- 19.2%Utility gas
- 3.7%Bottled, tank, or LP gas
- 2.4%Fuel oil, kerosene, etc.
- 0.7%No fuel used
- 0.2%Other fuel
- 0.1%Wood
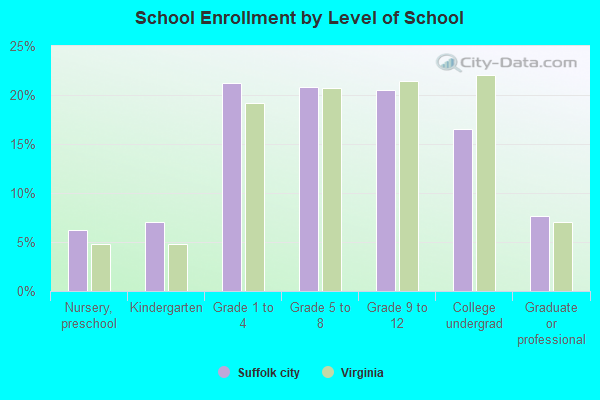
Private vs. public school enrollment:
| Here: | 23.5% |
| Virginia: | 13.2% |
| Here: | 12.4% |
| Virginia: | 10.2% |
| Here: | 7.0% |
| Virginia: | 18.7% |
Supplemental Security Income (SSI) in 2004:
- Total number of recipients: 2,290
- Number of aged recipients: 197
- Number of blind and disabled recipients: 2,093
- Number of recipients under 18: 414
- Number of recipients between 18 and 64: 1,417
- Number of recipients older than 64: 459
- Number of recipients also receiving OASDI: 846
- Amount of payments (thousands of dollars): 933
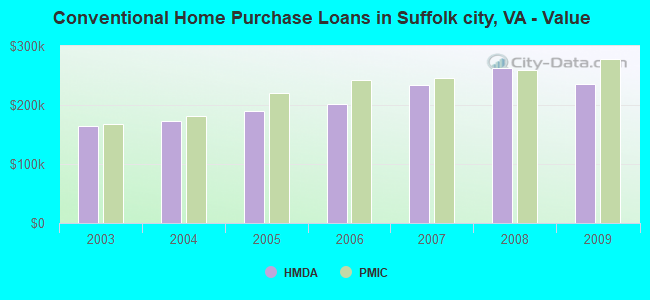
| Home Mortgage Disclosure Act Aggregated Statistics For Year 2009 (Based on 13 full tracts) | ||||||||||||||
| A) FHA, FSA/RHS & VA Home Purchase Loans | B) Conventional Home Purchase Loans | C) Refinancings | D) Home Improvement Loans | E) Loans on Dwellings For 5+ Families | F) Non-occupant Loans on < 5 Family Dwellings (A B C & D) | G) Loans On Manufactured Home Dwelling (A B C & D) | ||||||||
|---|---|---|---|---|---|---|---|---|---|---|---|---|---|---|
| Number | Average Value | Number | Average Value | Number | Average Value | Number | Average Value | Number | Average Value | Number | Average Value | Number | Average Value | |
| LOANS ORIGINATED | 873 | $248,464 | 271 | $234,993 | 2,477 | $227,679 | 170 | $103,835 | 2 | $897,500 | 136 | $182,022 | 19 | $153,053 |
| APPLICATIONS APPROVED, NOT ACCEPTED | 25 | $250,600 | 12 | $178,417 | 195 | $228,262 | 22 | $87,000 | 0 | $0 | 6 | $182,333 | 4 | $26,500 |
| APPLICATIONS DENIED | 50 | $227,260 | 39 | $164,641 | 821 | $218,336 | 110 | $67,682 | 0 | $0 | 63 | $126,333 | 17 | $86,706 |
| APPLICATIONS WITHDRAWN | 58 | $246,103 | 21 | $313,571 | 667 | $242,456 | 23 | $126,130 | 0 | $0 | 27 | $166,963 | 6 | $137,500 |
| FILES CLOSED FOR INCOMPLETENESS | 4 | $195,250 | 5 | $187,400 | 143 | $232,378 | 7 | $245,429 | 0 | $0 | 6 | $220,000 | 1 | $27,000 |
| Private Mortgage Insurance Companies Aggregated Statistics For Year 2009 (Based on 11 full tracts) | ||||||
| A) Conventional Home Purchase Loans | B) Refinancings | C) Non-occupant Loans on < 5 Family Dwellings (A & B) | ||||
|---|---|---|---|---|---|---|
| Number | Average Value | Number | Average Value | Number | Average Value | |
| LOANS ORIGINATED | 23 | $277,565 | 46 | $265,326 | 0 | $0 |
| APPLICATIONS APPROVED, NOT ACCEPTED | 5 | $305,200 | 22 | $263,727 | 0 | $0 |
| APPLICATIONS DENIED | 4 | $342,500 | 12 | $265,917 | 0 | $0 |
| APPLICATIONS WITHDRAWN | 3 | $235,667 | 6 | $245,333 | 0 | $0 |
| FILES CLOSED FOR INCOMPLETENESS | 2 | $154,000 | 1 | $249,000 | 2 | $154,000 |
| Most common first names in Suffolk city, VA among deceased individuals | ||
| Name | Count | Lived (average) |
|---|---|---|
| James | 614 | 70.0 years |
| Mary | 507 | 76.6 years |
| William | 491 | 71.8 years |
| John | 440 | 72.5 years |
| Robert | 279 | 69.1 years |
| George | 276 | 71.5 years |
| Willie | 234 | 71.4 years |
| Joseph | 194 | 71.0 years |
| Annie | 172 | 79.8 years |
| Margaret | 164 | 76.4 years |
| Most common last names in Suffolk city, VA among deceased individuals | ||
| Last name | Count | Lived (average) |
|---|---|---|
| Jones | 273 | 71.8 years |
| Johnson | 247 | 72.7 years |
| Williams | 226 | 72.2 years |
| Smith | 214 | 72.5 years |
| Brown | 202 | 72.1 years |
| Holland | 195 | 74.8 years |
| Boone | 173 | 68.5 years |
| White | 169 | 72.2 years |
| Parker | 150 | 73.3 years |
| Copeland | 149 | 73.8 years |
| Businesses in Suffolk city, VA | ||||
| Name | Count | Name | Count | |
|---|---|---|---|---|
| 7-Eleven | 6 | Long John Silver's | 1 | |
| AT&T | 1 | Lowe's | 1 | |
| Advance Auto Parts | 2 | Marriott | 2 | |
| Applebee's | 2 | MasterBrand Cabinets | 2 | |
| Arby's | 2 | McDonald's | 4 | |
| AutoZone | 1 | Nike | 4 | |
| Bed Bath & Beyond | 1 | OfficeMax | 1 | |
| Blockbuster | 1 | Panera Bread | 1 | |
| Burger King | 3 | Papa John's Pizza | 1 | |
| Chevrolet | 1 | Payless | 2 | |
| Chick-Fil-A | 2 | Penske | 1 | |
| Church's Chicken | 1 | Pizza Hut | 2 | |
| Cold Stone Creamery | 1 | Quality | 1 | |
| Comfort Suites | 1 | RadioShack | 2 | |
| Days Inn | 2 | Rite Aid | 3 | |
| Econo Lodge | 1 | Ruby Tuesday | 2 | |
| FedEx | 8 | SONIC Drive-In | 1 | |
| Ford | 1 | Sears | 1 | |
| GNC | 2 | Starbucks | 4 | |
| GameStop | 1 | Subway | 6 | |
| Goodwill | 3 | Super 8 | 1 | |
| H&R Block | 4 | T-Mobile | 4 | |
| Hardee's | 3 | Taco Bell | 1 | |
| Hilton | 1 | The Athlete's Foot | 1 | |
| Holiday Inn | 1 | U-Haul | 3 | |
| IHOP | 1 | UPS | 7 | |
| Jones New York | 2 | Verizon Wireless | 3 | |
| KFC | 1 | Walgreens | 2 | |
| Kohl's | 1 | Walmart | 2 | |
| La-Z-Boy | 1 | Wendy's | 3 | |
| Lane Furniture | 2 | YMCA | 1 | |
Suffolk city on our top lists:
- #62 on the list of "Top 101 counties with the highest percentage of residents relocating from foreign countries between 2010 and 2011 (pop. 50,000+)"
- #77 on the list of "Top 101 counties with the highest surface withdrawal of fresh water for public supply (pop. 50,000+)"
- #81 on the list of "Top 101 counties with the highest surface withdrawal of fresh water for public supply"
- #87 on the list of "Top 101 counties with the smallest number of people without health insurance coverage in 2000 (pop. 50,000+)"
- #90 on the list of "Top 101 counties with the highest percentage of residents relocating from foreign countries between 2010 and 2011"
- #92 on the list of "Top 101 counties with the highest percentage of residents relocating to foreign countries in 2011 (pop. 50,000+)"
- #98 on the list of "Top 101 counties with the highest percentage of residents relocating to other counties in 2011 (pop. 50,000+)"