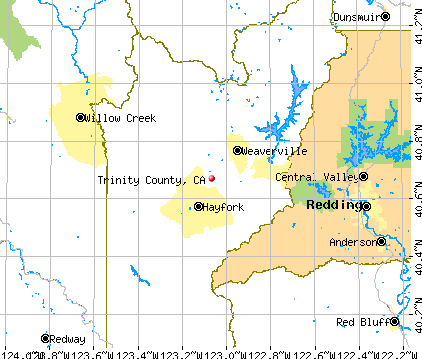
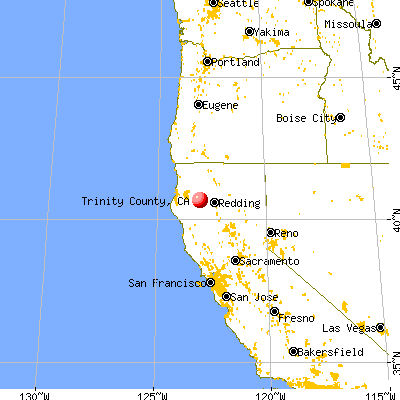
Trinity County, California (CA)
County owner-occupied free and clear houses and condos in 2010: 2,131
County owner-occupied houses and condos in 2000: 3,981
Renter-occupied apartments: 1,799 (it was 1,606 in 2000)
| % of renters here: | 29% |
| State: | 44% |
Land area: 3179 sq. mi.
Water area: 28.9 sq. mi.
Population density: 5 people per square mile (very low).
Industries providing employment: Educational, health and social services (15.8%), Arts, entertainment, recreation, accommodation and food services (15.7%), Construction (15.3%), Agriculture,forestry,fishing and hunting, and mining (12.3%), Retail trade (12.1%).
Type of workers:
- Private wage or salary: 54%
- Government: 24%
- Self-employed, not incorporated: 22%
- Unpaid family work: 0%
- OSM Map
- General Map
- Google Map
- MSN Map

- 11,91077.1%White Non-Hispanic Alone
- 1,2067.8%Hispanic or Latino
- 7014.5%Two or more races
- 5313.4%Some other race alone
- 4412.9%American Indian and Alaska Native alone
- 3982.6%Asian alone
- 2091.4%Black Non-Hispanic Alone
- 540.3%Native Hawaiian and Other
Pacific Islander alone

| Median resident age: | 54.1 years |
| California median age: | 37.9 years |
| Males: 8,170 | |
| Females: 7,587 |

 | FILMMAKERS ANALYZE PARADISE FIRE: Blame Residents for Town's Fire-Prone Location (48 replies) |
| Why doesn't California's northern third have a higher population? (89 replies) |
| Flattening the curve is working! (849 replies) |
| If you had to choose....Chico or Redding (15 replies) |
| Why California sub-forums don't cover the whole state? (33 replies) |
| The ever-present threat of fires (53 replies) |
| Trinity County: | 2.0 people |
| California: | 3 people |
Estimated median household income in 2022: $47,134 ($27,711 in 1999)
| This county: | $47,134 |
| California: | $91,551 |
Median contract rent in 2022 for apartments: $830 (lower quartile is $427, upper quartile is $986)
| This county: | $830 |
| State: | $1719 |
Estimated median house or condo value in 2022: $354,204 (it was $103,300 in 2000)
| Trinity: | $354,204 |
| California: | $715,900 |
Mean price in 2022:
Median monthly housing costs for homes and condos with a mortgage: $1,713Detached houses: $736,800
Here: $736,800 State: $988,808 Townhouses or other attached units: $456,127
Here: $456,127 State: $838,546 Mobile homes: $217,236
Here: $217,236 State: $184,506 Occupied boats, RVs, vans, etc.: $119,708
Here: $119,708 State: $204,957
Median monthly housing costs for units without a mortgage: $456
Institutionalized population: 168
Crime in 2020 (reported by the sheriff's office or county police, not the county total):
- Murders: 2
- Rapes: 3
- Robberies: 7
- Assaults: 70
- Burglaries: 56
- Thefts: 86
- Auto thefts: 5
Crime in 2019 (reported by the sheriff's office or county police, not the county total):
- Murders: 2
- Rapes: 10
- Robberies: 9
- Assaults: 40
- Burglaries: 83
- Thefts: 101
- Auto thefts: 6
Single-family new house construction building permits:
- 2022: 21 buildings, average cost: $173,100
- 2021: 44 buildings, average cost: $134,800
- 2020: 29 buildings, average cost: $87,800
- 2019: 16 buildings, average cost: $212,500
- 2018: 55 buildings, average cost: $138,200
- 2017: 52 buildings, average cost: $138,200
- 2016: 27 buildings, average cost: $123,200
- 2015: 23 buildings, average cost: $168,400
- 2014: 30 buildings, average cost: $181,500
- 2013: 14 buildings, average cost: $137,100
- 2012: 5 buildings, average cost: $160,000
- 2011: 25 buildings, average cost: $134,200
- 2010: 40 buildings, average cost: $161,000
- 2009: 28 buildings, average cost: $199,100
- 2008: 25 buildings, average cost: $255,200
- 2007: 49 buildings, average cost: $192,600
- 2006: 64 buildings, average cost: $179,800
- 2005: 66 buildings, average cost: $172,200
- 2004: 78 buildings, average cost: $138,600
- 2003: 58 buildings, average cost: $102,100
- 2002: 41 buildings, average cost: $126,200
- 2001: 48 buildings, average cost: $104,000
- 2000: 34 buildings, average cost: $129,500
- 1999: 40 buildings, average cost: $119,600
- 1998: 49 buildings, average cost: $125,800
- 1997: 31 buildings, average cost: $95,900


Median real estate property taxes paid for housing units with mortgages in 2022: $2,628 (0.7%)
Median real estate property taxes paid for housing units with no mortgage in 2022: $1,450 (0.5%)


| Trinity County: | 22.1% |
| California: | 12.2% |
Median age of residents in 2022: 54.1 years old
(Males: 53.1 years old, Females: 54.4 years old)
(Median age for: White residents: 55.4 years old, Black residents: 56.1 years old, American Indian residents: 12.6 years old, Asian residents: 24.4 years old, Hispanic or Latino residents: 34.5 years old, Other race residents: 49.5 years old)
Fair market rent in 2006 for a 1-bedroom apartment in Trinity County is $463 a month.
Fair market rent for a 2-bedroom apartment is $608 a month.
Fair market rent for a 3-bedroom apartment is $834 a month.
Cities in this county include: Weaverville, Hayfork, Lower Trinity, Lewiston, Mad River, Douglas City, Junction City, Trinity Village, Burnt Ranch, Trinity Center.
| Zip code | City | Number of tests | Number of tests >= 4 pCi/L |
|---|---|---|---|
| 95563 | Salyer | 2 | 0 |
| 95595 | Zenia | 1 | 0 |
| 96010 | Big Bar | 1 | 0 |
| 96041 | Hayfork | 3 | 0 |
| 96052 | Lewiston | 2 | 0 |
| 96091 | Trinity Center | 2 | 0 |
| 96093 | Weaverville | 2 | 0 |
2023 air pollution in Trinity County:
Particulate Matter (PM2.5) Annual: 5.8 µg/m3(standard limit: 15.0 µg/m3). Near U.S. average.
Neighboring counties: Newport County, Rhode Island  , DeKalb County, Indiana , Mahoning County, Ohio , Mercer County, Illinois , Wells County, Indiana .
| Here: | 6.3% |
| California: | 5.1% |


Current college students: 441
People 25 years of age or older with a high school degree or higher: 95.3%
People 25 years of age or older with a bachelor's degree or higher: 19.2%
Number of foreign born residents: 1,169 (52.4% naturalized citizens)
| Trinity County: | 7.4% |
| Whole state: | 26.7% |

- Year of entry for the foreign-born population
- 6522010 or later
- 1152000 to 2009
- 2341990 to 1999
- 111980 to 1989
- 351970 to 1979
- 125Before 1970
Mean travel time to work (commute): minutes
Percentage of county residents living and working in this county: 100.1%
Housing units in structures:
- One, detached: 6,349
- One, attached: 70
- Two: 100
- 3 or 4: 115
- 5 to 9: 163
- 10 to 19: 38
- 50 or more: 9
- Mobile homes: 1,278
- Boats, RVs, vans, etc.: 171
Housing units in Trinity County with a mortgage: 1,529 (50 second mortgage, 0 home equity loan, 52 both second mortgage and home equity loan)
Houses without a mortgage: 0
| Here: | 100.0% with mortgage |
| State: | 98.6% with mortgage |
Religion statistics for Trinity County
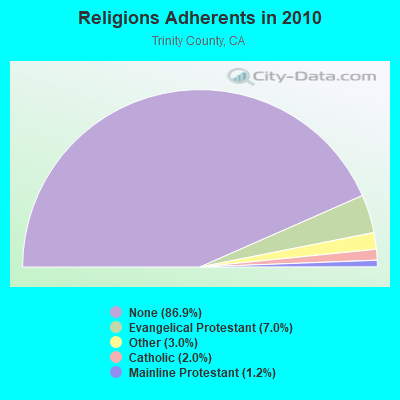
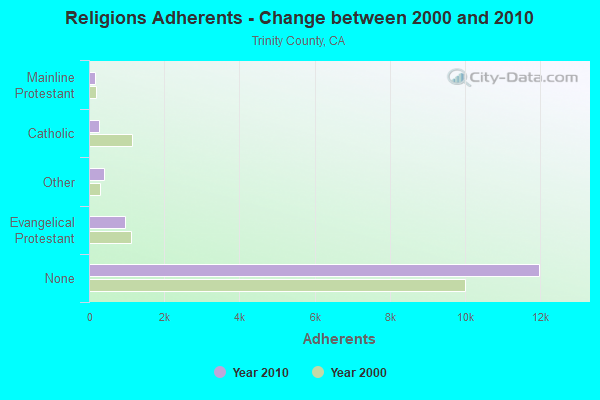
| Religion | Adherents | Congregations |
|---|---|---|
| Evangelical Protestant | 961 | 14 |
| Other | 412 | 7 |
| Catholic | 269 | 3 |
| Mainline Protestant | 166 | 2 |
| None | 11,978 | - |
Source: Clifford Grammich, Kirk Hadaway, Richard Houseal, Dale E.Jones, Alexei Krindatch, Richie Stanley and Richard H.Taylor. 2012. 2010 U.S.Religion Census: Religious Congregations & Membership Study. Association of Statisticians of American Religious Bodies. Jones, Dale E., et al. 2002. Congregations and Membership in the United States 2000. Nashville, TN: Glenmary Research Center.
Food Environment Statistics:
| Trinity County: | 4.24 / 10,000 pop. |
| State: | 2.14 / 10,000 pop. |
| This county: | 2.12 / 10,000 pop. |
| California: | 0.62 / 10,000 pop. |
| Trinity County: | 6.36 / 10,000 pop. |
| California: | 1.49 / 10,000 pop. |
| This county: | 8.49 / 10,000 pop. |
| State: | 7.42 / 10,000 pop. |
| Trinity County: | 9.2% |
| California: | 7.3% |
| Trinity County: | 23.2% |
| State: | 21.3% |
| Here: | 19.7% |
| State: | 17.9% |
Agriculture in Trinity County:
Average size of farms: 781 acresAverage value of agricultural products sold per farm: $13,107
Average value of crops sold per acre for harvested cropland: $908.22
The value of nursery, greenhouse, floriculture, and sod as a percentage of the total market value of agricultural products sold: 0.98%
The value of livestock, poultry, and their products as a percentage of the total market value of agricultural products sold: 62.79%
Harvested cropland as a percentage of land in farms: 0.69%
Irrigated harvested cropland as a percentage of land in farms: 70.07%
Average market value of all machinery and equipment per farm: $26,660
The percentage of farms operated by a family or individual: 85.19%
Average age of principal farm operators: 57 years
Average number of cattle and calves per 100 acres of all land in farms: 4.68
Milk cows as a percentage of all cattle and calves: 0.24%
Vegetables: 12 harvested acres
Land in orchards: 196 acres
Earthquake activity:
Trinity County-area historical earthquake activity is significantly above California state average. It is 4809% greater than the overall U.S. average.On 4/18/1906 at 13:12:21, a magnitude 7.9 (7.9 UK, Class: Major, Intensity: VIII - XII) earthquake occurred 184.5 miles away from Trinity County center, causing $524,000,000 total damage
On 1/31/1922 at 13:17:28, a magnitude 7.6 (7.6 UK) earthquake occurred 130.2 miles away from the county center
On 4/25/1992 at 18:06:04, a magnitude 7.2 (6.3 MB, 7.1 MS, 7.2 MW, 7.1 MW, Depth: 9.4 mi) earthquake occurred 56.9 miles away from the county center, causing $75,000,000 total damage
On 11/8/1980 at 10:27:34, a magnitude 7.2 (6.2 MB, 7.2 MS, 7.2 MW, 7.0 ML) earthquake occurred 71.2 miles away from the county center
On 1/22/1923 at 09:04:18, a magnitude 7.2 (7.2 UK) earthquake occurred 119.0 miles away from Trinity County center
On 6/15/2005 at 02:50:54, a magnitude 7.2 (6.1 MB, 7.1 MS, 7.2 MW, 7.1 MW) earthquake occurred 156.4 miles away from the county center
Magnitude types: body-wave magnitude (MB), local magnitude (ML), surface-wave magnitude (MS), moment magnitude (MW)
Most recent natural disasters:
- California Wildfires, Incident Period: August 14, 2020 - September 26, 2020, FEMA Id: 4558, Natural disaster type: Fire
- California Covid-19 Pandemic, Incident Period: January 20, 2020, FEMA Id: 4482, Natural disaster type: Other
- California Severe Winter Storms, Flooding, Landslides, And Mudslides, Incident Period: February 24, 2019 - March 1, 2019, FEMA Id: 4434, Natural disaster type: Winter Storm, Mudslide, Landslide, Flood
- California Severe Winter Storms, Flooding, Landslides, And Mudslides, Incident Period: February 13, 2019 - February 15, 2019, FEMA Id: 4431, Natural disaster type: Winter Storm, Mudslide, Landslide, Flood
- California Severe Winter Storms, Flooding, Mudslides, Incident Period: February 1, 2017 - February 23, 2017, FEMA Id: 4308, Natural disaster type: Winter Storm, Mudslide, Flood
- California Severe Winter Storms, Flooding, And Mudslides, Incident Period: January 18, 2017 - January 23, 2017, FEMA Id: 4305, Natural disaster type: Winter Storm, Mudslide, Flood
- California Severe Winter Storms, Flooding, And Mudslides, Incident Period: January 3, 2017 - January 12, 2017, FEMA Id: 4301, Natural disaster type: Winter Storm, Mudslide, Flood
- California Wildfires, Incident Period: June 20, 2008 to August 20, 2008, Emergency Declared EM-3287: June 28, 2008, FEMA Id: 3287, Natural disaster type: Fire
- California Junction Fire, Incident Period: July 29, 2006 to August 02, 2006, Fire Management Assistance Declared: July 30, 2006, FEMA Id: 2662, Natural disaster type: Fire
- California Severe Storms, Flooding, Mudslides, and Landslides, Incident Period: December 17, 2005 to January 03, 2006, Major Disaster (Presidential) Declared DR-1628: February 03, 2006, FEMA Id: 1628, Natural disaster type: Storm, Mudslide, Landslide, Flood
- 13 other natural disasters have been reported since 1953.
The number of natural disasters in Trinity County (23) is greater than the US average (15).
Major Disasters (Presidential) Declared: 11
Emergencies Declared: 4
Causes of natural disasters: Floods: 16, Winter Storms: 9, Storms: 7, Landslides: 6, Mudslides: 6, Fires: 4, Drought: 1, Heavy Rain: 1, Hurricane: 1, Tornado: 1, Other: 1 (Note: some incidents may be assigned to more than one category).

Means of transportation to work:
- Drove a car alone: 3,154 (59.6%)
- Carpooled: 297 (5.6%)
- Bus: 42 (0.8%)
- Taxicab, motorcycle, or other means: 133 (2.5%)
- Bicycle: 11 (0.2%)
- Walked: 82 (1.5%)
- Worked at home: 1,802 (34.1%)


- Accommodation and food services (16%)
- Retail trade (13%)
- Agriculture, forestry, fishing and hunting (10%)
- Educational services (9%)
- Health care and social assistance (9%)
- Public administration (8%)
- Professional, scientific, and technical services (4%)

- Accommodation and food services (19%)
- Retail trade (16%)
- Agriculture, forestry, fishing and hunting (12%)
- Educational services (10%)
- Health care and social assistance (10%)
- Public administration (10%)
- Professional, scientific, and technical services (5%)

- Construction and extraction occupations (18%)
- Management occupations (18%)
- Food preparation and serving related occupations (8%)
- Material moving occupations (7%)
- Installation, maintenance, and repair occupations (7%)
- Building and grounds cleaning and maintenance occupations (5%)
- Farming, fishing, and forestry occupations (5%)

- Food preparation and serving related occupations (20%)
- Management occupations (19%)
- Sales and related occupations (9%)
- Office and administrative support occupations (8%)
- Personal care and service occupations (7%)
- Educational instruction, and library occupations (6%)
- Arts, design, entertainment, sports, and media occupations (5%)

- Dominican Republic (35%)
- Nepal (19%)
- Honduras (6%)
- Laos (5%)
- China, excluding Hong Kong and Taiwan (5%)
- Belarus (4%)
- Thailand (4%)

- American (32%)
- English (8%)
- Irish (6%)
- German (5%)
- Northern European (4%)
- Hungarian (4%)
- Italian (2%)


People in group quarters in Trinity County, California in 2010:
- 192 people in other noninstitutional facilities
- 102 people in state prisons
- 31 people in local jails and other municipal confinement facilities
- 24 people in nursing facilities/skilled-nursing facilities
- 11 people in correctional facilities intended for juveniles
- 9 people in college/university student housing
- 7 people in group homes intended for adults
- 5 people in workers' group living quarters and job corps centers
- 4 people in emergency and transitional shelters (with sleeping facilities) for people experiencing homelessness
People in group quarters in Trinity County, California in 2000:
- 129 people in state prisons
- 38 people in local jails and other confinement facilities (including police lockups)
- 27 people in religious group quarters
- 26 people in wards in general hospitals for patients who have no usual home elsewhere
- 10 people in other group homes
- 9 people in other noninstitutional group quarters
- 2 people in agriculture workers' dormitories on farms
7.91% of this county's 2021 resident taxpayers lived in other counties in 2020 ($51,911 average adjusted gross income)
| Here: | 7.91% |
| California average: | 5.19% |
10 or fewer of this county's residents moved from foreign countries.
6.03% relocated from other counties in California ($42,152 average AGI)
1.89% relocated from other states ($9,758 average AGI)
Trinity County: 1.89% California average: 1.56%

Top counties from which taxpayers relocated into this county between 2020 and 2021:
| from Humboldt County, CA | |
| from Shasta County, CA |
7.86% of this county's 2020 resident taxpayers moved to other counties in 2021 ($45,617 average adjusted gross income)
| Here: | 7.86% |
| California average: | 6.14% |
10 or fewer of this county's residents moved to foreign countries.
5.40% relocated to other counties in California ($32,913 average AGI)
2.46% relocated to other states ($12,703 average AGI)
Trinity County: 2.46% California average: 2.55%

Top counties to which taxpayers relocated from this county between 2020 and 2021:
| to Shasta County, CA | |
| to Humboldt County, CA |
Births per 1000 population from 1990 to 1999: 10.0
Births per 1000 population from 2000 to 2006: 8.1

Deaths per 1000 population from 1990 to 1999: 10.7
Deaths per 1000 population from 2000 to 2009: 11.0
Deaths per 1000 population from 2010 to 2020: 12.2

Infant deaths per 1000 live births from 1990 to 1999: 11.0
Infant deaths per 1000 live births from 2000 to 2006: 4.9

Persons under 19 years old without health insurance coverage in 2018: 4.6%


Persons enrolled in hospital insurance and/or supplemental medical insurance (Medicare) in July 1, 2007: 3,041 (2,326 aged, 715 disabled)
Children under 18 without health insurance coverage in 2007: 234 (10%)


Most common underlying causes of death in Trinity County, California in 1999 - 2019:
- Bronchus or lung, unspecified - Malignant neoplasms (216)
- Acute myocardial infarction, unspecified (113)
- Chronic obstructive pulmonary disease, unspecified (75)
- Atherosclerotic heart disease (65)
- Alzheimer disease, unspecified (10)
Population without health insurance coverage in 2000: 17%
Children under 18 without health insurance coverage in 2000: 14%
Suicides per 1,000,000 population from 2000 to 2006: 311.0. This is less than state average.

- Firearm - 246.6
- Other - 64.3
Household type by relationship:
Households: 15,757- Male householders: 2,645 (1,265 living alone), Female householders: 2,937 (1,069 living alone)
2,123 spouses (2,113 opposite-sex spouses), 400 unmarried partners, (373 opposite-sex unmarried partners), 4,017 children (3,723 natural, 94 adopted, 197 stepchildren), 314 grandchildren, 182 brothers or sisters, 145 parents, 0 foster children, 498 other relatives, 2,118 non-relatives
- In group quarters: 301
Size of family households: 1,852 2-persons, 257 3-persons, 347 4-persons, 138 5-persons, 154 6-persons, 43 7-or-more-persons.
Size of nonfamily households: 2,330 1-person, 438 2-persons, 63 3-persons, 11 4-persons.
975 married couples with children.
1,325 single-parent households (701 men, 624 women).
92.6% of residents of Trinity speak English at home.
3.6% of residents speak Spanish at home (17% speak English very well, 15% speak English well, 66% speak English not well, 2% don't speak English at all).
1.8% of residents speak other Indo-European language at home (91% speak English very well, 2% speak English well, 7% speak English not well).
1.9% of residents speak Asian or Pacific Island language at home (83% speak English very well, 7% speak English well, 10% speak English not well).
In fiscal year 2004:
Federal Government expenditure: $103,101,000 ($7,542 per capita)
Department of Defense expenditure: $2,244,000
Federal direct payments to individuals for retirement and disability: $46,862,000
Federal other direct payments to individuals: $19,996,000
Federal direct payments not to individuals: $24,000
Federal grants: $20,313,000
Federal procurement contracts: $5,001,000 ($28,000 Department of Defense)
Federal salaries and wages: $10,905,000 ($308,000 Department of Defense)
Federal Government direct loans: $210,000
Federal guaranteed/insured loans: $1,934,000
Federal Government insurance: $18,856,000
Population change from April 1, 2000 to July 1, 2005:
Births: 543| Here: | 40 per 1000 residents |
| State: | 77 per 1000 residents |
Deaths: 724
| Here: | 53 per 1000 residents |
| State: | 34 per 1000 residents |
Net international migration: +21
| Here: | +2 per 1000 residents |
| State: | +39 per 1000 residents |
Net internal migration: +788
| Here: | |
| State: |

Total withdrawal of fresh water for public supply: 1.31 millions of gallons per day (all from surface)
| Here: | 5.2 |
| State: | 6.0 |
| Here: | 4.5 |
| State: | 3.9 |

- Year house built in Trinity County, California
- 02020 or later
- 4322010 to 2019
- 9852000 to 2009
- 7761990 to 1999
- 1,6521980 to 1989
- 1,9381970 to 1979
- 6551960 to 1969
- 9141950 to 1959
- 3041940 to 1949
- 5621939 or earlier

- Rooms in owner-occupied houses in Trinity County, California
- 141 room
- 2132 rooms
- 5003 rooms
- 6504 rooms
- 9165 rooms
- 7936 rooms
- 4107 rooms
- 3338 rooms
- 1789+ rooms

- Rooms in renter-occupied apartments in Trinity County, California
- 371 room
- 1422 rooms
- 3163 rooms
- 3304 rooms
- 3475 rooms
- 2706 rooms
- 1257 rooms
- 148 rooms
- 329+ rooms

- Bedrooms in owner-occupied houses in Trinity County, California
- 13no bedroom
- 3911 bedroom
- 1,2782 bedrooms
- 1,8773 bedrooms
- 3584 bedrooms
- 285+ bedrooms

- Bedrooms in renter-occupied apartments in Trinity County, California
- 37no bedroom
- 3821 bedroom
- 4722 bedrooms
- 5753 bedrooms
- 1484 bedrooms
- 05+ bedrooms

- Cars and other vehicles available in Trinity County in owner-occupied houses/condos
- 86no vehicle
- 1,2761 vehicle
- 1,5402 vehicles
- 6033 vehicles
- 4044 vehicles
- 745+ vehicles

- Cars and other vehicles available in Trinity County in renter-occupied apartments
- 162no vehicle
- 7111 vehicle
- 5002 vehicles
- 1343 vehicles
- 1114 vehicles
- 45+ vehicles
85.9% of Trinity County residents lived in the same house 1 years ago.
Out of people who lived in different houses, 30% lived in this county.
Out of people who lived in different counties, 71% lived in California.
| Trinity County: | 85.9% |
| State average: | 88.9% |
Place of birth for U.S.-born residents:
- This state: 11,145
- Other state: 3,375
- Northeast: 823
- Midwest: 693
- South: 686
- West: 1,173


- 45.8%Wood
- 26.7%Electricity
- 11.6%Bottled, tank, or LP gas
- 9.0%Fuel oil, kerosene, etc.
- 6.8%Utility gas
- 0.2%Solar energy

- 40.9%Wood
- 36.6%Electricity
- 11.7%Bottled, tank, or LP gas
- 5.2%Fuel oil, kerosene, etc.
- 5.0%Utility gas
- 0.6%Other fuel
Private vs. public school enrollment:
| Here: | 5.1% |
| California: | 10.5% |
| Here: | 3.4% |
| California: | 8.5% |
| Here: | 28.4% |
| California: | 15.9% |


Trinity County government finances - Expenditure in 2020:
- Assistance and Subsidies - Public Welfare, Federal Categorical Assistance Programs: $3,000
Public Welfare, Federal Categorical Assistance Programs: $2,000
- Charges - Other: $13,861,000
Other: $13,777,000
Solid Waste Management: $4,671,000
Solid Waste Management: $4,246,000
Sewerage: $2,814,000
Sewerage: $2,757,000
Parks and Recreation: $217,000
Natural Resources - Other: $179,000
Parks and Recreation: $170,000
Housing and Community Development: $148,000
Natural Resources - Other: $141,000
Regular Highways: $30,000
Regular Highways: $24,000
- Construction - Solid Waste Management: $5,081,000
Health - Other: $1,004,000
Transit Utilities: $519,000
Housing and Community Development: $435,000
Health - Other: $40,000
Regular Highways: $6,000
- Current Operations - Transit Utilities: $10,150,000
Transit Utilities: $9,564,000
Health - Other: $8,297,000
Health - Other: $8,241,000
Regular Highways: $6,285,000
General - Other: $6,046,000
General - Other: $5,474,000
Central Staff Services: $5,268,000
Financial Administration: $5,058,000
Solid Waste Management: $4,688,000
Police Protection: $4,685,000
Regular Highways: $4,613,000
Financial Administration: $4,527,000
Central Staff Services: $4,407,000
Police Protection: $3,824,000
Solid Waste Management: $3,813,000
Correctional Institutions: $3,016,000
Sewerage: $2,921,000
Sewerage: $2,884,000
Natural Resources - Other: $2,313,000
Judicial and Legal Services: $2,214,000
Correctional Institutions: $2,197,000
Public Welfare - Other: $2,124,000
Public Welfare - Other: $2,066,000
Judicial and Legal Services: $1,905,000
Parks and Recreation: $1,884,000
General Public Buildings: $1,715,000
General Public Buildings: $1,692,000
Natural Resources - Other: $1,571,000
Parks and Recreation: $1,556,000
Libraries: $1,390,000
Protective Inspection and Regulation - Other: $1,386,000
Libraries: $1,375,000
Protective Inspection and Regulation - Other: $1,220,000
Housing and Community Development: $1,212,000
Housing and Community Development: $1,018,000
Public Welfare, Vendor Payments for Other Purposes: $154,000
Public Welfare, Vendor Payments for Other Purposes: $83,000
Public Welfare, Vendor Payments for Medical Care: $5,000
- Federal Intergovernmental - Highways: $1,498,000
Highways: $833,000
Public Welfare: $771,000
Public Welfare: $749,000
Other: $63,000
Other: $53,000
- General - Interest on Debt: $2,000
- Intergovernmental to Local - Other - Health - Other: $809,000
Other - Health - Other: $584,000
Other - Regular Highways: $556,000
Other - Regular Highways: $548,000
Other - Transit Utilities: $501,000
Other - Transit Utilities: $479,000
- Local Intergovernmental - Other: $1,517,000
Other: $1,068,000
General Local Government Support: $395,000
General Local Government Support: $298,000
Transit Utilities: $250,000
Transit Utilities: $194,000
Highways: $33,000
Highways: $20,000
Health and Hospitals: $10,000
Health and Hospitals: $1,000
- Long Term Debt - Beginning Outstanding - Unspecified Public Purpose: $142,000
Outstanding Unspecified Public Purpose: $101,000
Retired Unspecified Public Purpose: $67,000
Beginning Outstanding - Unspecified Public Purpose: $67,000
Retired Unspecified Public Purpose: $41,000
- Miscellaneous - Interest Earnings: $2,498,000
General Revenue - Other: $2,094,000
General Revenue - Other: $1,885,000
Interest Earnings: $755,000
Rents: $493,000
Rents: $484,000
Sale of Property: $276,000
Donations From Private Sources: $275,000
Donations From Private Sources: $266,000
Sale of Property: $83,000
Special Assessments: $43,000
Special Assessments: $31,000
- Other Capital Outlay - General Public Building: $2,262,000
General Public Building: $1,153,000
Parks and Recreation: $1,134,000
Housing and Community Development: $1,046,000
Regular Highways: $803,000
Parks and Recreation: $761,000
General - Other: $731,000
Regular Highways: $496,000
Housing and Community Development: $472,000
Correctional Institutions: $426,000
Police Protection: $417,000
Transit Utilities: $320,000
Health - Other: $298,000
Health - Other: $297,000
Police Protection: $261,000
Financial Administration: $225,000
Sewerage: $203,000
Sewerage: $131,000
Libraries: $129,000
General - Other: $102,000
Libraries: $77,000
Central Staff Services: $56,000
Transit Utilities: $46,000
Public Welfare - Other: $34,000
Central Staff Services: $11,000
Correctional Institutions: $11,000
- Other Funds - Cash and Securities: $93,832,000
Cash and Securities: $70,822,000
- Revenue - Transit Utilities: $102,000
- State Intergovernmental - Public Welfare: $4,461,000
Public Welfare: $4,330,000
Highways: $3,620,000
Highways: $3,049,000
Transit Utilities: $856,000
Other: $733,000
Other: $642,000
Transit Utilities: $605,000
Health and Hospitals: $112,000
Health and Hospitals: $102,000
General Local Government Support: $57,000
General Local Government Support: $44,000
- Tax - Property: $36,060,000
Property: $24,956,000
General Sales and Gross Receipts: $22,379,000
General Sales and Gross Receipts: $18,964,000
Other License: $3,198,000
Other License: $2,398,000
Motor Vehicle License: $73,000
Motor Vehicle License: $56,000
- Total Salaries and Wages: $30,266,000
: $27,649,000
- Water Utilities - Interest on Debt: $6,000
Trinity County government finances - Revenue in 2020:
- Assistance and Subsidies - Public Welfare, Federal Categorical Assistance Programs: $3,000
Public Welfare, Federal Categorical Assistance Programs: $2,000
- Charges - Other: $13,861,000
Other: $13,777,000
Solid Waste Management: $4,671,000
Solid Waste Management: $4,246,000
Sewerage: $2,814,000
Sewerage: $2,757,000
Parks and Recreation: $217,000
Natural Resources - Other: $179,000
Parks and Recreation: $170,000
Housing and Community Development: $148,000
Natural Resources - Other: $141,000
Regular Highways: $30,000
Regular Highways: $24,000
- Construction - Solid Waste Management: $5,081,000
Health - Other: $1,004,000
Transit Utilities: $519,000
Housing and Community Development: $435,000
Health - Other: $40,000
Regular Highways: $6,000
- Current Operations - Transit Utilities: $10,150,000
Transit Utilities: $9,564,000
Health - Other: $8,297,000
Health - Other: $8,241,000
Regular Highways: $6,285,000
General - Other: $6,046,000
General - Other: $5,474,000
Central Staff Services: $5,268,000
Financial Administration: $5,058,000
Solid Waste Management: $4,688,000
Police Protection: $4,685,000
Regular Highways: $4,613,000
Financial Administration: $4,527,000
Central Staff Services: $4,407,000
Police Protection: $3,824,000
Solid Waste Management: $3,813,000
Correctional Institutions: $3,016,000
Sewerage: $2,921,000
Sewerage: $2,884,000
Natural Resources - Other: $2,313,000
Judicial and Legal Services: $2,214,000
Correctional Institutions: $2,197,000
Public Welfare - Other: $2,124,000
Public Welfare - Other: $2,066,000
Judicial and Legal Services: $1,905,000
Parks and Recreation: $1,884,000
General Public Buildings: $1,715,000
General Public Buildings: $1,692,000
Natural Resources - Other: $1,571,000
Parks and Recreation: $1,556,000
Libraries: $1,390,000
Protective Inspection and Regulation - Other: $1,386,000
Libraries: $1,375,000
Protective Inspection and Regulation - Other: $1,220,000
Housing and Community Development: $1,212,000
Housing and Community Development: $1,018,000
Public Welfare, Vendor Payments for Other Purposes: $154,000
Public Welfare, Vendor Payments for Other Purposes: $83,000
Public Welfare, Vendor Payments for Medical Care: $5,000
- Federal Intergovernmental - Highways: $1,498,000
Highways: $833,000
Public Welfare: $771,000
Public Welfare: $749,000
Other: $63,000
Other: $53,000
- General - Interest on Debt: $2,000
- Intergovernmental to Local - Other - Health - Other: $809,000
Other - Health - Other: $584,000
Other - Regular Highways: $556,000
Other - Regular Highways: $548,000
Other - Transit Utilities: $501,000
Other - Transit Utilities: $479,000
- Local Intergovernmental - Other: $1,517,000
Other: $1,068,000
General Local Government Support: $395,000
General Local Government Support: $298,000
Transit Utilities: $250,000
Transit Utilities: $194,000
Highways: $33,000
Highways: $20,000
Health and Hospitals: $10,000
Health and Hospitals: $1,000
- Long Term Debt - Beginning Outstanding - Unspecified Public Purpose: $142,000
Outstanding Unspecified Public Purpose: $101,000
Retired Unspecified Public Purpose: $67,000
Beginning Outstanding - Unspecified Public Purpose: $67,000
Retired Unspecified Public Purpose: $41,000
- Miscellaneous - Interest Earnings: $2,498,000
General Revenue - Other: $2,094,000
General Revenue - Other: $1,885,000
Interest Earnings: $755,000
Rents: $493,000
Rents: $484,000
Sale of Property: $276,000
Donations From Private Sources: $275,000
Donations From Private Sources: $266,000
Sale of Property: $83,000
Special Assessments: $43,000
Special Assessments: $31,000
- Other Capital Outlay - General Public Building: $2,262,000
General Public Building: $1,153,000
Parks and Recreation: $1,134,000
Housing and Community Development: $1,046,000
Regular Highways: $803,000
Parks and Recreation: $761,000
General - Other: $731,000
Regular Highways: $496,000
Housing and Community Development: $472,000
Correctional Institutions: $426,000
Police Protection: $417,000
Transit Utilities: $320,000
Health - Other: $298,000
Health - Other: $297,000
Police Protection: $261,000
Financial Administration: $225,000
Sewerage: $203,000
Sewerage: $131,000
Libraries: $129,000
General - Other: $102,000
Libraries: $77,000
Central Staff Services: $56,000
Transit Utilities: $46,000
Public Welfare - Other: $34,000
Central Staff Services: $11,000
Correctional Institutions: $11,000
- Other Funds - Cash and Securities: $93,832,000
Cash and Securities: $70,822,000
- Revenue - Transit Utilities: $102,000
- State Intergovernmental - Public Welfare: $4,461,000
Public Welfare: $4,330,000
Highways: $3,620,000
Highways: $3,049,000
Transit Utilities: $856,000
Other: $733,000
Other: $642,000
Transit Utilities: $605,000
Health and Hospitals: $112,000
Health and Hospitals: $102,000
General Local Government Support: $57,000
General Local Government Support: $44,000
- Tax - Property: $36,060,000
Property: $24,956,000
General Sales and Gross Receipts: $22,379,000
General Sales and Gross Receipts: $18,964,000
Other License: $3,198,000
Other License: $2,398,000
Motor Vehicle License: $73,000
Motor Vehicle License: $56,000
- Total Salaries and Wages: $30,266,000
: $27,649,000
- Water Utilities - Interest on Debt: $6,000
Trinity County government finances - Debt in 2020:
- Assistance and Subsidies - Public Welfare, Federal Categorical Assistance Programs: $3,000
Public Welfare, Federal Categorical Assistance Programs: $2,000
- Charges - Other: $13,861,000
Other: $13,777,000
Solid Waste Management: $4,671,000
Solid Waste Management: $4,246,000
Sewerage: $2,814,000
Sewerage: $2,757,000
Parks and Recreation: $217,000
Natural Resources - Other: $179,000
Parks and Recreation: $170,000
Housing and Community Development: $148,000
Natural Resources - Other: $141,000
Regular Highways: $30,000
Regular Highways: $24,000
- Construction - Solid Waste Management: $5,081,000
Health - Other: $1,004,000
Transit Utilities: $519,000
Housing and Community Development: $435,000
Health - Other: $40,000
Regular Highways: $6,000
- Current Operations - Transit Utilities: $10,150,000
Transit Utilities: $9,564,000
Health - Other: $8,297,000
Health - Other: $8,241,000
Regular Highways: $6,285,000
General - Other: $6,046,000
General - Other: $5,474,000
Central Staff Services: $5,268,000
Financial Administration: $5,058,000
Solid Waste Management: $4,688,000
Police Protection: $4,685,000
Regular Highways: $4,613,000
Financial Administration: $4,527,000
Central Staff Services: $4,407,000
Police Protection: $3,824,000
Solid Waste Management: $3,813,000
Correctional Institutions: $3,016,000
Sewerage: $2,921,000
Sewerage: $2,884,000
Natural Resources - Other: $2,313,000
Judicial and Legal Services: $2,214,000
Correctional Institutions: $2,197,000
Public Welfare - Other: $2,124,000
Public Welfare - Other: $2,066,000
Judicial and Legal Services: $1,905,000
Parks and Recreation: $1,884,000
General Public Buildings: $1,715,000
General Public Buildings: $1,692,000
Natural Resources - Other: $1,571,000
Parks and Recreation: $1,556,000
Libraries: $1,390,000
Protective Inspection and Regulation - Other: $1,386,000
Libraries: $1,375,000
Protective Inspection and Regulation - Other: $1,220,000
Housing and Community Development: $1,212,000
Housing and Community Development: $1,018,000
Public Welfare, Vendor Payments for Other Purposes: $154,000
Public Welfare, Vendor Payments for Other Purposes: $83,000
Public Welfare, Vendor Payments for Medical Care: $5,000
- Federal Intergovernmental - Highways: $1,498,000
Highways: $833,000
Public Welfare: $771,000
Public Welfare: $749,000
Other: $63,000
Other: $53,000
- General - Interest on Debt: $2,000
- Intergovernmental to Local - Other - Health - Other: $809,000
Other - Health - Other: $584,000
Other - Regular Highways: $556,000
Other - Regular Highways: $548,000
Other - Transit Utilities: $501,000
Other - Transit Utilities: $479,000
- Local Intergovernmental - Other: $1,517,000
Other: $1,068,000
General Local Government Support: $395,000
General Local Government Support: $298,000
Transit Utilities: $250,000
Transit Utilities: $194,000
Highways: $33,000
Highways: $20,000
Health and Hospitals: $10,000
Health and Hospitals: $1,000
- Long Term Debt - Beginning Outstanding - Unspecified Public Purpose: $142,000
Outstanding Unspecified Public Purpose: $101,000
Retired Unspecified Public Purpose: $67,000
Beginning Outstanding - Unspecified Public Purpose: $67,000
Retired Unspecified Public Purpose: $41,000
- Miscellaneous - Interest Earnings: $2,498,000
General Revenue - Other: $2,094,000
General Revenue - Other: $1,885,000
Interest Earnings: $755,000
Rents: $493,000
Rents: $484,000
Sale of Property: $276,000
Donations From Private Sources: $275,000
Donations From Private Sources: $266,000
Sale of Property: $83,000
Special Assessments: $43,000
Special Assessments: $31,000
- Other Capital Outlay - General Public Building: $2,262,000
General Public Building: $1,153,000
Parks and Recreation: $1,134,000
Housing and Community Development: $1,046,000
Regular Highways: $803,000
Parks and Recreation: $761,000
General - Other: $731,000
Regular Highways: $496,000
Housing and Community Development: $472,000
Correctional Institutions: $426,000
Police Protection: $417,000
Transit Utilities: $320,000
Health - Other: $298,000
Health - Other: $297,000
Police Protection: $261,000
Financial Administration: $225,000
Sewerage: $203,000
Sewerage: $131,000
Libraries: $129,000
General - Other: $102,000
Libraries: $77,000
Central Staff Services: $56,000
Transit Utilities: $46,000
Public Welfare - Other: $34,000
Central Staff Services: $11,000
Correctional Institutions: $11,000
- Other Funds - Cash and Securities: $93,832,000
Cash and Securities: $70,822,000
- Revenue - Transit Utilities: $102,000
- State Intergovernmental - Public Welfare: $4,461,000
Public Welfare: $4,330,000
Highways: $3,620,000
Highways: $3,049,000
Transit Utilities: $856,000
Other: $733,000
Other: $642,000
Transit Utilities: $605,000
Health and Hospitals: $112,000
Health and Hospitals: $102,000
General Local Government Support: $57,000
General Local Government Support: $44,000
- Tax - Property: $36,060,000
Property: $24,956,000
General Sales and Gross Receipts: $22,379,000
General Sales and Gross Receipts: $18,964,000
Other License: $3,198,000
Other License: $2,398,000
Motor Vehicle License: $73,000
Motor Vehicle License: $56,000
- Total Salaries and Wages: $30,266,000
: $27,649,000
- Water Utilities - Interest on Debt: $6,000
Trinity County government finances - Cash and Securities in 2020:
- Assistance and Subsidies - Public Welfare, Federal Categorical Assistance Programs: $3,000
Public Welfare, Federal Categorical Assistance Programs: $2,000
- Charges - Other: $13,861,000
Other: $13,777,000
Solid Waste Management: $4,671,000
Solid Waste Management: $4,246,000
Sewerage: $2,814,000
Sewerage: $2,757,000
Parks and Recreation: $217,000
Natural Resources - Other: $179,000
Parks and Recreation: $170,000
Housing and Community Development: $148,000
Natural Resources - Other: $141,000
Regular Highways: $30,000
Regular Highways: $24,000
- Construction - Solid Waste Management: $5,081,000
Health - Other: $1,004,000
Transit Utilities: $519,000
Housing and Community Development: $435,000
Health - Other: $40,000
Regular Highways: $6,000
- Current Operations - Transit Utilities: $10,150,000
Transit Utilities: $9,564,000
Health - Other: $8,297,000
Health - Other: $8,241,000
Regular Highways: $6,285,000
General - Other: $6,046,000
General - Other: $5,474,000
Central Staff Services: $5,268,000
Financial Administration: $5,058,000
Solid Waste Management: $4,688,000
Police Protection: $4,685,000
Regular Highways: $4,613,000
Financial Administration: $4,527,000
Central Staff Services: $4,407,000
Police Protection: $3,824,000
Solid Waste Management: $3,813,000
Correctional Institutions: $3,016,000
Sewerage: $2,921,000
Sewerage: $2,884,000
Natural Resources - Other: $2,313,000
Judicial and Legal Services: $2,214,000
Correctional Institutions: $2,197,000
Public Welfare - Other: $2,124,000
Public Welfare - Other: $2,066,000
Judicial and Legal Services: $1,905,000
Parks and Recreation: $1,884,000
General Public Buildings: $1,715,000
General Public Buildings: $1,692,000
Natural Resources - Other: $1,571,000
Parks and Recreation: $1,556,000
Libraries: $1,390,000
Protective Inspection and Regulation - Other: $1,386,000
Libraries: $1,375,000
Protective Inspection and Regulation - Other: $1,220,000
Housing and Community Development: $1,212,000
Housing and Community Development: $1,018,000
Public Welfare, Vendor Payments for Other Purposes: $154,000
Public Welfare, Vendor Payments for Other Purposes: $83,000
Public Welfare, Vendor Payments for Medical Care: $5,000
- Federal Intergovernmental - Highways: $1,498,000
Highways: $833,000
Public Welfare: $771,000
Public Welfare: $749,000
Other: $63,000
Other: $53,000
- General - Interest on Debt: $2,000
- Intergovernmental to Local - Other - Health - Other: $809,000
Other - Health - Other: $584,000
Other - Regular Highways: $556,000
Other - Regular Highways: $548,000
Other - Transit Utilities: $501,000
Other - Transit Utilities: $479,000
- Local Intergovernmental - Other: $1,517,000
Other: $1,068,000
General Local Government Support: $395,000
General Local Government Support: $298,000
Transit Utilities: $250,000
Transit Utilities: $194,000
Highways: $33,000
Highways: $20,000
Health and Hospitals: $10,000
Health and Hospitals: $1,000
- Long Term Debt - Beginning Outstanding - Unspecified Public Purpose: $142,000
Outstanding Unspecified Public Purpose: $101,000
Retired Unspecified Public Purpose: $67,000
Beginning Outstanding - Unspecified Public Purpose: $67,000
Retired Unspecified Public Purpose: $41,000
- Miscellaneous - Interest Earnings: $2,498,000
General Revenue - Other: $2,094,000
General Revenue - Other: $1,885,000
Interest Earnings: $755,000
Rents: $493,000
Rents: $484,000
Sale of Property: $276,000
Donations From Private Sources: $275,000
Donations From Private Sources: $266,000
Sale of Property: $83,000
Special Assessments: $43,000
Special Assessments: $31,000
- Other Capital Outlay - General Public Building: $2,262,000
General Public Building: $1,153,000
Parks and Recreation: $1,134,000
Housing and Community Development: $1,046,000
Regular Highways: $803,000
Parks and Recreation: $761,000
General - Other: $731,000
Regular Highways: $496,000
Housing and Community Development: $472,000
Correctional Institutions: $426,000
Police Protection: $417,000
Transit Utilities: $320,000
Health - Other: $298,000
Health - Other: $297,000
Police Protection: $261,000
Financial Administration: $225,000
Sewerage: $203,000
Sewerage: $131,000
Libraries: $129,000
General - Other: $102,000
Libraries: $77,000
Central Staff Services: $56,000
Transit Utilities: $46,000
Public Welfare - Other: $34,000
Central Staff Services: $11,000
Correctional Institutions: $11,000
- Other Funds - Cash and Securities: $93,832,000
Cash and Securities: $70,822,000
- Revenue - Transit Utilities: $102,000
- State Intergovernmental - Public Welfare: $4,461,000
Public Welfare: $4,330,000
Highways: $3,620,000
Highways: $3,049,000
Transit Utilities: $856,000
Other: $733,000
Other: $642,000
Transit Utilities: $605,000
Health and Hospitals: $112,000
Health and Hospitals: $102,000
General Local Government Support: $57,000
General Local Government Support: $44,000
- Tax - Property: $36,060,000
Property: $24,956,000
General Sales and Gross Receipts: $22,379,000
General Sales and Gross Receipts: $18,964,000
Other License: $3,198,000
Other License: $2,398,000
Motor Vehicle License: $73,000
Motor Vehicle License: $56,000
- Total Salaries and Wages: $30,266,000
: $27,649,000
- Water Utilities - Interest on Debt: $6,000
Supplemental Security Income (SSI) in 2006:
- Total number of recipients: 747
- Number of aged recipients: 76
- Number of blind and disabled recipients: 671
- Number of recipients under 18: 31
- Number of recipients between 18 and 64: 559
- Number of recipients older than 64: 157
- Number of recipients also receiving OASDI: 355
- Amount of payments (thousands of dollars): 423
| Most common first names in Trinity County, CA among deceased individuals | ||
| Name | Count | Lived (average) |
|---|---|---|
| Robert | 66 | 71.2 years |
| William | 65 | 75.1 years |
| John | 61 | 72.6 years |
| James | 54 | 69.5 years |
| Charles | 49 | 73.8 years |
| George | 37 | 73.9 years |
| Mary | 34 | 79.7 years |
| Richard | 33 | 70.8 years |
| Dorothy | 32 | 77.9 years |
| Donald | 29 | 69.2 years |
| Most common last names in Trinity County, CA among deceased individuals | ||
| Last name | Count | Lived (average) |
|---|---|---|
| Smith | 42 | 75.4 years |
| Brown | 29 | 75.0 years |
| Miller | 19 | 79.8 years |
| Jackson | 16 | 82.2 years |
| Johnson | 16 | 77.3 years |
| Wilson | 16 | 70.1 years |
| Moore | 14 | 77.3 years |
| Jones | 14 | 77.5 years |
| Adams | 13 | 75.4 years |
| Duncan | 13 | 77.9 years |
| Businesses in Trinity County, CA | ||||
| Name | Count | Name | Count | |
|---|---|---|---|---|
| Ace Hardware | 1 | RadioShack | 1 | |
| Burger King | 1 | Starbucks | 1 | |
| CVS | 1 | True Value | 2 | |
| Curves | 1 | U-Haul | 2 | |
| FedEx | 1 | U.S. Cellular | 1 | |
| Nike | 1 | UPS | 2 | |
Trinity County on our top lists:
- #19 on the list of "Top 101 counties with highest percentage of residents voting for 3rd party candidates in the 2012 Presidential Election"