Tyler County, West Virginia (WV)
County owner-occupied free and clear houses and condos in 2010: 1,756
County owner-occupied houses and condos in 2000: 3,211
Renter-occupied apartments: 691 (it was 625 in 2000)
| % of renters here: | 16% |
| State: | 27% |
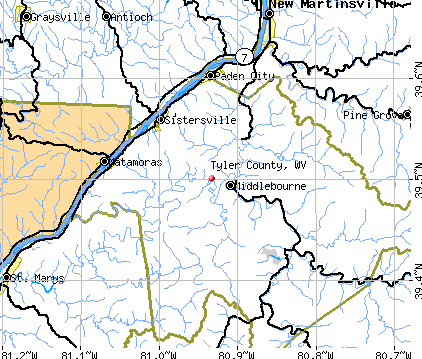
Land area: 258 sq. mi.
Water area: 3.1 sq. mi.
Population density: 32 people per square mile (low).
Industries providing employment: Educational, health and social services (32.5%), Retail trade (11.2%), Manufacturing (10.7%), Transportation and warehousing,and utilities (10.1%).
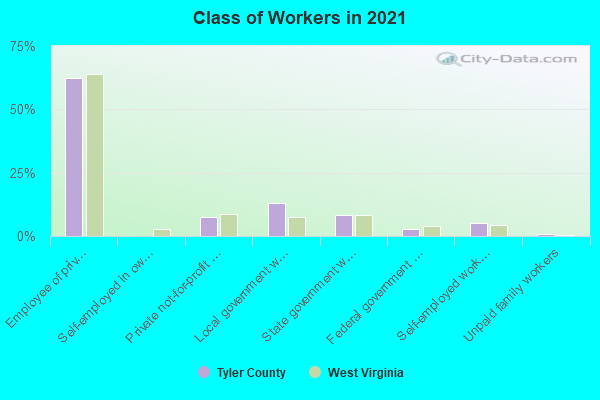
Type of workers:
- Private wage or salary: 71%
- Government: 25%
- Self-employed, not incorporated: 4%
- Unpaid family work: 0%
- OSM Map
- General Map
- Google Map
- MSN Map

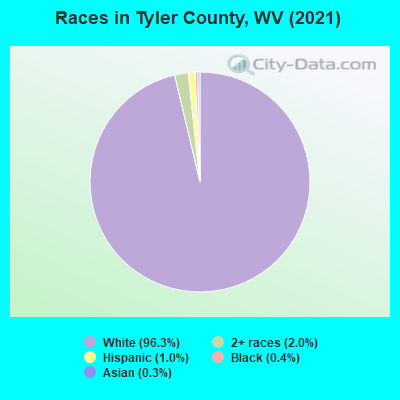
- 7,88596.1%White Non-Hispanic Alone
- 1421.7%Hispanic or Latino
- 1181.4%Two or more races
- 600.7%Black Non-Hispanic Alone
- 10.01%American Indian and Alaska Native alone
| Median resident age: | 48.9 years |
| West Virginia median age: | 42.9 years |
| Males: 4,113 | |
| Females: 4,140 |

 | Is Natural Gas bad for West Virginia? (209 replies) |
| Considering West Virginia (42 replies) |
| More Bad News For WV But This Time Parkersburg (10 replies) |
| Natural Gas Busniess News - Northern Panhandle (80 replies) |
| Northern Panhandle to Pennsylvania (55 replies) |
| Tyler County RENT? (9 replies) |
| Tyler County: | 2.0 people |
| West Virginia: | 2 people |
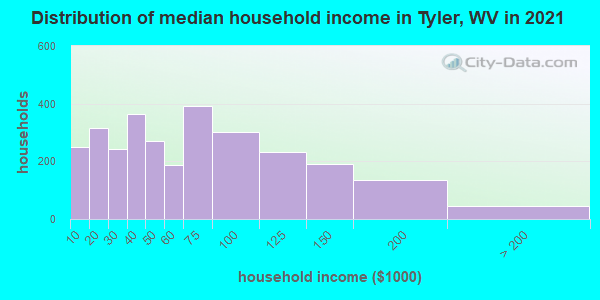
Estimated median household income in 2022: $58,215 ($29,290 in 1999)
| This county: | $58,215 |
| West Virginia: | $54,329 |
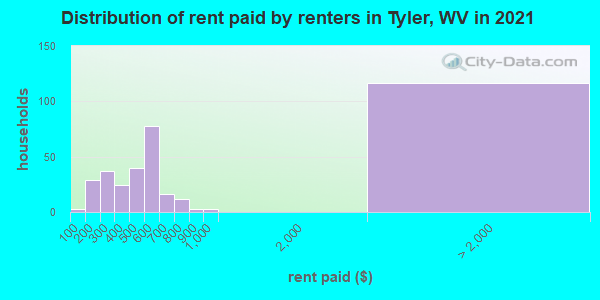
Median contract rent in 2022 for apartments: $436 (lower quartile is $267, upper quartile is $555)
| This county: | $436 |
| State: | $606 |
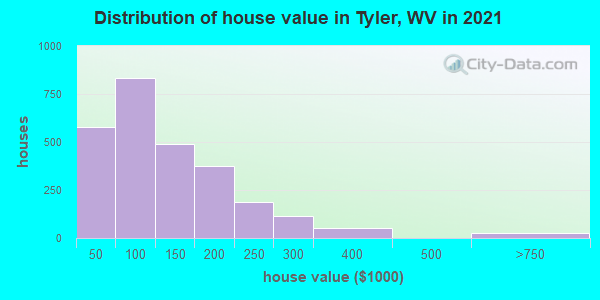
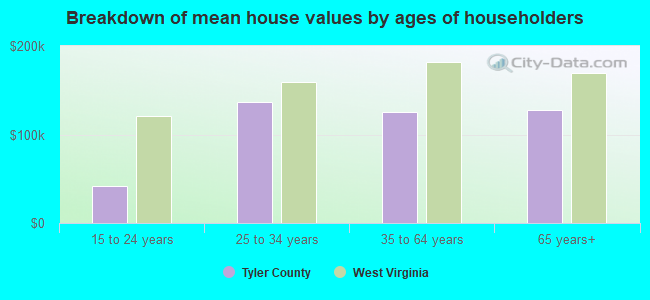
Estimated median house or condo value in 2022: $116,804 (it was $59,800 in 2000)
| Tyler: | $116,804 |
| West Virginia: | $155,100 |
Mean price in 2022:
Median monthly housing costs for homes and condos with a mortgage: $956Detached houses: $160,783
Here: $160,783 State: $206,655 Townhouses or other attached units: $202,005
Here: $202,005 State: $205,683 Mobile homes: $66,832
Here: $66,832 State: $63,963
Median monthly housing costs for units without a mortgage: $335
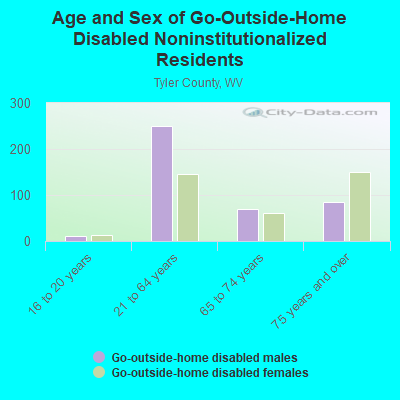
Institutionalized population: 64
Crime in 2021 (reported by the sheriff's office or county police, not the county total):
- Murders: 1
- Rapes: 0
- Robberies: 0
- Assaults: 0
- Burglaries: 6
- Thefts: 6
- Auto thefts: 2
Crime in 2020 (reported by the sheriff's office or county police, not the county total):
- Murders: 0
- Rapes: 3
- Robberies: 0
- Assaults: 3
- Burglaries: 3
- Thefts: 5
- Auto thefts: 1
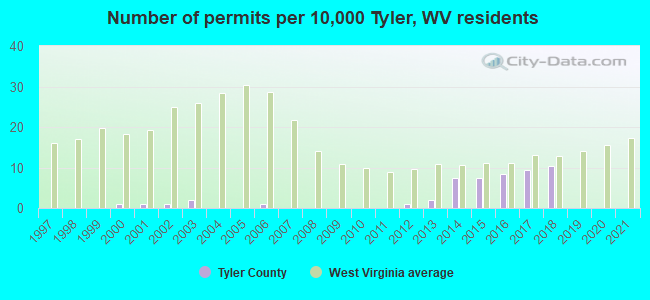
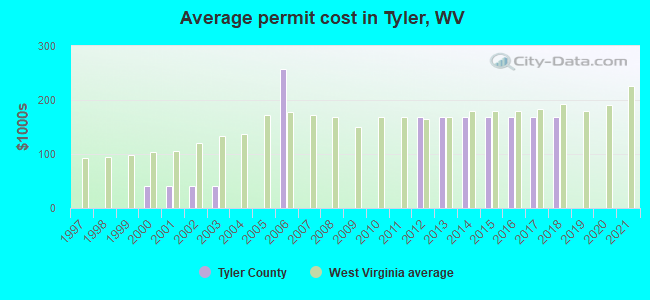
Single-family new house construction building permits:
- 2022: 0 buildings
- 2021: 0 buildings
- 2020: 0 buildings
- 2019: 0 buildings
- 2018: 10 buildings, average cost: $168,000
- 2017: 9 buildings, average cost: $168,000
- 2016: 8 buildings, average cost: $168,000
- 2015: 7 buildings, average cost: $168,000
- 2014: 7 buildings, average cost: $168,000
- 2013: 2 buildings, average cost: $168,000
- 2012: 1 building, cost: $168,000
- 2011: 0 buildings
- 2010: 0 buildings
- 2009: 0 buildings
- 2008: 0 buildings
- 2007: 0 buildings
- 2006: 1 building, cost: $257,000
- 2005: 0 buildings
- 2004: 0 buildings
- 2003: 2 buildings, average cost: $40,000
- 2002: 1 building, cost: $40,000
- 2001: 1 building, cost: $40,000
- 2000: 1 building, cost: $40,000
- 1999: 0 buildings
- 1998: 0 buildings
- 1997: 0 buildings
Median real estate property taxes paid for housing units with mortgages in 2022: $830 (0.6%)
Median real estate property taxes paid for housing units with no mortgage in 2022: $556 (0.5%)
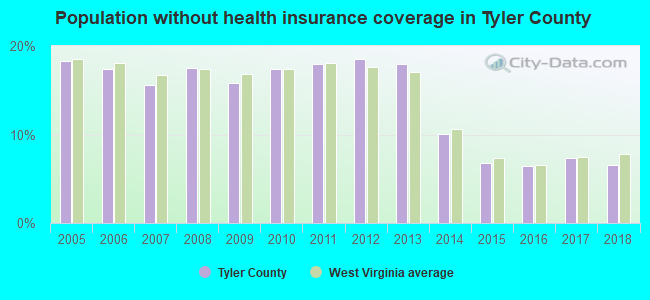
| Tyler County: | 12.8% |
| West Virginia: | 17.9% |
Median age of residents in 2022: 48.9 years old
(Males: 48.4 years old, Females: 48.7 years old)
(Median age for: White residents: 48.3 years old, Hispanic or Latino residents: 52.1 years old)
Fair market rent in 2006 for a 1-bedroom apartment in Tyler County is $400 a month.
Fair market rent for a 2-bedroom apartment is $485 a month.
Fair market rent for a 3-bedroom apartment is $630 a month.
Cities in this county include: Paden City, Sistersville, Middlebourne, Friendly.
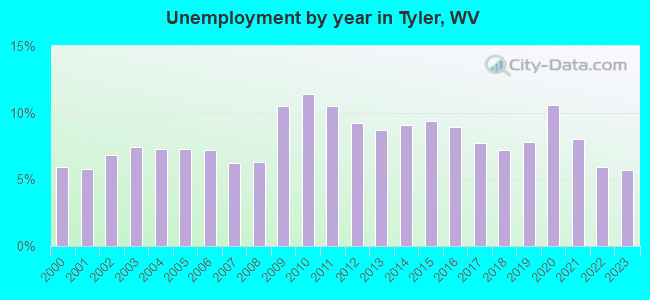
| Here: | 7.3% |
| West Virginia: | 4.0% |
Current college students: 245
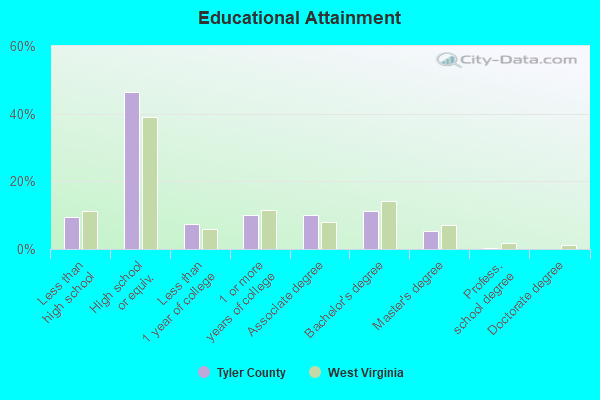
People 25 years of age or older with a high school degree or higher: 90.9%
People 25 years of age or older with a bachelor's degree or higher: 16.4%
Number of foreign born residents: 30 (105.1% naturalized citizens)
| Tyler County: | 0.4% |
| Whole state: | 1.8% |
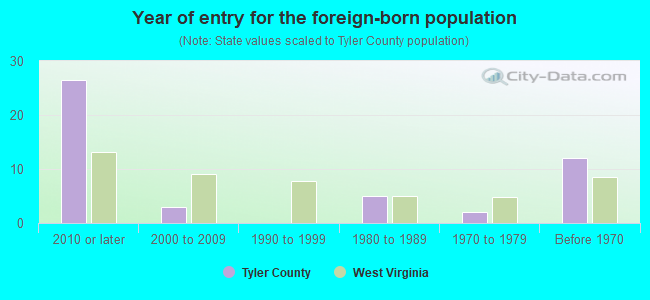
- Year of entry for the foreign-born population
- 02010 or later
- 02000 to 2009
- 01990 to 1999
- 51980 to 1989
- 21970 to 1979
- 12Before 1970
Mean travel time to work (commute): ! minutes
Percentage of county residents living and working in this county: 96.3%
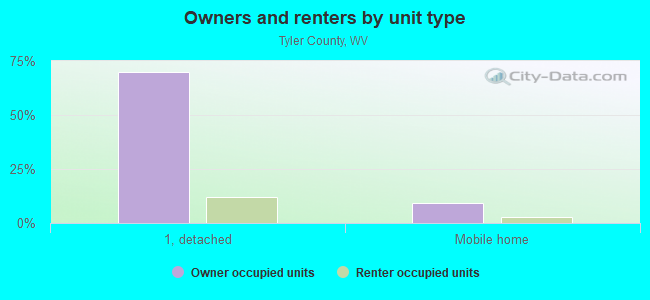
Housing units in structures:
- One, detached: 3,303
- One, attached: 75
- Two: 12
- 3 or 4: 39
- 5 to 9: 39
- 10 to 19: 19
- 20 to 49: 33
- 50 or more: 2
- Mobile homes: 642
- Boats, RVs, vans, etc.: 18
Housing units in Tyler County with a mortgage: 835 (67 second mortgage, 1 home equity loan, 58 both second mortgage and home equity loan)
Houses without a mortgage: 43
| Here: | 95.1% with mortgage |
| State: | 97.1% with mortgage |
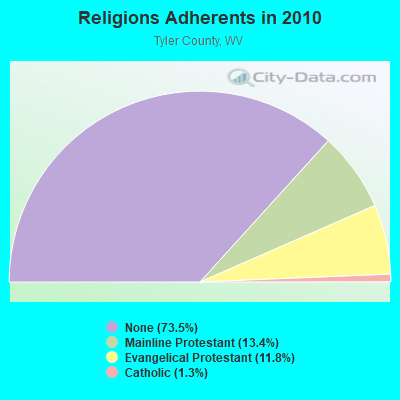
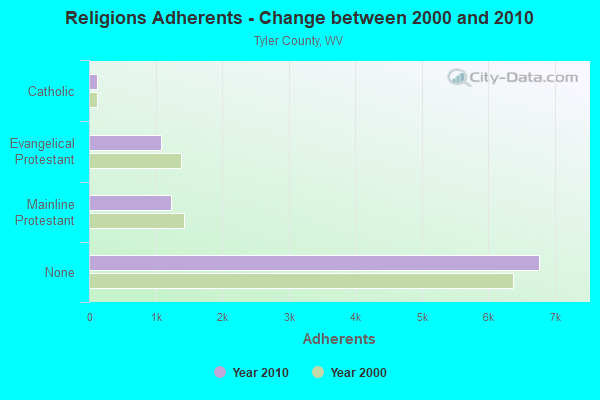
Religion statistics for Tyler County
| Religion | Adherents | Congregations |
|---|---|---|
| Mainline Protestant | 1,232 | 15 |
| Evangelical Protestant | 1,087 | 18 |
| Catholic | 122 | 2 |
| Other | 1 | - |
| None | 6,766 | - |
Source: Clifford Grammich, Kirk Hadaway, Richard Houseal, Dale E.Jones, Alexei Krindatch, Richie Stanley and Richard H.Taylor. 2012. 2010 U.S.Religion Census: Religious Congregations & Membership Study. Association of Statisticians of American Religious Bodies. Jones, Dale E., et al. 2002. Congregations and Membership in the United States 2000. Nashville, TN: Glenmary Research Center.
Food Environment Statistics:
| Tyler County: | 4.47 / 10,000 pop. |
| State: | 2.41 / 10,000 pop. |
| This county: | 3.35 / 10,000 pop. |
| West Virginia: | 1.09 / 10,000 pop. |
| Tyler County: | 5.59 / 10,000 pop. |
| West Virginia: | 5.38 / 10,000 pop. |
| This county: | 1.12 / 10,000 pop. |
| State: | 6.22 / 10,000 pop. |
| Tyler County: | 12.4% |
| West Virginia: | 12.2% |
| Tyler County: | 31.8% |
| State: | 31.1% |
Agriculture in Tyler County:
Average size of farms: 177 acresAverage value of agricultural products sold per farm: $4,841
Average value of crops sold per acre for harvested cropland: $36.16
The value of livestock, poultry, and their products as a percentage of the total market value of agricultural products sold: 78.38%
Average total farm production expenses per farm: $7,174
Harvested cropland as a percentage of land in farms: 16.35%
Irrigated harvested cropland as a percentage of land in farms: 0.09%
Average market value of all machinery and equipment per farm: $23,370
The percentage of farms operated by a family or individual: 96.67%
Average age of principal farm operators: 57 years
Average number of cattle and calves per 100 acres of all land in farms: 8.24
Milk cows as a percentage of all cattle and calves: 4.27%
Corn for grain: 62 harvested acres
Land in orchards: 55 acres
Earthquake activity:
Tyler County-area historical earthquake activity is significantly above West Virginia state average. It is 31% smaller than the overall U.S. average.On 8/23/2011 at 17:51:04, a magnitude 5.8 (5.8 MW, Depth: 3.7 mi, Class: Moderate, Intensity: VI - VII) earthquake occurred 195.6 miles away from Tyler County center
On 9/25/1998 at 19:52:52, a magnitude 5.2 (4.8 MB, 4.3 MS, 5.2 LG, 4.5 MW, Depth: 3.1 mi) earthquake occurred 140.6 miles away from the county center
On 7/27/1980 at 18:52:21, a magnitude 5.2 (5.1 MB, 4.7 MS, 5.0 UK, 5.2 UK) earthquake occurred 185.2 miles away from the county center
On 1/31/1986 at 16:46:43, a magnitude 5.0 (5.0 MB) earthquake occurred 145.9 miles away from the county center
On 8/9/2020 at 12:07:37, a magnitude 5.1 (5.1 MW, Depth: 4.7 mi) earthquake occurred 209.4 miles away from Tyler County center
On 9/7/1988 at 02:28:09, a magnitude 4.6 (4.5 MB, 4.6 LG, Class: Light, Intensity: IV - V) earthquake occurred 184.3 miles away from the county center
Magnitude types: regional Lg-wave magnitude (LG), body-wave magnitude (MB), surface-wave magnitude (MS), moment magnitude (MW)
Most recent natural disasters:
- West Virginia Covid-19 Pandemic, Incident Period: January 20, 2020, Major Disaster (Presidential) Declared DR-4517-WV: April 3, 2020, FEMA Id: 4517, Natural disaster type: Other
- West Virginia Severe Storms, Flooding, Landslides, And Mudslides, Incident Period: February 14, 2018 - February 20, 2018, FEMA Id: 4359, Natural disaster type: Storm, Mudslide, Landslide, Flood
- West Virginia Severe Storms, Flooding, Landslides, And Mudslides, Incident Period: July 28, 2017 - July 29, 2017, FEMA Id: 4331, Natural disaster type: Storm, Mudslide, Landslide, Flood
- West Virginia Severe Storms, Flooding, Landslides, and Mudslides, Incident Period: April 08, 2015 to April 11, 2015, Major Disaster (Presidential) Declared DR-4220: May 18, 2015, FEMA Id: 4220, Natural disaster type: Storm, Mudslide, Landslide, Flood
- West Virginia Severe Winter Storm, Flooding, Landslides, and Mudslides, Incident Period: March 03, 2015 to March 15, 2015, Major Disaster (Presidential) Declared DR-4210: March 31, 2015, FEMA Id: 4210, Natural disaster type: Winter Storm, Mudslide, Landslide, Flood
- West Virginia Hurricane Sandy, Incident Period: October 29, 2012 to November 08, 2012, Emergency Declared EM-3358: October 29, 2012, FEMA Id: 3358, Natural disaster type: Hurricane
- West Virginia Severe Storms, Incident Period: June 29, 2012 to July 10, 2012, Emergency Declared EM-3345: June 30, 2012, FEMA Id: 3345, Natural disaster type: Storm
- West Virginia Severe Storms and Straight-Line Winds, Incident Period: June 29, 2012 to July 08, 2012, Major Disaster (Presidential) Declared DR-4071: July 23, 2012, FEMA Id: 4071, Natural disaster type: Storm, Wind
- West Virginia Severe Winter Storms and Snowstorms, Incident Period: February 05, 2010 to February 11, 2010, Major Disaster (Presidential) Declared DR-1903: April 23, 2010, FEMA Id: 1903, Natural disaster type: Snowstorm, Winter Storm
- West Virginia Severe Storms, Tornadoes, Flooding, Mudslides, and Landslides, Incident Period: June 03, 2008 to June 07, 2008, Major Disaster (Presidential) Declared DR-1769: June 19, 2008, FEMA Id: 1769, Natural disaster type: Storm, Tornado, Mudslide, Landslide, Flood
- 11 other natural disasters have been reported since 1953.
The number of natural disasters in Tyler County (21) is greater than the US average (15).
Major Disasters (Presidential) Declared: 15
Emergencies Declared: 4
Causes of natural disasters: Floods: 11, Storms: 11, Landslides: 7, Mudslides: 5, Winter Storms: 5, Hurricanes: 2, Tornadoes: 2, Blizzard: 1, Snowfall: 1, Snowstorm: 1, Wind: 1, Other: 1 (Note: some incidents may be assigned to more than one category).
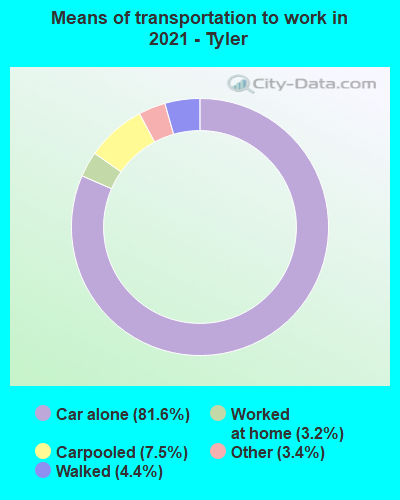
Means of transportation to work:
- Drove a car alone: 2,008 (80.1%)
- Carpooled: 196 (7.8%)
- Taxicab, motorcycle, or other means: 67 (2.7%)
- Walked: 85 (3.4%)
- Worked at home: 126 (5.0%)
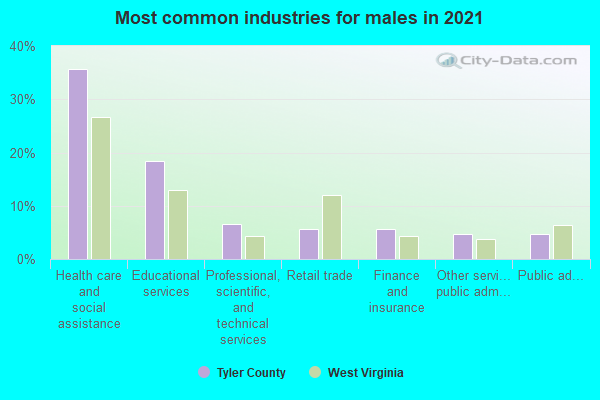
- Health care and social assistance (34%)
- Educational services (20%)
- Retail trade (8%)
- Professional, scientific, and technical services (6%)
- Other services, except public administration (5%)
- Accommodation and food services (4%)
- Public administration (4%)
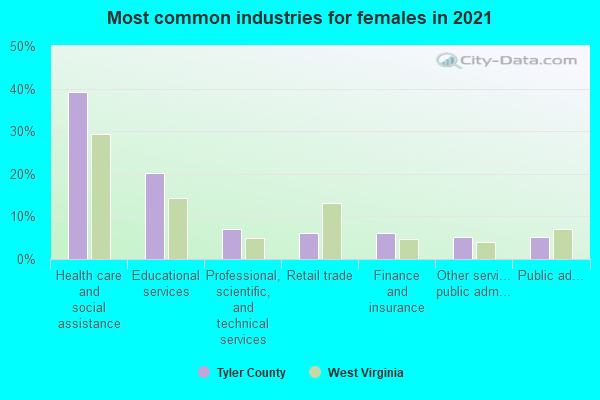
- Health care and social assistance (38%)
- Educational services (22%)
- Retail trade (8%)
- Professional, scientific, and technical services (7%)
- Other services, except public administration (5%)
- Accommodation and food services (4%)
- Public administration (4%)
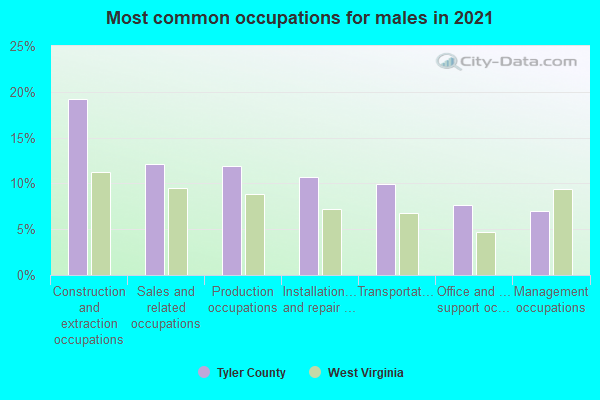
- Construction and extraction occupations (19%)
- Transportation occupations (14%)
- Production occupations (12%)
- Sales and related occupations (11%)
- Installation, maintenance, and repair occupations (8%)
- Office and administrative support occupations (6%)
- Material moving occupations (6%)
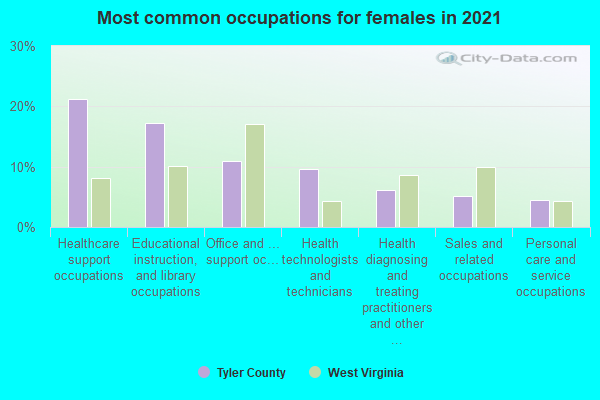
- Educational instruction, and library occupations (18%)
- Healthcare support occupations (17%)
- Health technologists and technicians (12%)
- Office and administrative support occupations (8%)
- Health diagnosing and treating practitioners and other technical occupations (7%)
- Management occupations (6%)
- Sales and related occupations (5%)
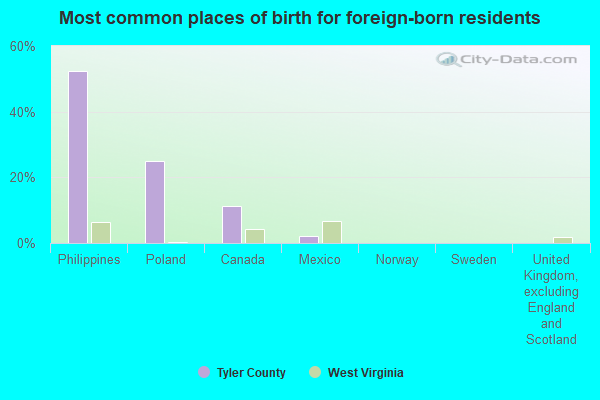
- Poland (56%)
- Canada (22%)
- Greece (7%)
- Ireland (0%)
- Norway (0%)
- Sweden (0%)
- United Kingdom, excluding England and Scotland (0%)
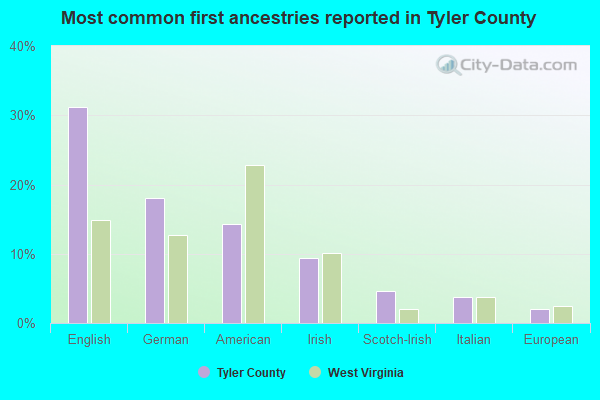
- English (28%)
- American (19%)
- German (15%)
- Irish (9%)
- Scotch-Irish (4%)
- European (3%)
- Italian (3%)
3 people in workers' group living quarters and job corps centers
People in group quarters in Tyler County, West Virginia in 2000:
- 68 people in nursing homes
- 30 people in other noninstitutional group quarters
- 9 people in local jails and other confinement facilities (including police lockups)
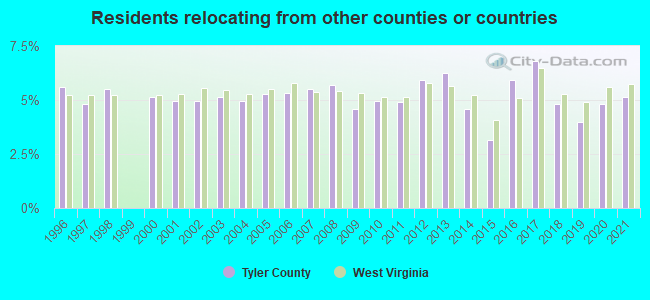
5.14% of this county's 2021 resident taxpayers lived in other counties in 2020 ($36,660 average adjusted gross income)
| Here: | 5.14% |
| West Virginia average: | 5.74% |
10 or fewer of this county's residents moved from foreign countries.
4.25% relocated from other counties in West Virginia ($28,969 average AGI)
0.89% relocated from other states ($7,691 average AGI)
Tyler County: 0.89% West Virginia average: 3.02%
Top counties from which taxpayers relocated into this county between 2020 and 2021:
| from Wetzel County, WV |
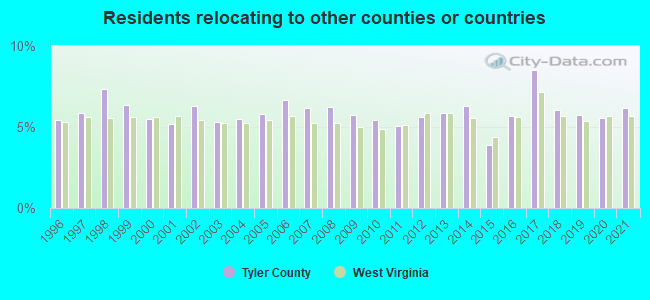
6.18% of this county's 2020 resident taxpayers moved to other counties in 2021 ($40,091 average adjusted gross income)
| Here: | 6.18% |
| West Virginia average: | 5.65% |
10 or fewer of this county's residents moved to foreign countries.
4.14% relocated to other counties in West Virginia ($28,579 average AGI)
2.04% relocated to other states ($11,513 average AGI)
Tyler County: 2.04% West Virginia average: 2.93%
Top counties to which taxpayers relocated from this county between 2020 and 2021:
| to Wetzel County, WV |
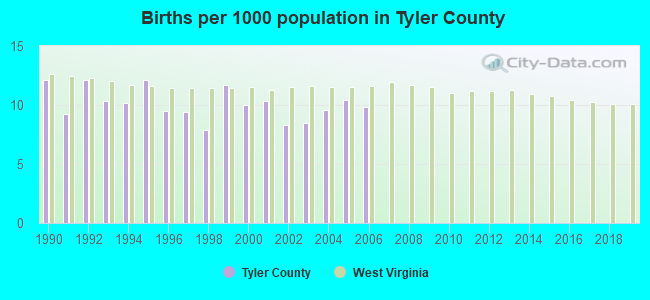
Births per 1000 population from 1990 to 1999: 10.5
Births per 1000 population from 2000 to 2006: 9.6
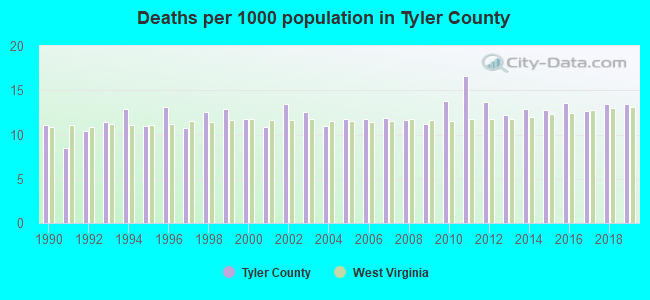
Deaths per 1000 population from 1990 to 1999: 11.5
Deaths per 1000 population from 2000 to 2009: 11.8
Deaths per 1000 population from 2010 to 2020: 13.3
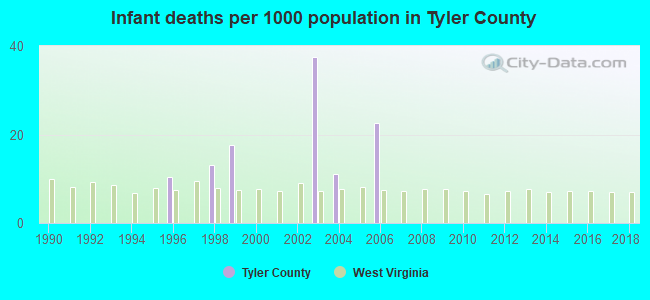
Infant deaths per 1000 live births from 1990 to 1999: 4.1
Infant deaths per 1000 live births from 2000 to 2006: 10.2
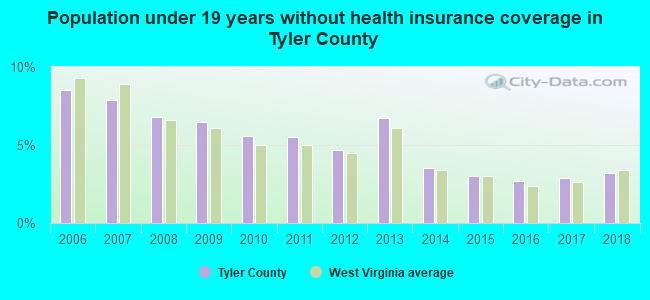
Persons under 19 years old without health insurance coverage in 2018: 3.2%
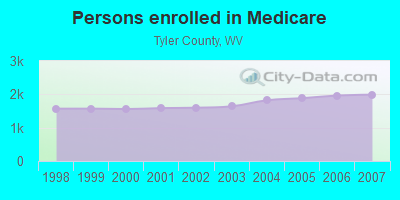
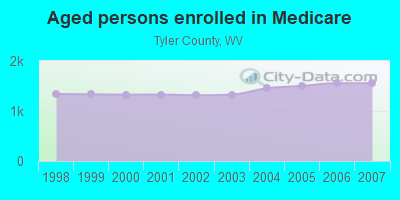
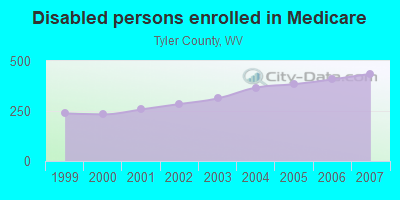
Persons enrolled in hospital insurance and/or supplemental medical insurance (Medicare) in July 1, 2007: 1,991 (1,555 aged, 436 disabled)
Children under 18 without health insurance coverage in 2007: 133 (7%)
Most common underlying causes of death in Tyler County, West Virginia in 1999 - 2019:
- Acute myocardial infarction, unspecified (153)
- Atherosclerotic heart disease (107)
- Bronchus or lung, unspecified - Malignant neoplasms (95)
- Stroke, not specified as haemorrhage or infarction (33)
- Other lack of expected normal physiological development (11)
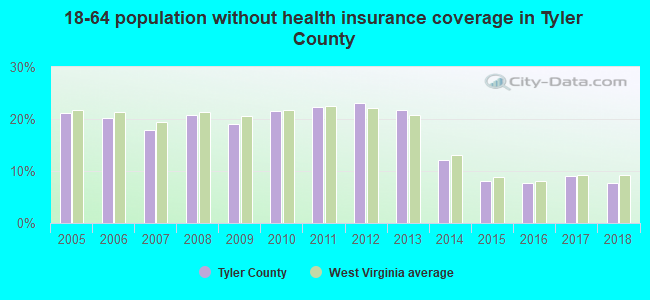
Population without health insurance coverage in 2000: 12%
Children under 18 without health insurance coverage in 2000: 8%
Short term general hospital admissions per 100,000 population in 2004: 2,114
Short term general hospital beds per 100,000 population in 2004: 128
Emergency room visits per 100,000 population in 2004: 75,494
General practice office based MDs per 100,000 population in 2005: 996
Medical specialist MDs per 100,000 population in 2005: 1,092
Total births per 100,000 population, July 2005 - July 2006 : 10
Total deaths per 100,000 population, July 2005 - July 2006: 75
Limited-service eating places per 100,000 population in 2005 : 11
Household type by relationship:
Households: 8,253- Male householders: 1,546 (473 living alone), Female householders: 1,483 (615 living alone)
1,490 spouses (1,490 opposite-sex spouses), 136 unmarried partners, (125 opposite-sex unmarried partners), 2,755 children (2,308 natural, 313 adopted, 169 stepchildren), 279 grandchildren, 44 brothers or sisters, 92 parents, 0 foster children, 93 other relatives, 183 non-relatives
- In group quarters: 92
Size of family households: 975 2-persons, 253 3-persons, 400 4-persons, 138 5-persons, 36 6-persons, 19 7-or-more-persons.
Size of nonfamily households: 1,089 1-person, 90 2-persons, 10 3-persons.
980 married couples with children.
272 single-parent households (75 men, 197 women).
98.9% of residents of Tyler speak English at home.
0.7% of residents speak Spanish at home (56% speak English very well, 15% speak English well, 29% speak English not well).
0.3% of residents speak other Indo-European language at home (96% speak English very well, 4% speak English not well).
0.1% of residents speak Asian or Pacific Island language at home (100% speak English not well).
In fiscal year 2004:
Federal Government expenditure: $48,022,000 ($5,128 per capita)
Department of Defense expenditure: $639,000
Federal direct payments to individuals for retirement and disability: $24,888,000
Federal other direct payments to individuals: $10,944,000
Federal direct payments not to individuals: $13,000
Federal grants: $10,392,000
Federal procurement contracts: $331,000 ($0,000 Department of Defense)
Federal salaries and wages: $1,454,000 ($0,000 Department of Defense)
Federal Government direct loans: $173,000
Federal guaranteed/insured loans: $580,000
Federal Government insurance: $5,292,000
Population change from April 1, 2000 to July 1, 2005:
Births: 446| Here: | 48 per 1000 residents |
| State: | 60 per 1000 residents |
Deaths: 614
| Here: | 66 per 1000 residents |
| State: | 61 per 1000 residents |
Net international migration: +5
| Here: | +1 per 1000 residents |
| State: | +2 per 1000 residents |
Net internal migration: -75
| Here: | |
| State: |
Total withdrawal of fresh water for public supply: 0.45 millions of gallons per day (11% from ground, 89% from surface)
| Here: | 6.6 |
| State: | 6.5 |
| Here: | 5.5 |
| State: | 4.7 |
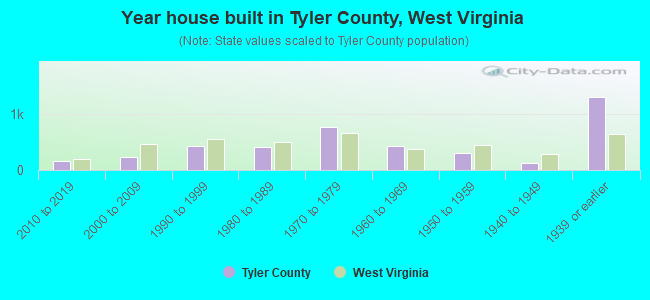
- Year house built in Tyler County, West Virginia
- 72020 or later
- 2192010 to 2019
- 2352000 to 2009
- 4371990 to 1999
- 3851980 to 1989
- 6471970 to 1979
- 5511960 to 1969
- 2771950 to 1959
- 1291940 to 1949
- 1,1801939 or earlier
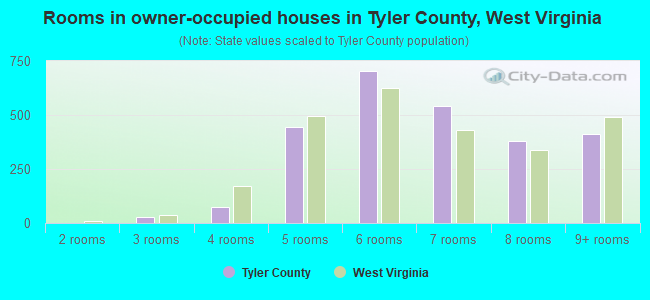
- Rooms in owner-occupied houses in Tyler County, West Virginia
- 01 room
- 02 rooms
- 343 rooms
- 1344 rooms
- 4645 rooms
- 6706 rooms
- 5677 rooms
- 4288 rooms
- 3819+ rooms
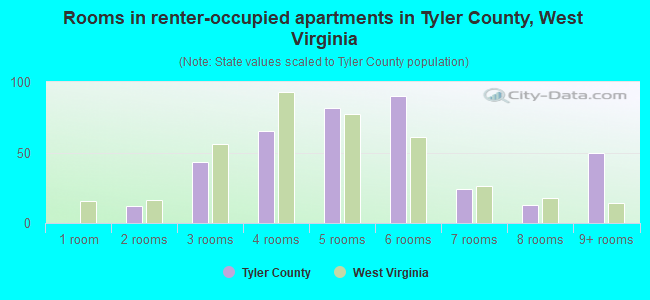
- Rooms in renter-occupied apartments in Tyler County, West Virginia
- 01 room
- 102 rooms
- 413 rooms
- 514 rooms
- 655 rooms
- 866 rooms
- 267 rooms
- 88 rooms
- 589+ rooms
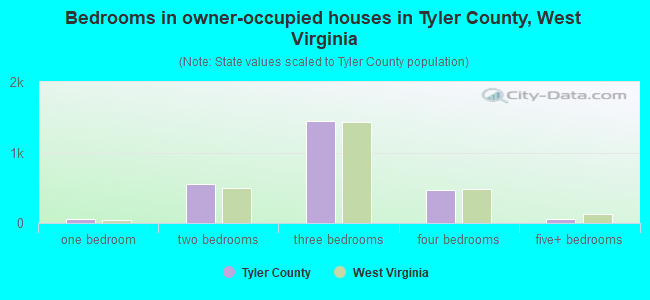
- Bedrooms in owner-occupied houses in Tyler County, West Virginia
- 0no bedroom
- 801 bedroom
- 5872 bedrooms
- 1,4833 bedrooms
- 4874 bedrooms
- 495+ bedrooms
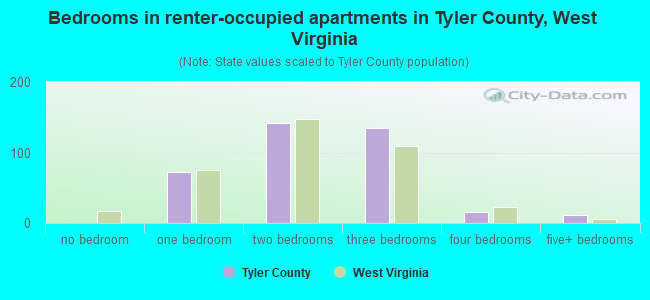
- Bedrooms in renter-occupied apartments in Tyler County, West Virginia
- 0no bedroom
- 801 bedroom
- 1122 bedrooms
- 1263 bedrooms
- 194 bedrooms
- 85+ bedrooms
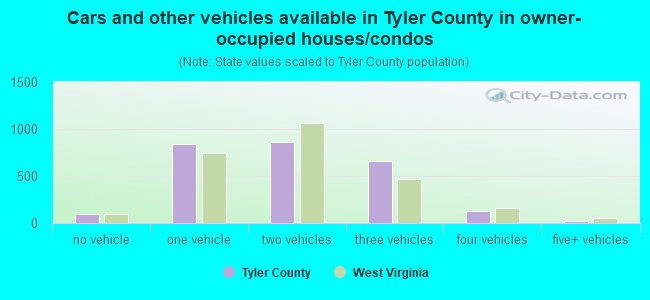
- Cars and other vehicles available in Tyler County in owner-occupied houses/condos
- 164no vehicle
- 8101 vehicle
- 8642 vehicles
- 7003 vehicles
- 1464 vehicles
- 145+ vehicles
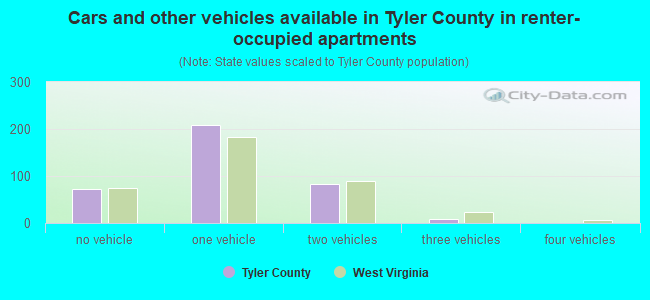
- Cars and other vehicles available in Tyler County in renter-occupied apartments
- 57no vehicle
- 1831 vehicle
- 842 vehicles
- 153 vehicles
- 04 vehicles
- 05+ vehicles
94.5% of Tyler County residents lived in the same house 1 years ago.
Out of people who lived in different houses, 21% lived in this county.
Out of people who lived in different counties, 74% lived in West Virginia.
| Tyler County: | 94.5% |
| State average: | 89.6% |
Place of birth for U.S.-born residents:
- This state: 6,387
- Other state: 1,761
- Northeast: 461
- Midwest: 862
- South: 332
- West: 86
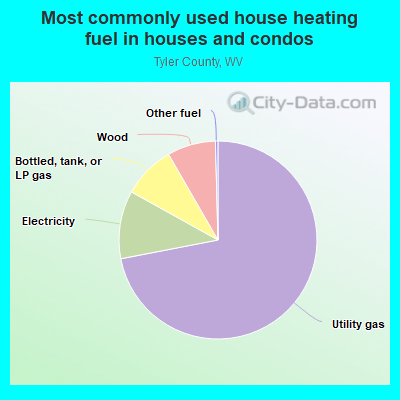
- 71.6%Utility gas
- 12.5%Electricity
- 9.1%Bottled, tank, or LP gas
- 5.5%Wood
- 0.7%Other fuel
- 0.7%Fuel oil, kerosene, etc.
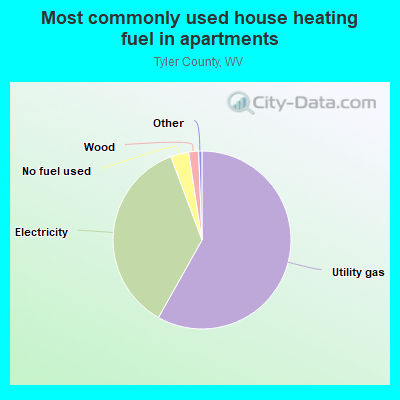
- 61.7%Utility gas
- 30.5%Electricity
- 4.2%Bottled, tank, or LP gas
- 3.0%No fuel used
- 0.6%Wood
Private vs. public school enrollment:
| Here: | 0.3% |
| West Virginia: | 12.2% |
| Here: | 0.7% |
| West Virginia: | 8.8% |
| Here: | 0.9% |
| West Virginia: | 17.3% |
Tyler County government finances - Expenditure in 2018:
- Charges - Other: $927,000
- Current Operations - Police Protection: $858,000
Financial Administration: $570,000
Judicial and Legal Services: $512,000
General - Other: $253,000
Central Staff Services: $187,000
Health - Other: $13,000
Libraries: $8,000
Parks and Recreation: $6,000
- Federal Intergovernmental - Public Welfare: $45,000
- General - Interest on Debt: $238,000
- Long Term Debt - Beginning Outstanding - Public Debt for Private Purpose: $4,844,000
Outstanding Nonguaranteed - Industrial Revenue: $4,279,000
Retired Nonguaranteed - Public Debt for Private Purpose: $565,000
- Miscellaneous - General Revenue - Other: $259,000
Fines and Forfeits: $60,000
Interest Earnings: $4,000
Sale of Property: $3,000
Royalties: $1,000
- Other Funds - Cash and Securities: $4,877,000
- Sinking Funds - Cash and Securities: $4,279,000
- State Intergovernmental - General Local Government Support: $666,000
Other: $41,000
- Tax - Property: $3,160,000
Public Utilities Sales: $244,000
Other Selective Sales: $162,000
Other License: $13,000
- Total Salaries and Wages: $1,399,000
Tyler County government finances - Revenue in 2018:
- Charges - Other: $927,000
- Current Operations - Police Protection: $858,000
Financial Administration: $570,000
Judicial and Legal Services: $512,000
General - Other: $253,000
Central Staff Services: $187,000
Health - Other: $13,000
Libraries: $8,000
Parks and Recreation: $6,000
- Federal Intergovernmental - Public Welfare: $45,000
- General - Interest on Debt: $238,000
- Long Term Debt - Beginning Outstanding - Public Debt for Private Purpose: $4,844,000
Outstanding Nonguaranteed - Industrial Revenue: $4,279,000
Retired Nonguaranteed - Public Debt for Private Purpose: $565,000
- Miscellaneous - General Revenue - Other: $259,000
Fines and Forfeits: $60,000
Interest Earnings: $4,000
Sale of Property: $3,000
Royalties: $1,000
- Other Funds - Cash and Securities: $4,877,000
- Sinking Funds - Cash and Securities: $4,279,000
- State Intergovernmental - General Local Government Support: $666,000
Other: $41,000
- Tax - Property: $3,160,000
Public Utilities Sales: $244,000
Other Selective Sales: $162,000
Other License: $13,000
- Total Salaries and Wages: $1,399,000
Tyler County government finances - Debt in 2018:
- Charges - Other: $927,000
- Current Operations - Police Protection: $858,000
Financial Administration: $570,000
Judicial and Legal Services: $512,000
General - Other: $253,000
Central Staff Services: $187,000
Health - Other: $13,000
Libraries: $8,000
Parks and Recreation: $6,000
- Federal Intergovernmental - Public Welfare: $45,000
- General - Interest on Debt: $238,000
- Long Term Debt - Beginning Outstanding - Public Debt for Private Purpose: $4,844,000
Outstanding Nonguaranteed - Industrial Revenue: $4,279,000
Retired Nonguaranteed - Public Debt for Private Purpose: $565,000
- Miscellaneous - General Revenue - Other: $259,000
Fines and Forfeits: $60,000
Interest Earnings: $4,000
Sale of Property: $3,000
Royalties: $1,000
- Other Funds - Cash and Securities: $4,877,000
- Sinking Funds - Cash and Securities: $4,279,000
- State Intergovernmental - General Local Government Support: $666,000
Other: $41,000
- Tax - Property: $3,160,000
Public Utilities Sales: $244,000
Other Selective Sales: $162,000
Other License: $13,000
- Total Salaries and Wages: $1,399,000
Tyler County government finances - Cash and Securities in 2018:
- Charges - Other: $927,000
- Current Operations - Police Protection: $858,000
Financial Administration: $570,000
Judicial and Legal Services: $512,000
General - Other: $253,000
Central Staff Services: $187,000
Health - Other: $13,000
Libraries: $8,000
Parks and Recreation: $6,000
- Federal Intergovernmental - Public Welfare: $45,000
- General - Interest on Debt: $238,000
- Long Term Debt - Beginning Outstanding - Public Debt for Private Purpose: $4,844,000
Outstanding Nonguaranteed - Industrial Revenue: $4,279,000
Retired Nonguaranteed - Public Debt for Private Purpose: $565,000
- Miscellaneous - General Revenue - Other: $259,000
Fines and Forfeits: $60,000
Interest Earnings: $4,000
Sale of Property: $3,000
Royalties: $1,000
- Other Funds - Cash and Securities: $4,877,000
- Sinking Funds - Cash and Securities: $4,279,000
- State Intergovernmental - General Local Government Support: $666,000
Other: $41,000
- Tax - Property: $3,160,000
Public Utilities Sales: $244,000
Other Selective Sales: $162,000
Other License: $13,000
- Total Salaries and Wages: $1,399,000
Supplemental Security Income (SSI) in 2006:
- Total number of recipients: 313
- Number of aged recipients: 21
- Number of blind and disabled recipients: 292
- Number of recipients under 18: 30
- Number of recipients between 18 and 64: 232
- Number of recipients older than 64: 51
- Number of recipients also receiving OASDI: 105
- Amount of payments (thousands of dollars): 153
| Most common first names in Tyler County, WV among deceased individuals | ||
| Name | Count | Lived (average) |
|---|---|---|
| Mary | 111 | 79.9 years |
| William | 96 | 76.1 years |
| Charles | 95 | 75.0 years |
| John | 88 | 75.5 years |
| Robert | 79 | 69.1 years |
| James | 78 | 73.1 years |
| George | 51 | 75.0 years |
| Paul | 41 | 70.9 years |
| Ruth | 36 | 81.1 years |
| Helen | 31 | 76.7 years |
| Most common last names in Tyler County, WV among deceased individuals | ||
| Last name | Count | Lived (average) |
|---|---|---|
| Smith | 64 | 74.7 years |
| Wells | 40 | 79.6 years |
| Eddy | 39 | 75.9 years |
| Baker | 37 | 76.6 years |
| Henderson | 33 | 77.5 years |
| Thomas | 32 | 76.1 years |
| Stewart | 31 | 76.4 years |
| Martin | 29 | 74.2 years |
| Weekley | 28 | 76.0 years |
| Neff | 26 | 72.2 years |
| Businesses in Tyler County, WV | ||||
| Name | Count | Name | Count | |
|---|---|---|---|---|
| Dairy Queen | 1 | True Value | 1 | |
| Domino's Pizza | 1 | U-Haul | 1 | |
| Ford | 1 | |||