Crime rate in Akron, Ohio (OH): murders, rapes, robberies, assaults, burglaries, thefts, auto thefts, arson, law enforcement employees, police officers, crime map
Crime rate in Akron, OH
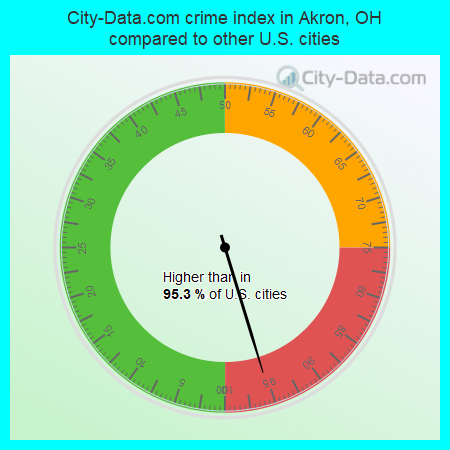
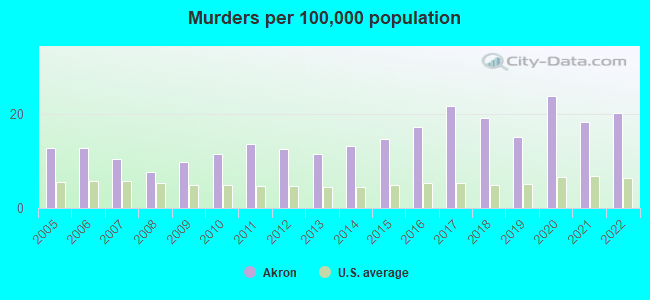
The 2022 crime rate in Akron, OH is 447 (City-Data.com crime index), which is 1.8 times higher than the U.S. average. It was higher than in 95.6% U.S. cities. The 2022 Akron crime rate rose by 1% compared to 2021. The number of homicides stood at 38 - an increase of 2 compared to 2021. In the last 5 years Akron has seen decline of violent crime and decline of property crime.See how dangerous Akron, OH is compared to the nearest cities:
(Note: Higher means more crime)
(Note: Higher means more crime)
| Akron: | 447.1 |
| Cuyahoga Falls: | 134.6 |
| Tallmadge: | 82.9 |
| Lakemore: | 284.7 |
| Barberton: | 242.1 |
| Munroe Falls: | 53.3 |
| Mogadore: | 92.7 |
| Fairlawn: | 197.5 |
| Norton: | 118.1 |
The City-Data.com crime index weighs serious crimes and violent crimes more heavily. Higher means more crime, U.S. average is 246.1. It adjusts for the number of visitors and daily workers commuting into cities.
- means the value is bigger than the state average.- means the value is much bigger than the state average.
According to our research of Ohio and other state lists, there were 908 registered sex offenders living in Akron, Ohio as of May 23, 2024.
The ratio of all residents to sex offenders in Akron is 218 to 1.
Violent crime rate in 2022
| Akron: | 495.4 |
| U.S. Average: | 219.8 |
Violent crime rate in 2021
| Akron: | 501.3 |
| U.S. Average: | 224.8 |
Violent crime rate in 2020
| Akron: | 556.6 |
| U.S. Average: | 228.2 |
Violent crime rate in 2019
| Akron: | 542.0 |
| U.S. Average: | 219.9 |
Violent crime rate in 2018
| Akron: | 526.1 |
| U.S. Average: | 221.2 |
Violent crime rate in 2017
| Akron: | 440.7 |
| U.S. Average: | 226.2 |
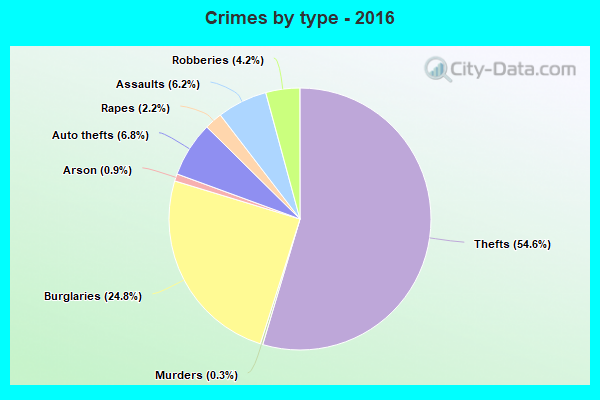
Violent crime rate in 2016
| Akron: | 408.9 |
| U.S. Average: | 227.3 |
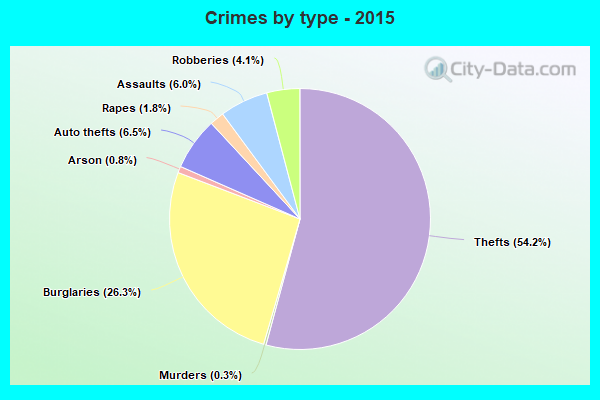
Violent crime rate in 2015
| Akron: | 377.3 |
| U.S. Average: | 219.3 |
Violent crime rate in 2014
| Akron: | 409.3 |
| U.S. Average: | 211.1 |
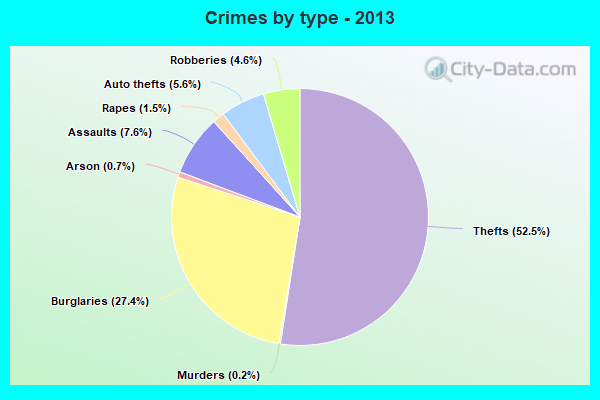
Violent crime rate in 2013
| Akron: | 456.6 |
| U.S. Average: | 214.2 |
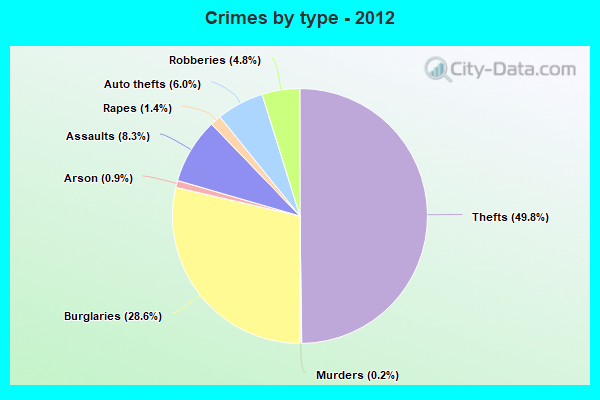
Violent crime rate in 2012
| Akron: | 510.4 |
| U.S. Average: | 187.4 |
Violent crime rate in 2011
| Akron: | 509.9 |
| U.S. Average: | 187.1 |
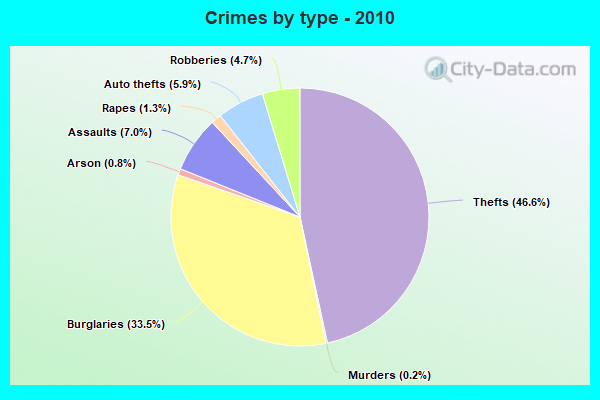
Violent crime rate in 2010
| Akron: | 479.1 |
| U.S. Average: | 195.7 |
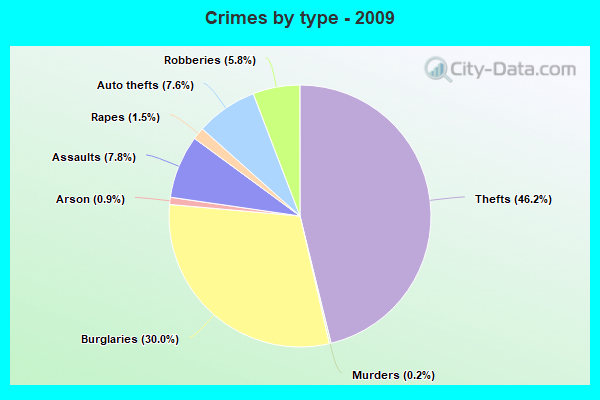
Violent crime rate in 2009
| Akron: | 525.2 |
| U.S. Average: | 208.9 |
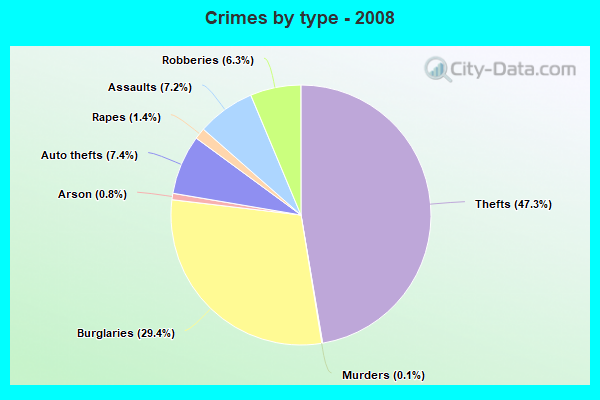
Violent crime rate in 2008
| Akron: | 518.3 |
| U.S. Average: | 222.5 |
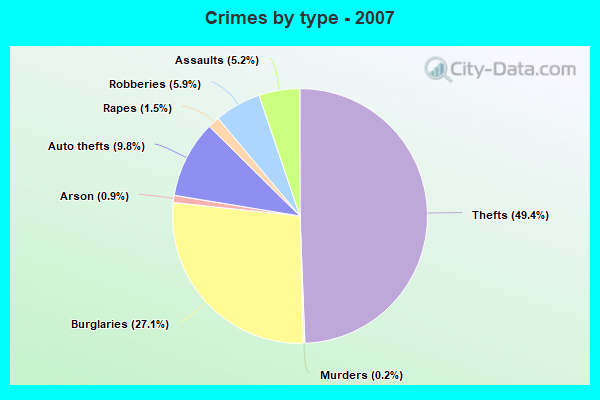
Violent crime rate in 2007
| Akron: | 359.6 |
| U.S. Average: | 229.1 |
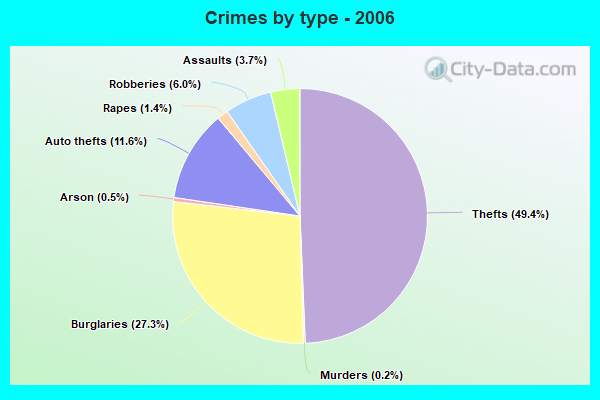
Violent crime rate in 2006
| Akron: | 308.6 |
| U.S. Average: | 232.6 |
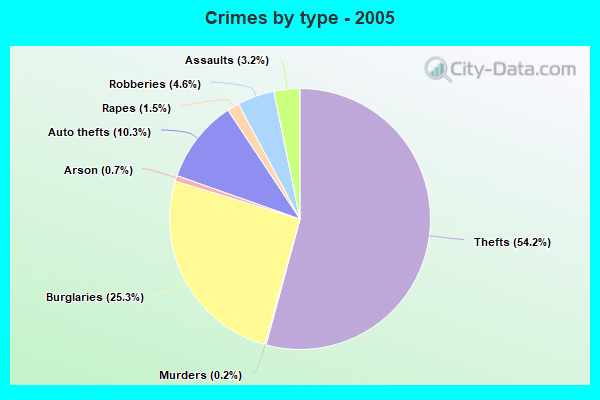
Violent crime rate in 2005
| Akron: | 302.4 |
| U.S. Average: | 227.0 |
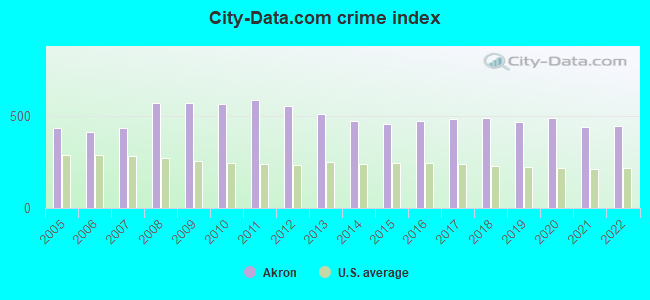
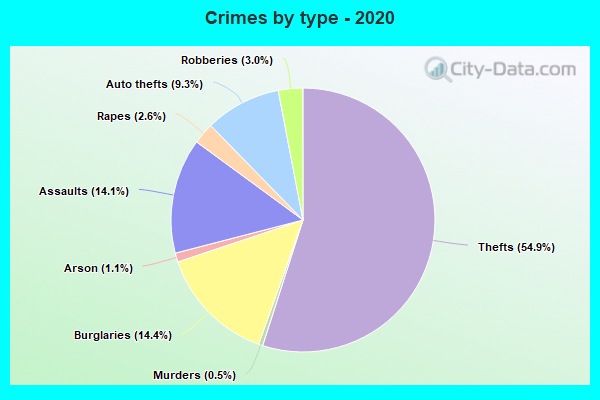
Property crime rate in 2022
| Akron: | 301.6 |
| U.S. Average: | 166.5 |
Property crime rate in 2021
| Akron: | 308.3 |
| U.S. Average: | 157.8 |
Property crime rate in 2020
| Akron: | 319.1 |
| U.S. Average: | 169.6 |
Property crime rate in 2019
| Akron: | 326.3 |
| U.S. Average: | 179.7 |
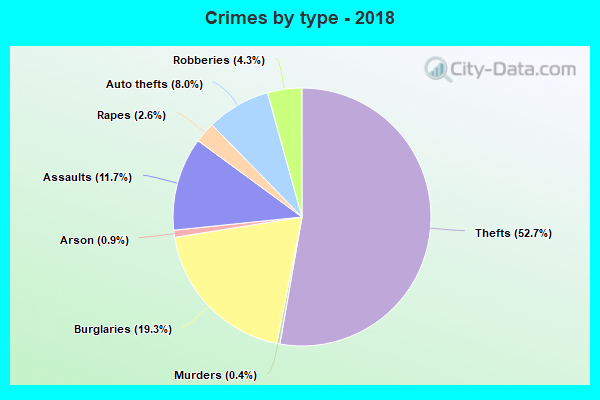
Property crime rate in 2018
| Akron: | 353.5 |
| U.S. Average: | 190.2 |
Property crime rate in 2017
| Akron: | 426.6 |
| U.S. Average: | 206.4 |
Property crime rate in 2016
| Akron: | 443.0 |
| U.S. Average: | 216.6 |
Property crime rate in 2015
| Akron: | 454.0 |
| U.S. Average: | 221.5 |
Property crime rate in 2014
| Akron: | 478.3 |
| U.S. Average: | 230.8 |
Property crime rate in 2013
| Akron: | 511.4 |
| U.S. Average: | 250.4 |
Property crime rate in 2012
| Akron: | 553.0 |
| U.S. Average: | 267.3 |
Property crime rate in 2011
| Akron: | 636.8 |
| U.S. Average: | 273.5 |
Property crime rate in 2010
| Akron: | 633.7 |
| U.S. Average: | 276.4 |
Property crime rate in 2009
| Akron: | 576.5 |
| U.S. Average: | 285.6 |
Property crime rate in 2008
| Akron: | 582.7 |
| U.S. Average: | 302.2 |
Property crime rate in 2007
| Akron: | 456.0 |
| U.S. Average: | 309.2 |
Property crime rate in 2006
| Akron: | 450.2 |
| U.S. Average: | 317.3 |
Property crime rate in 2005
| Akron: | 489.1 |
| U.S. Average: | 322.3 |

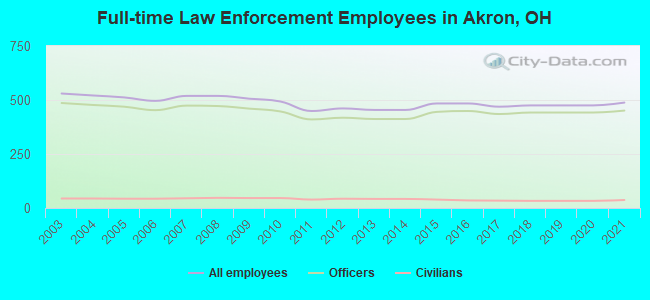
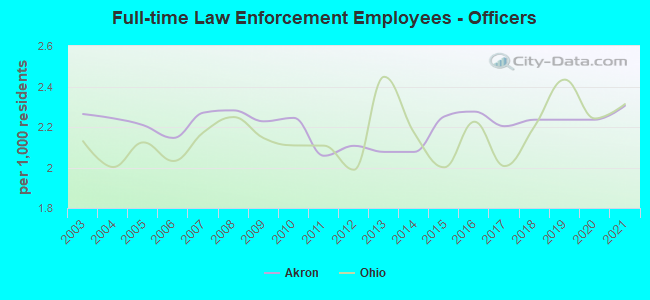
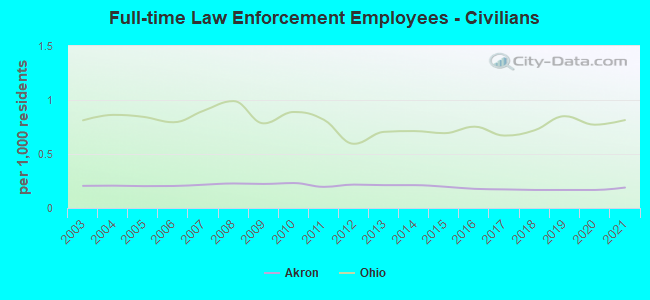
Full-time law enforcement employees in 2021, including police officers: 488 (451 officers - 407 male; 44 female).
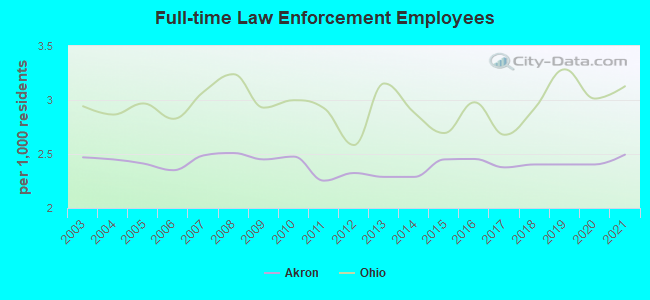
| Officers per 1,000 residents here: | 2.30 |
| Ohio average: | 2.31 |
Full-time law enforcement employees in 2018, including police officers: 475 (442 officers - 401 male; 41 female).
| Officers per 1,000 residents here: | 2.24 |
| Ohio average: | 2.20 |
Full-time law enforcement employees in 2017, including police officers: 469 (435 officers - 391 male; 44 female).
| Officers per 1,000 residents here: | 2.20 |
| Ohio average: | 2.01 |
Full-time law enforcement employees in 2016, including police officers: 484 (449 officers - 401 male; 48 female).
| Officers per 1,000 residents here: | 2.28 |
| Ohio average: | 2.23 |
Full-time law enforcement employees in 2015, including police officers: 484 (445 officers - 400 male; 45 female).
| Officers per 1,000 residents here: | 2.25 |
| Ohio average: | 2.00 |
Full-time law enforcement employees in 2013, including police officers: 454 (412 officers - 369 male; 43 female).
| Officers per 1,000 residents here: | 2.08 |
| Ohio average: | 2.45 |
Full-time law enforcement employees in 2012, including police officers: 461 (418 officers - 378 male; 40 female).
| Officers per 1,000 residents here: | 2.11 |
| Ohio average: | 1.99 |
Full-time law enforcement employees in 2011, including police officers: 449 (410 officers - 368 male; 42 female).
| Officers per 1,000 residents here: | 2.06 |
| Ohio average: | 2.11 |
Full-time law enforcement employees in 2010, including police officers: 493 (447 officers - 402 male; 45 female).
| Officers per 1,000 residents here: | 2.24 |
| Ohio average: | 2.11 |
Full-time law enforcement employees in 2009, including police officers: 506 (460 officers - 414 male; 46 female).
| Officers per 1,000 residents here: | 2.23 |
| Ohio average: | 2.15 |
Full-time law enforcement employees in 2008, including police officers: 519 (472 officers - 425 male; 47 female).
| Officers per 1,000 residents here: | 2.28 |
| Ohio average: | 2.25 |
Full-time law enforcement employees in 2007, including police officers: 519 (474 officers - 426 male; 48 female).
| Officers per 1,000 residents here: | 2.27 |
| Ohio average: | 2.17 |
Full-time law enforcement employees in 2006, including police officers: 496 (453 officers - 405 male; 48 female).
| Officers per 1,000 residents here: | 2.15 |
| Ohio average: | 2.03 |
Full-time law enforcement employees in 2005, including police officers: 512 (469 officers - 418 male; 51 female).
| Officers per 1,000 residents here: | 2.21 |
| Ohio average: | 2.12 |
Full-time law enforcement employees in 2004, including police officers: 521 (477 officers - 425 male; 52 female).
| Officers per 1,000 residents here: | 2.24 |
| Ohio average: | 2.00 |
Full-time law enforcement employees in 2003, including police officers: 530 (486 officers - 433 male; 53 female).
| Officers per 1,000 residents here: | 2.26 |
| Ohio average: | 2.13 |


Zip codes: 44203, 44221, 44223, 44260, 44278, 44301, 44302, 44303, 44304, 44305, 44306, 44307, 44308, 44310, 44311, 44312, 44313, 44314, 44319, 44320, 44333.