Crime rate in Amarillo, Texas (TX): murders, rapes, robberies, assaults, burglaries, thefts, auto thefts, arson, law enforcement employees, police officers, crime map
Crime rate in Amarillo, TX
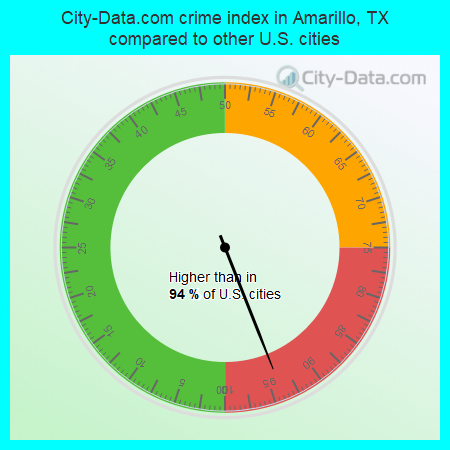
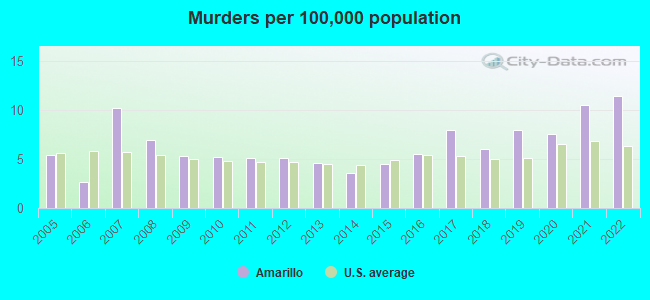
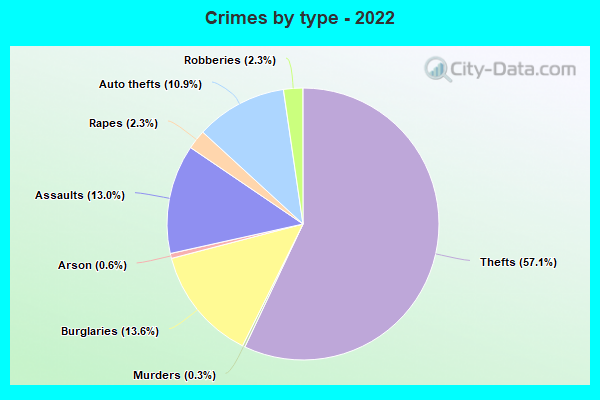
The 2022 crime rate in Amarillo, TX is 416 (City-Data.com crime index), which is 1.7 times greater than the U.S. average. It was higher than in 94.6% U.S. cities. The 2022 Amarillo crime rate rose by 3% compared to 2021. The number of homicides stood at 23 - an increase of 2 compared to 2021. In the last 5 years Amarillo has seen decline of violent crime and decline of property crime.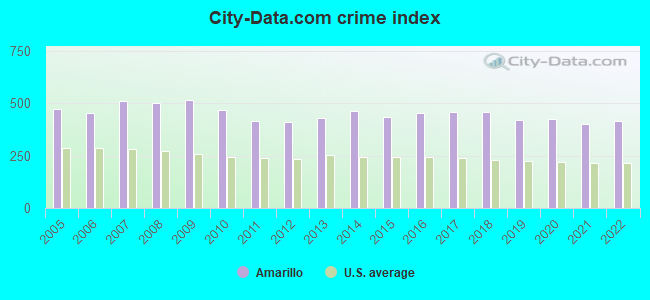
The City-Data.com crime index weighs serious crimes and violent crimes more heavily. Higher means more crime, U.S. average is 246.1. It adjusts for the number of visitors and daily workers commuting into cities.
- means the value is smaller than the state average.- means the value is about the same as the state average.
- means the value is bigger than the state average.
- means the value is much bigger than the state average.
According to our research of Texas and other state lists, there were 883 registered sex offenders living in Amarillo, Texas as of May 17, 2024.
The ratio of all residents to sex offenders in Amarillo is 224 to 1.
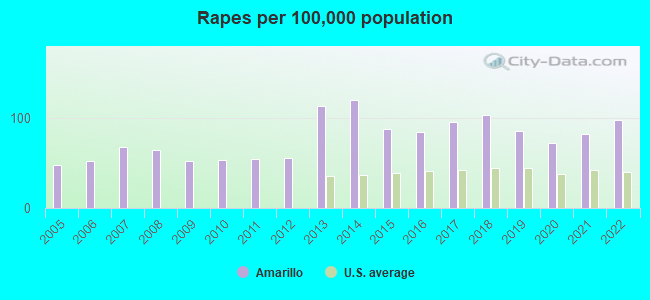
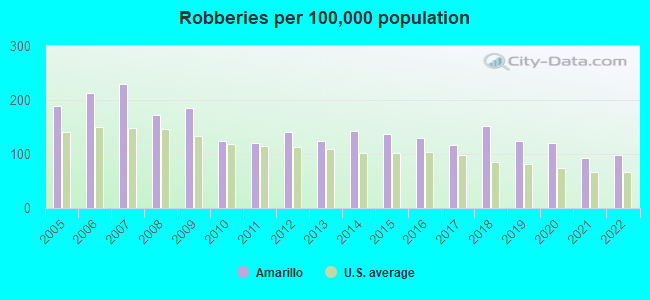
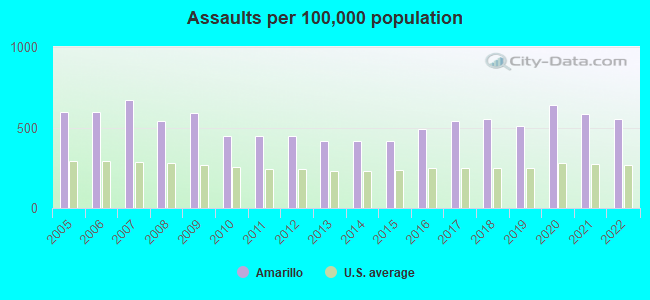
Violent crime rate in 2022
| Amarillo: | 447.2 |
| U.S. Average: | 219.8 |
Violent crime rate in 2021
| Amarillo: | 439.1 |
| U.S. Average: | 224.8 |
Violent crime rate in 2020
| Amarillo: | 466.8 |
| U.S. Average: | 228.2 |
Violent crime rate in 2019
| Amarillo: | 419.3 |
| U.S. Average: | 219.9 |
Violent crime rate in 2018
| Amarillo: | 466.5 |
| U.S. Average: | 221.2 |
Violent crime rate in 2017
| Amarillo: | 440.8 |
| U.S. Average: | 226.2 |
Violent crime rate in 2016
| Amarillo: | 406.5 |
| U.S. Average: | 227.3 |
Violent crime rate in 2015
| Amarillo: | 375.1 |
| U.S. Average: | 219.3 |
Violent crime rate in 2014
| Amarillo: | 407.6 |
| U.S. Average: | 211.1 |
Violent crime rate in 2013
| Amarillo: | 394.2 |
| U.S. Average: | 214.2 |
Violent crime rate in 2012
| Amarillo: | 360.7 |
| U.S. Average: | 187.4 |
Violent crime rate in 2011
| Amarillo: | 349.5 |
| U.S. Average: | 187.1 |
Violent crime rate in 2010
| Amarillo: | 349.2 |
| U.S. Average: | 195.7 |
Violent crime rate in 2009
| Amarillo: | 452.7 |
| U.S. Average: | 208.9 |
Violent crime rate in 2008
| Amarillo: | 435.3 |
| U.S. Average: | 222.5 |
Violent crime rate in 2007
| Amarillo: | 464.9 |
| U.S. Average: | 229.1 |
Violent crime rate in 2006
| Amarillo: | 397.2 |
| U.S. Average: | 232.6 |
Violent crime rate in 2005
| Amarillo: | 388.3 |
| U.S. Average: | 227.0 |
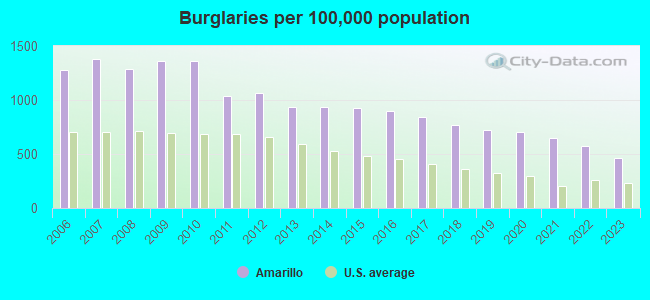
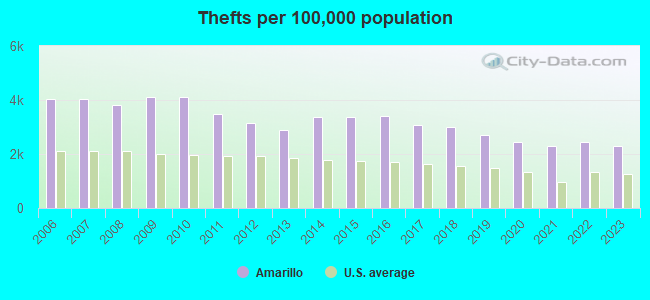
Property crime rate in 2022
| Amarillo: | 306.6 |
| U.S. Average: | 166.5 |
Property crime rate in 2021
| Amarillo: | 309.9 |
| U.S. Average: | 157.8 |
Property crime rate in 2020
| Amarillo: | 343.1 |
| U.S. Average: | 169.6 |
Property crime rate in 2019
| Amarillo: | 351.8 |
| U.S. Average: | 179.7 |
Property crime rate in 2018
| Amarillo: | 370.6 |
| U.S. Average: | 190.2 |
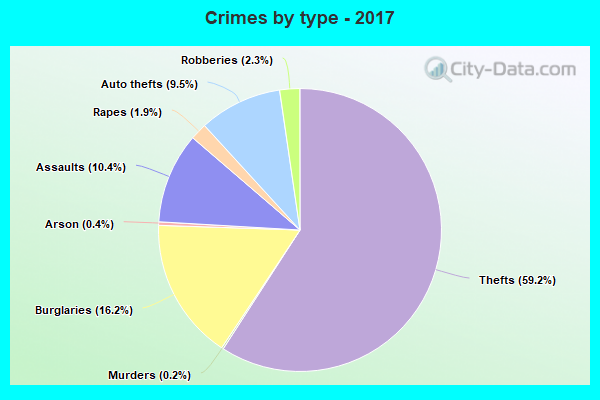
Property crime rate in 2017
| Amarillo: | 395.4 |
| U.S. Average: | 206.4 |
Property crime rate in 2016
| Amarillo: | 419.2 |
| U.S. Average: | 216.6 |
Property crime rate in 2015
| Amarillo: | 412.3 |
| U.S. Average: | 221.5 |
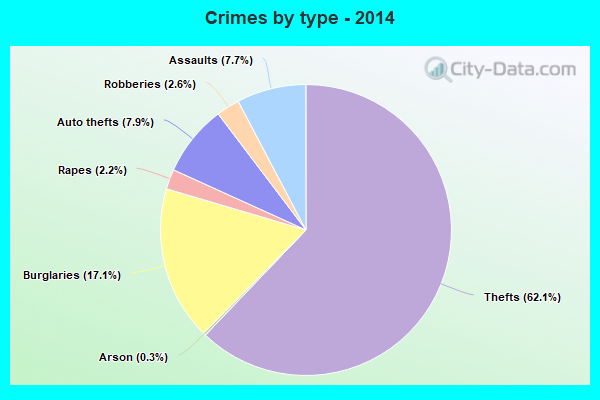
Property crime rate in 2014
| Amarillo: | 420.6 |
| U.S. Average: | 230.8 |
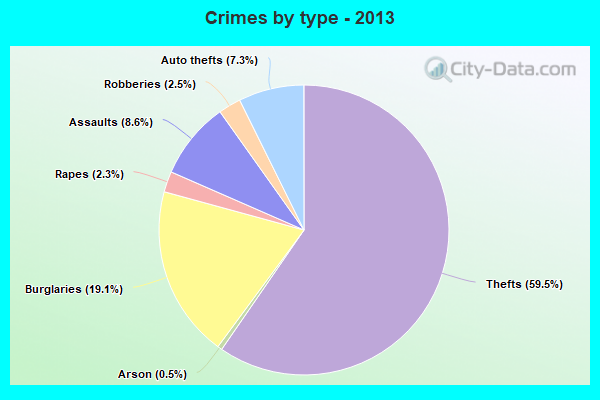
Property crime rate in 2013
| Amarillo: | 384.7 |
| U.S. Average: | 250.4 |
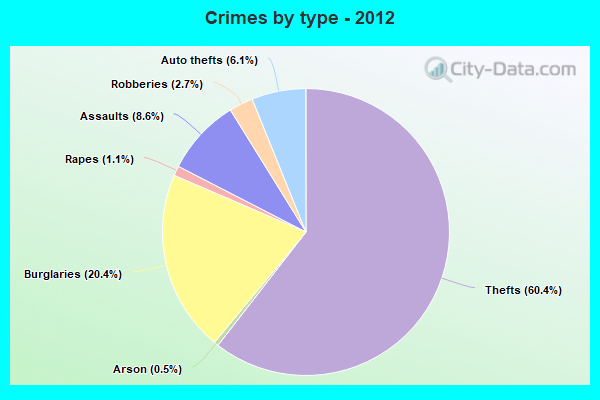
Property crime rate in 2012
| Amarillo: | 417.6 |
| U.S. Average: | 267.3 |
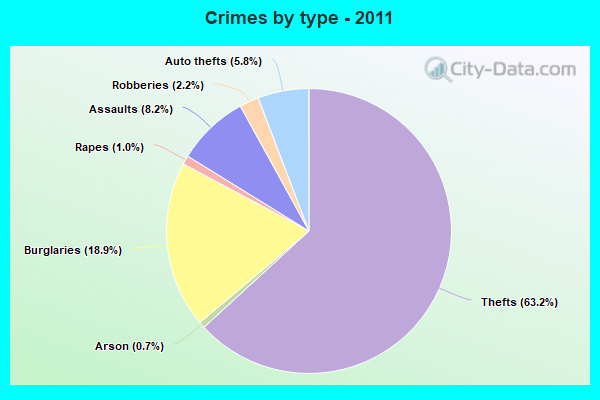
Property crime rate in 2011
| Amarillo: | 428.2 |
| U.S. Average: | 273.5 |
Property crime rate in 2010
| Amarillo: | 528.8 |
| U.S. Average: | 276.4 |
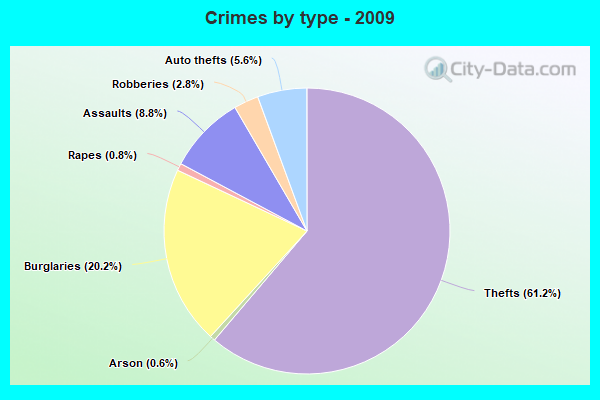
Property crime rate in 2009
| Amarillo: | 533.5 |
| U.S. Average: | 285.6 |
Property crime rate in 2008
| Amarillo: | 507.3 |
| U.S. Average: | 302.2 |
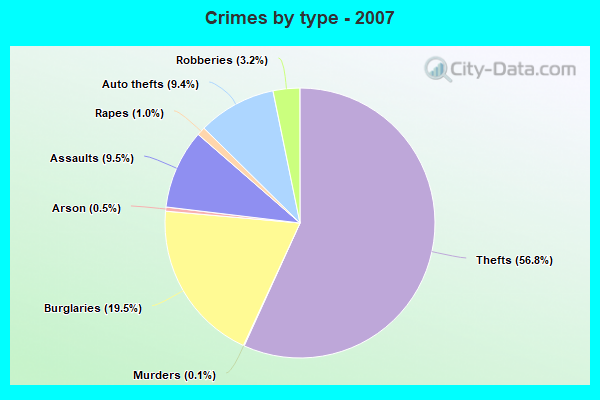
Property crime rate in 2007
| Amarillo: | 499.1 |
| U.S. Average: | 309.2 |
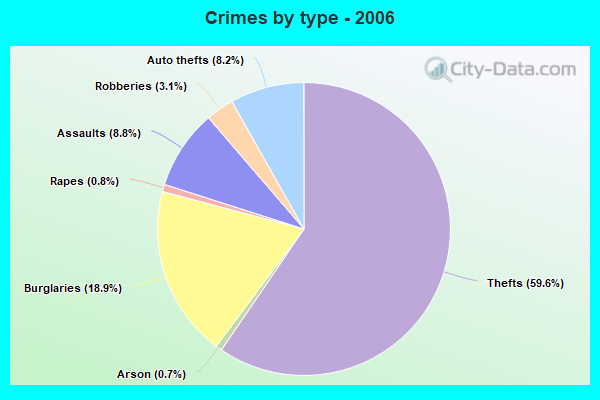
Property crime rate in 2006
| Amarillo: | 467.3 |
| U.S. Average: | 317.3 |
Property crime rate in 2005
| Amarillo: | 506.9 |
| U.S. Average: | 322.3 |
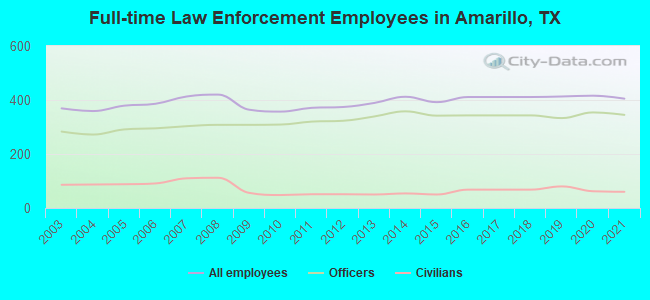
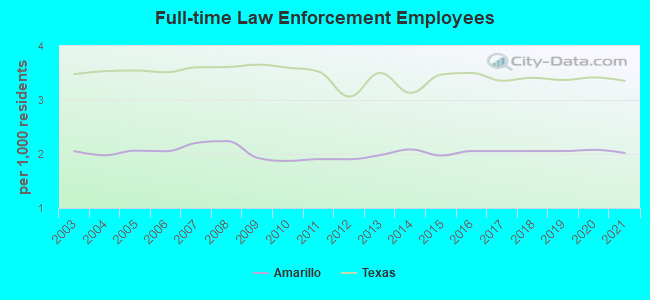
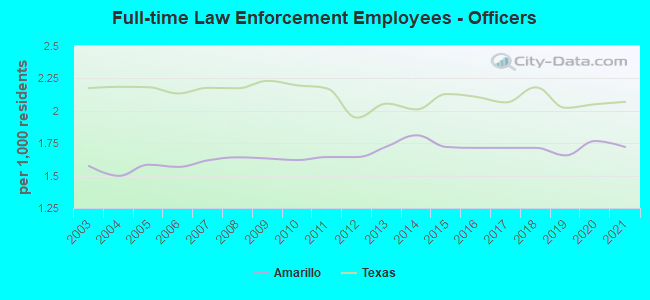
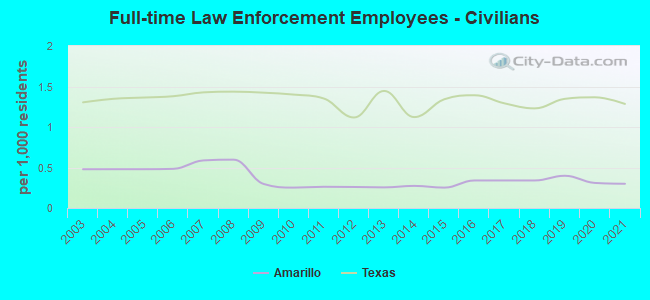
Full-time law enforcement employees in 2021, including police officers: 405 (345 officers - 304 male; 41 female).
| Officers per 1,000 residents here: | 1.72 |
| Texas average: | 2.07 |
Full-time law enforcement employees in 2020, including police officers: 416 (354 officers - 315 male; 39 female).
| Officers per 1,000 residents here: | 1.77 |
| Texas average: | 2.05 |
Full-time law enforcement employees in 2019, including police officers: 413 (333 officers - 302 male; 31 female).
| Officers per 1,000 residents here: | 1.66 |
| Texas average: | 2.02 |
Full-time law enforcement employees in 2016, including police officers: 411 (343 officers - 320 male; 23 female).
| Officers per 1,000 residents here: | 1.71 |
| Texas average: | 2.11 |
Full-time law enforcement employees in 2015, including police officers: 392 (342 officers - 319 male; 23 female).
| Officers per 1,000 residents here: | 1.72 |
| Texas average: | 2.13 |
Full-time law enforcement employees in 2014, including police officers: 412 (358 officers - 333 male; 25 female).
| Officers per 1,000 residents here: | 1.81 |
| Texas average: | 2.01 |
Full-time law enforcement employees in 2013, including police officers: 389 (339 officers - 315 male; 24 female).
| Officers per 1,000 residents here: | 1.72 |
| Texas average: | 2.05 |
Full-time law enforcement employees in 2012, including police officers: 374 (323 officers - 299 male; 24 female).
| Officers per 1,000 residents here: | 1.64 |
| Texas average: | 1.95 |
Full-time law enforcement employees in 2011, including police officers: 371 (320 officers - 295 male; 25 female).
| Officers per 1,000 residents here: | 1.64 |
| Texas average: | 2.17 |
Full-time law enforcement employees in 2010, including police officers: 357 (309 officers - 285 male; 24 female).
| Officers per 1,000 residents here: | 1.62 |
| Texas average: | 2.20 |
Full-time law enforcement employees in 2009, including police officers: 364 (308 officers - 283 male; 25 female).
| Officers per 1,000 residents here: | 1.63 |
| Texas average: | 2.23 |
Full-time law enforcement employees in 2008, including police officers: 420 (308 officers - 280 male; 28 female).
| Officers per 1,000 residents here: | 1.64 |
| Texas average: | 2.17 |
Full-time law enforcement employees in 2007, including police officers: 413 (303 officers - 276 male; 27 female).
| Officers per 1,000 residents here: | 1.62 |
| Texas average: | 2.18 |
Full-time law enforcement employees in 2006, including police officers: 386 (295 officers - 272 male; 23 female).
| Officers per 1,000 residents here: | 1.57 |
| Texas average: | 2.13 |
Full-time law enforcement employees in 2005, including police officers: 379 (291 officers - 269 male; 22 female).
| Officers per 1,000 residents here: | 1.58 |
| Texas average: | 2.18 |
Full-time law enforcement employees in 2004, including police officers: 359 (272 officers - 250 male; 22 female).
| Officers per 1,000 residents here: | 1.50 |
| Texas average: | 2.19 |
Full-time law enforcement employees in 2003, including police officers: 369 (283 officers - 262 male; 21 female).
| Officers per 1,000 residents here: | 1.57 |
| Texas average: | 2.17 |


Zip codes: 79101, 79102, 79103, 79104, 79106, 79107, 79108, 79109, 79110, 79111, 79118, 79119, 79121, 79124.