Crime rate in Binghamton, New York (NY): murders, rapes, robberies, assaults, burglaries, thefts, auto thefts, arson, law enforcement employees, police officers, crime map
Crime rate in Binghamton, NY
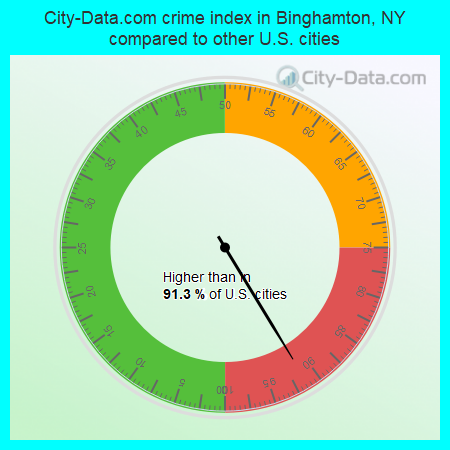
The 2022 crime rate in Binghamton, NY is 347 (City-Data.com crime index), which is 1.4 times greater than the U.S. average. It was higher than in 91.3% U.S. cities. The 2022 Binghamton crime rate fell by 13% compared to 2021. In the last 5 years Binghamton has seen decreasing violent crime and decreasing property crime.See how dangerous Binghamton, NY is compared to the nearest cities:
(Note: Higher means more crime)
(Note: Higher means more crime)
| Binghamton: | 347.3 |
| Port Dickinson: | 6.5 |
| Johnson City: | 317.3 |
| Vestal: | 125.9 |
| Endicott: | 283.6 |
| Greene: | 42.9 |
| Owego: | 131.1 |
| Montrose: | 27.4 |
| Lanesboro: | 62.2 |
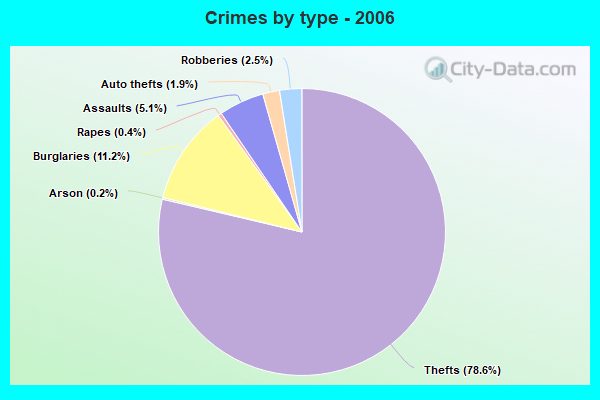
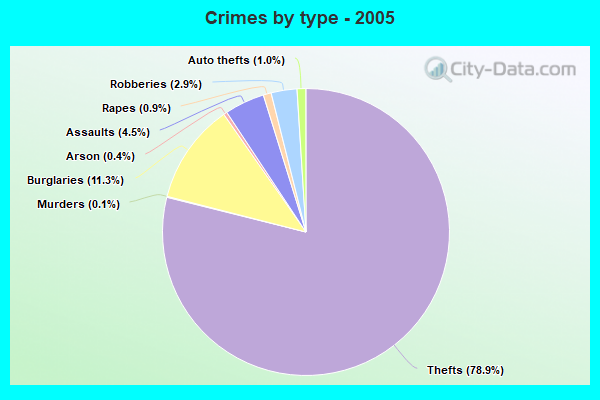
Type |
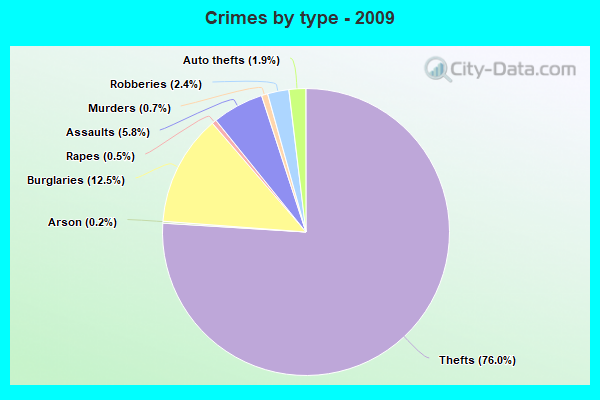
2009 |
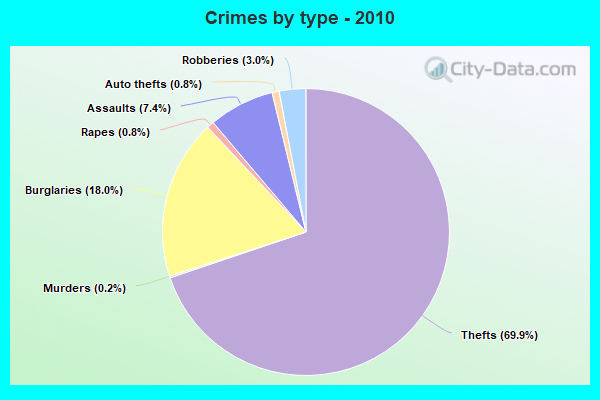
2010 |
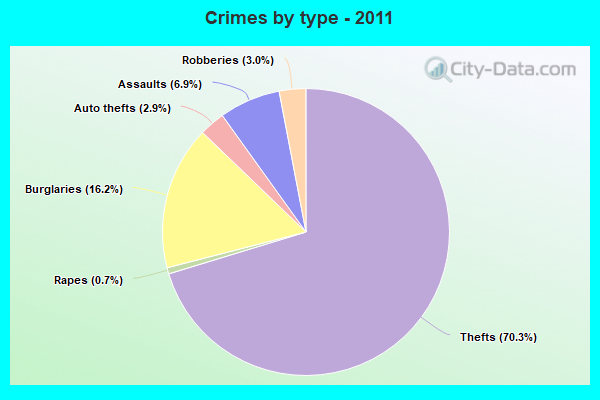
2011 |
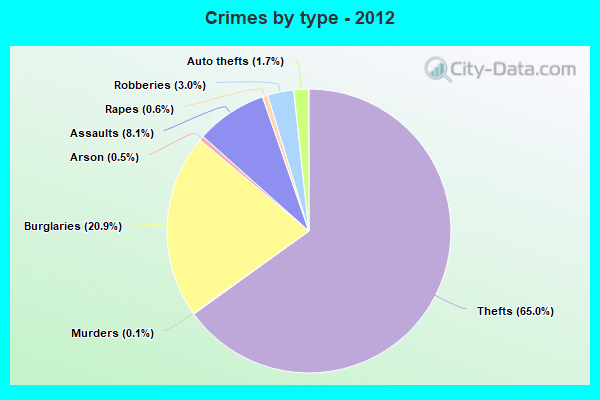
2012 |
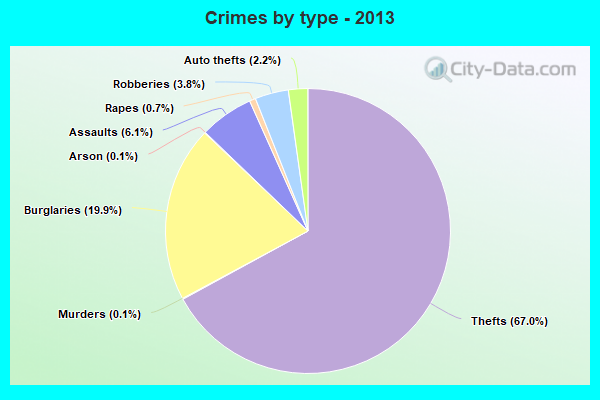
2013 |
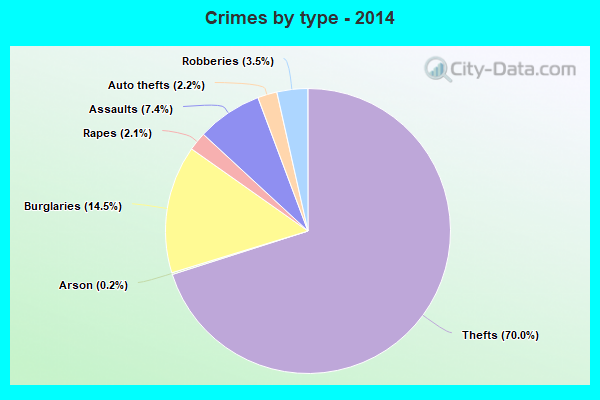
2014 |
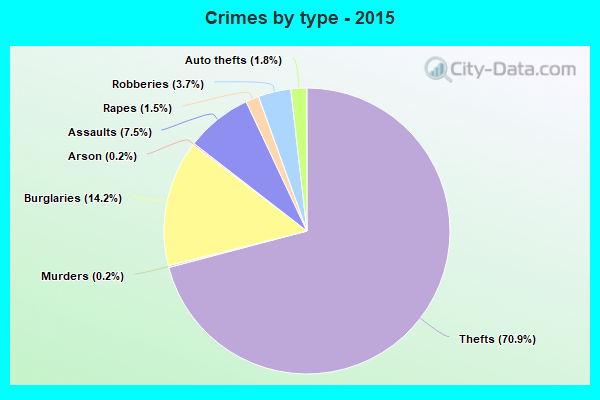
2015 |
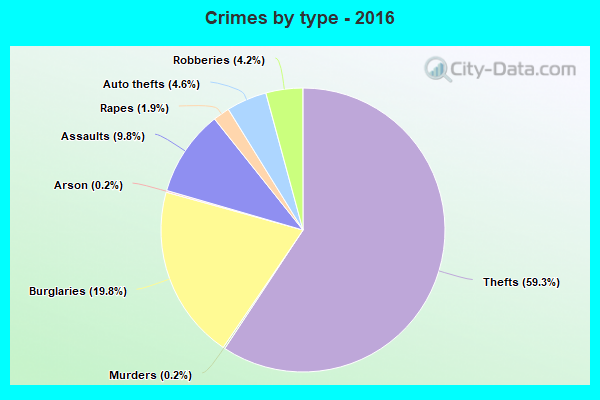
2016 |
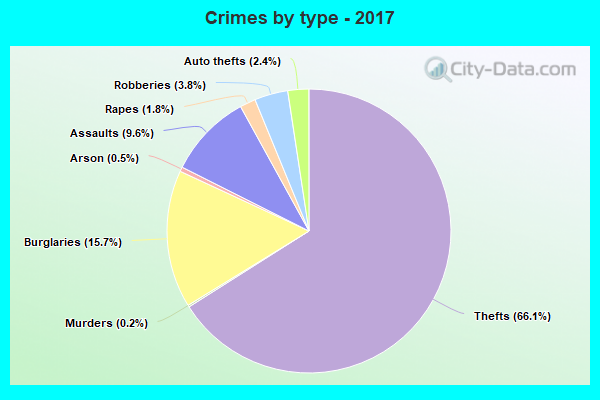
2017 |
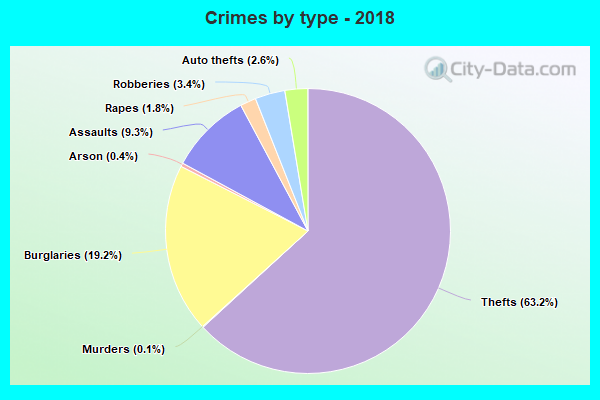
2018 |
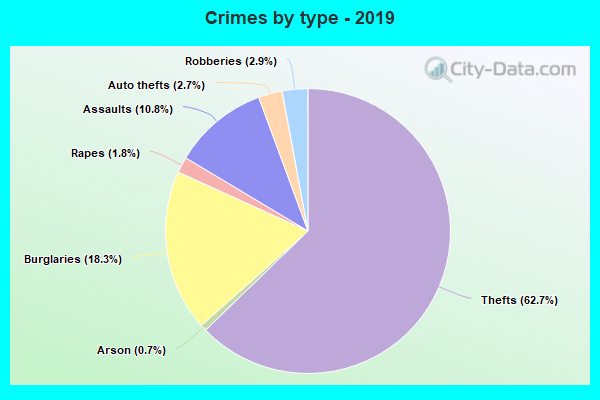
2019 |
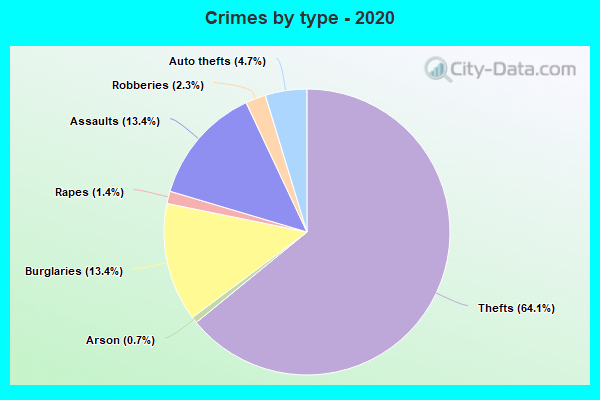
2020 |
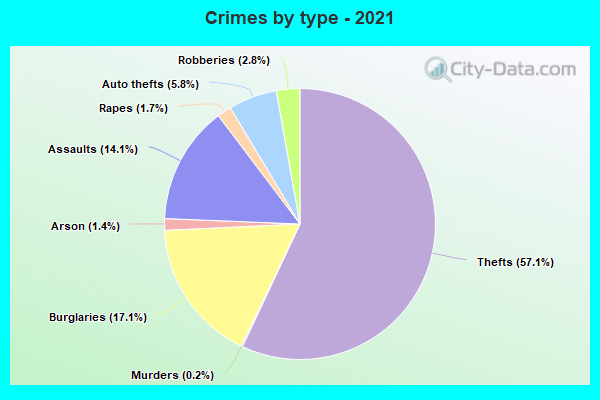
2021 |
2022 |
|---|---|---|---|---|---|---|---|---|---|---|---|---|---|---|
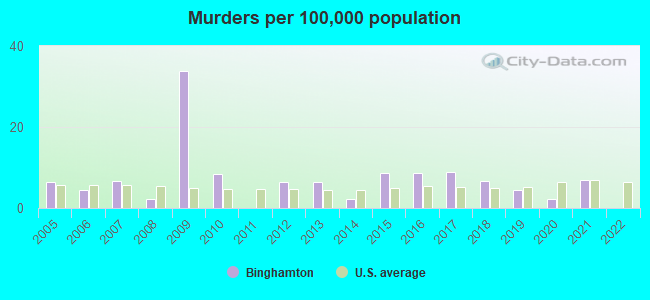
| Murders (per 100,000) | 15 (33.7) | 4 (8.4) | 0 (0.0) | 3 (6.3) | 3 (6.5) | 1 (2.2) | 4 (8.7) | 4 (8.7) | 4 (8.8) | 3 (6.7) | 2 (4.5) | 1 (2.3) | 3 (6.8) | 0 (0.0) |
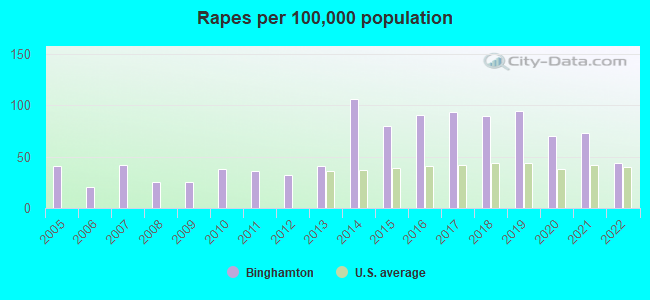
| Rapes (per 100,000) | 11 (24.7) | 18 (38.0) | 17 (35.7) | 15 (31.7) | 19 (41.0) | 49 (106.0) | 37 (80.4) | 41 (89.6) | 42 (92.5) | 40 (89.1) | 42 (94.4) | 31 (70.3) | 32 (73.0) | 21 (44.4) |
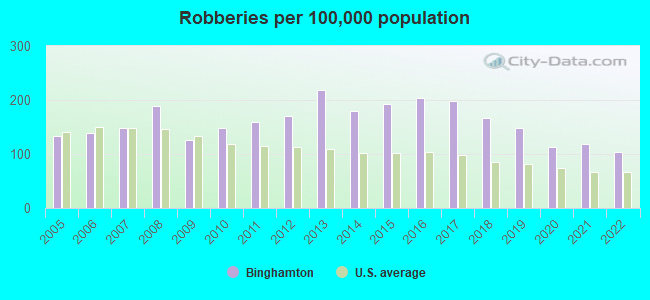
| Robberies (per 100,000) | 56 (126.0) | 70 (147.8) | 76 (159.7) | 81 (171.4) | 101 (218.1) | 83 (179.5) | 89 (193.3) | 93 (203.1) | 90 (198.2) | 75 (167.1) | 66 (148.4) | 50 (113.4) | 52 (118.6) | 49 (103.7) |
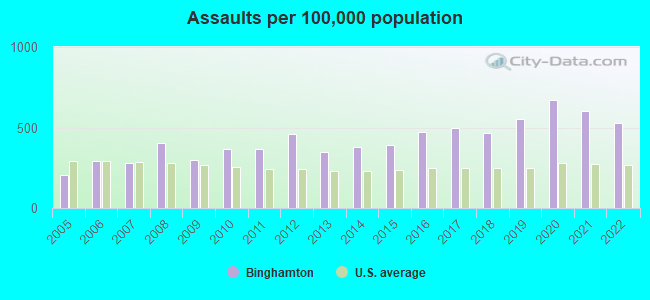
| Assaults (per 100,000) | 134 (301.4) | 174 (367.3) | 175 (367.7) | 216 (457.1) | 161 (347.7) | 174 (376.4) | 180 (390.9) | 215 (469.6) | 226 (497.8) | 208 (463.5) | 245 (550.9) | 296 (671.5) | 265 (604.6) | 248 (524.8) |
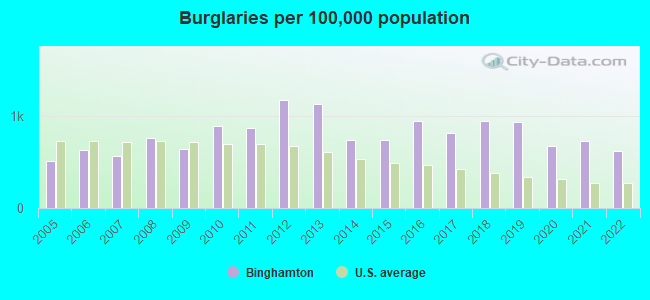
| Burglaries (per 100,000) | 286 (643.3) | 423 (892.9) | 415 (872.1) | 558 (1,181) | 525 (1,134) | 343 (742.0) | 342 (742.7) | 435 (950.2) | 370 (815.0) | 427 (951.5) | 417 (937.6) | 297 (673.7) | 322 (734.7) | 294 (622.1) |
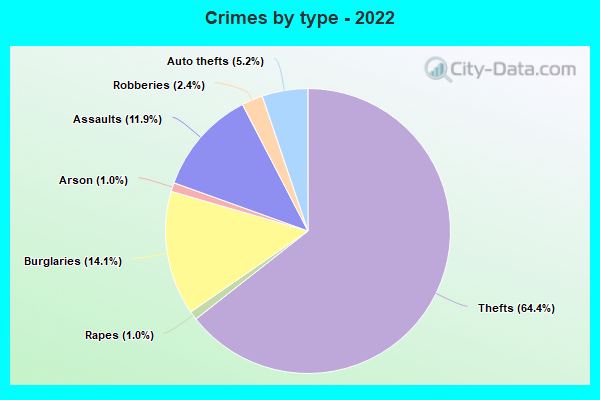
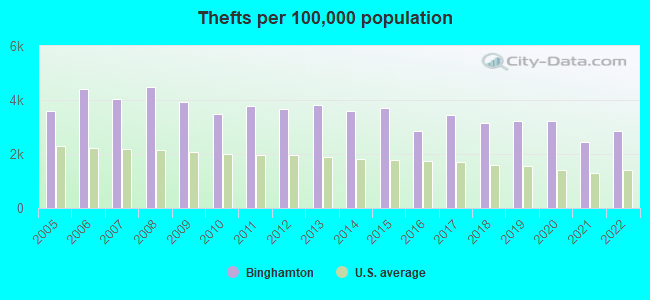
| Thefts (per 100,000) | 1,744 (3,923) | 1,644 (3,470) | 1,796 (3,774) | 1,732 (3,666) | 1,767 (3,816) | 1,653 (3,576) | 1,707 (3,707) | 1,304 (2,848) | 1,557 (3,430) | 1,407 (3,135) | 1,429 (3,213) | 1,417 (3,214) | 1,077 (2,457) | 1,343 (2,842) |
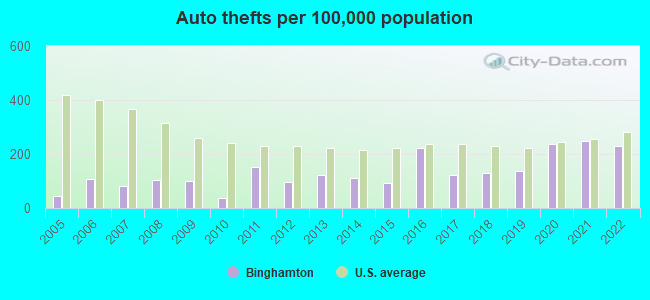
| Auto thefts (per 100,000) | 44 (99.0) | 18 (38.0) | 73 (153.4) | 46 (97.4) | 57 (123.1) | 52 (112.5) | 43 (93.4) | 102 (222.8) | 56 (123.4) | 59 (131.5) | 61 (137.2) | 104 (235.9) | 109 (248.7) | 109 (230.6) |
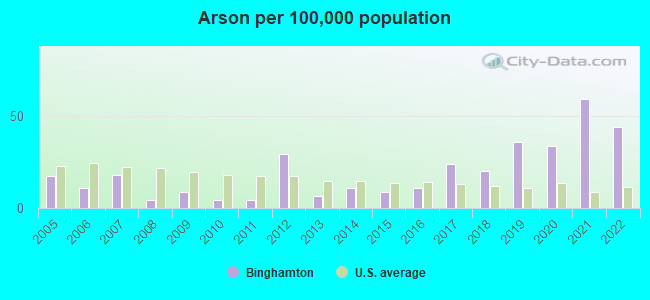
| Arson (per 100,000) | 4 (9.0) | 2 (4.2) | 2 (4.2) | 14 (29.6) | 3 (6.5) | 5 (10.8) | 4 (8.7) | 5 (10.9) | 11 (24.2) | 9 (20.1) | 16 (36.0) | 15 (34.0) | 26 (59.3) | 21 (44.4) |
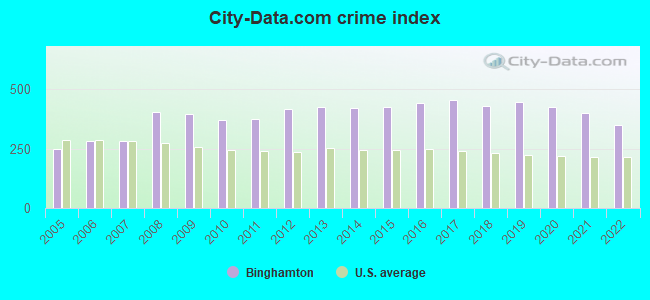
| City-Data.com crime index | 395.2 | 369.4 | 374.3 | 418.0 | 422.6 | 422.2 | 425.6 | 442.3 | 454.8 | 430.1 | 444.4 | 423.7 | 398.2 | 347.3 |
The City-Data.com crime index weighs serious crimes and violent crimes more heavily. Higher means more crime, U.S. average is 246.1. It adjusts for the number of visitors and daily workers commuting into cities.
According to our research of New York and other state lists, there were 219 registered sex offenders living in Binghamton, New York as of May 21, 2024.
The ratio of all residents to sex offenders in Binghamton is 209 to 1.
Violent crime rate in 2022
| Binghamton: | 358.7 |
| U.S. Average: | 219.8 |
Violent crime rate in 2021
| Binghamton: | 448.3 |
| U.S. Average: | 224.8 |
Violent crime rate in 2020
| Binghamton: | 467.3 |
| U.S. Average: | 228.2 |
Violent crime rate in 2019
| Binghamton: | 453.1 |
| U.S. Average: | 219.9 |
Violent crime rate in 2018
| Binghamton: | 417.8 |
| U.S. Average: | 221.2 |
Violent crime rate in 2017
| Binghamton: | 458.2 |
| U.S. Average: | 226.2 |
Violent crime rate in 2016
| Binghamton: | 443.4 |
| U.S. Average: | 227.3 |
Violent crime rate in 2015
| Binghamton: | 389.8 |
| U.S. Average: | 219.3 |
Violent crime rate in 2014
| Binghamton: | 388.3 |
| U.S. Average: | 211.1 |
Violent crime rate in 2013
| Binghamton: | 336.9 |
| U.S. Average: | 214.2 |
Violent crime rate in 2012
| Binghamton: | 358.7 |
| U.S. Average: | 187.4 |
Violent crime rate in 2011
| Binghamton: | 299.4 |
| U.S. Average: | 187.1 |
Violent crime rate in 2010
| Binghamton: | 312.4 |
| U.S. Average: | 195.7 |
Violent crime rate in 2009
| Binghamton: | 305.9 |
| U.S. Average: | 208.9 |
Violent crime rate in 2008
| Binghamton: | 324.1 |
| U.S. Average: | 222.5 |
Violent crime rate in 2007
| Binghamton: | 214.9 |
| U.S. Average: | 229.1 |
Violent crime rate in 2006
| Binghamton: | 193.3 |
| U.S. Average: | 232.6 |
Violent crime rate in 2005
| Binghamton: | 178.1 |
| U.S. Average: | 227.0 |
Property crime rate in 2022
| Binghamton: | 301.1 |
| U.S. Average: | 166.5 |
Property crime rate in 2021
| Binghamton: | 307.1 |
| U.S. Average: | 157.8 |
Property crime rate in 2020
| Binghamton: | 330.9 |
| U.S. Average: | 169.6 |
Property crime rate in 2019
| Binghamton: | 368.7 |
| U.S. Average: | 179.7 |
Property crime rate in 2018
| Binghamton: | 366.8 |
| U.S. Average: | 190.2 |
Property crime rate in 2017
| Binghamton: | 353.0 |
| U.S. Average: | 206.4 |
Property crime rate in 2016
| Binghamton: | 365.9 |
| U.S. Average: | 216.6 |
Property crime rate in 2015
| Binghamton: | 347.9 |
| U.S. Average: | 221.5 |
Property crime rate in 2014
| Binghamton: | 344.0 |
| U.S. Average: | 230.8 |
Property crime rate in 2013
| Binghamton: | 436.0 |
| U.S. Average: | 250.4 |
Property crime rate in 2012
| Binghamton: | 434.1 |
| U.S. Average: | 267.3 |
Property crime rate in 2011
| Binghamton: | 386.1 |
| U.S. Average: | 273.5 |
Property crime rate in 2010
| Binghamton: | 357.8 |
| U.S. Average: | 276.4 |
Property crime rate in 2009
| Binghamton: | 339.7 |
| U.S. Average: | 285.6 |
Property crime rate in 2008
| Binghamton: | 392.1 |
| U.S. Average: | 302.2 |
Property crime rate in 2007
| Binghamton: | 260.7 |
| U.S. Average: | 309.2 |
Property crime rate in 2006
| Binghamton: | 290.0 |
| U.S. Average: | 317.3 |
Property crime rate in 2005
| Binghamton: | 230.2 |
| U.S. Average: | 322.3 |
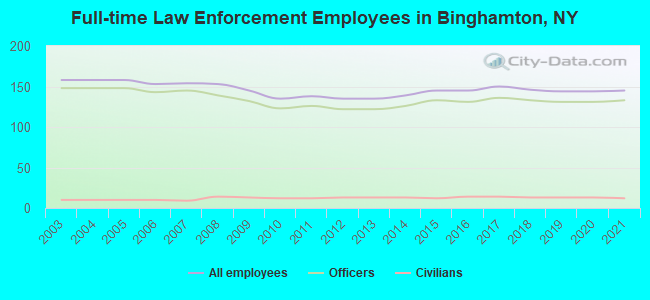
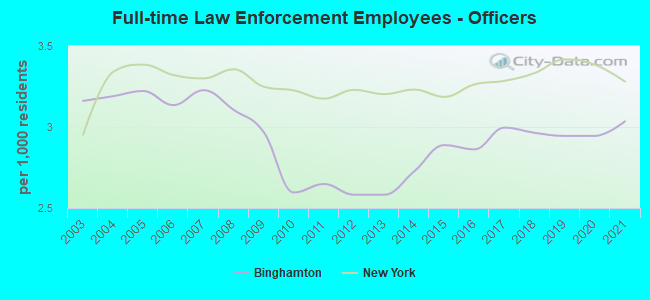
Full-time law enforcement employees in 2021, including police officers: 145 (133 officers - 120 male; 13 female).
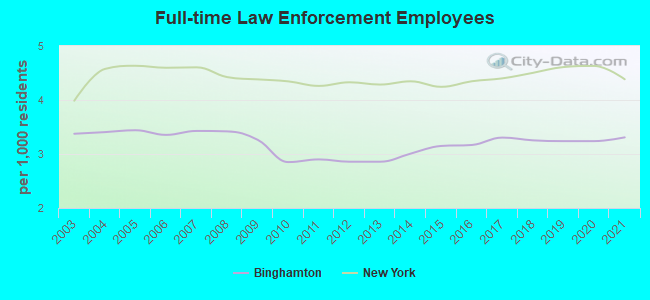
| Officers per 1,000 residents here: | 3.03 |
| New York average: | 3.28 |
Full-time law enforcement employees in 2019, including police officers: 144 (131 officers - 118 male; 13 female).
| Officers per 1,000 residents here: | 2.95 |
| New York average: | 3.42 |
Full-time law enforcement employees in 2018, including police officers: 146 (133 officers - 119 male; 14 female).
| Officers per 1,000 residents here: | 2.96 |
| New York average: | 3.33 |
Full-time law enforcement employees in 2017, including police officers: 150 (136 officers - 124 male; 12 female).
| Officers per 1,000 residents here: | 3.00 |
| New York average: | 3.28 |
Full-time law enforcement employees in 2016, including police officers: 145 (131 officers - 118 male; 13 female).
| Officers per 1,000 residents here: | 2.86 |
| New York average: | 3.26 |
Full-time law enforcement employees in 2015, including police officers: 145 (133 officers - 120 male; 13 female).
| Officers per 1,000 residents here: | 2.89 |
| New York average: | 3.19 |
Full-time law enforcement employees in 2014, including police officers: 139 (126 officers - 115 male; 11 female).
| Officers per 1,000 residents here: | 2.73 |
| New York average: | 3.23 |
Full-time law enforcement employees in 2012, including police officers: 135 (122 officers - 110 male; 12 female).
| Officers per 1,000 residents here: | 2.58 |
| New York average: | 3.23 |
Full-time law enforcement employees in 2011, including police officers: 138 (126 officers - 114 male; 12 female).
| Officers per 1,000 residents here: | 2.65 |
| New York average: | 3.18 |
Full-time law enforcement employees in 2010, including police officers: 135 (123 officers - 112 male; 11 female).
| Officers per 1,000 residents here: | 2.60 |
| New York average: | 3.23 |
Full-time law enforcement employees in 2009, including police officers: 145 (132 officers - 121 male; 11 female).
| Officers per 1,000 residents here: | 2.97 |
| New York average: | 3.25 |
Full-time law enforcement employees in 2008, including police officers: 153 (139 officers - 128 male; 11 female).
| Officers per 1,000 residents here: | 3.11 |
| New York average: | 3.36 |
Full-time law enforcement employees in 2007, including police officers: 154 (145 officers - 134 male; 11 female).
| Officers per 1,000 residents here: | 3.23 |
| New York average: | 3.30 |
Full-time law enforcement employees in 2006, including police officers: 153 (143 officers - 133 male; 10 female).
| Officers per 1,000 residents here: | 3.14 |
| New York average: | 3.32 |
Full-time law enforcement employees in 2005, including police officers: 158 (148 officers - 138 male; 10 female).
| Officers per 1,000 residents here: | 3.22 |
| New York average: | 3.39 |
Full-time law enforcement employees in 2004, including police officers: 158 (148 officers - 138 male; 10 female).
| Officers per 1,000 residents here: | 3.19 |
| New York average: | 3.34 |
Full-time law enforcement employees in 2003, including police officers: 158 (148 officers - 138 male; 10 female).
| Officers per 1,000 residents here: | 3.16 |
| New York average: | 2.95 |