Crime rate in Bridgeport, Connecticut (CT): murders, rapes, robberies, assaults, burglaries, thefts, auto thefts, arson, law enforcement employees, police officers, crime map
Crime rate in Bridgeport, CT
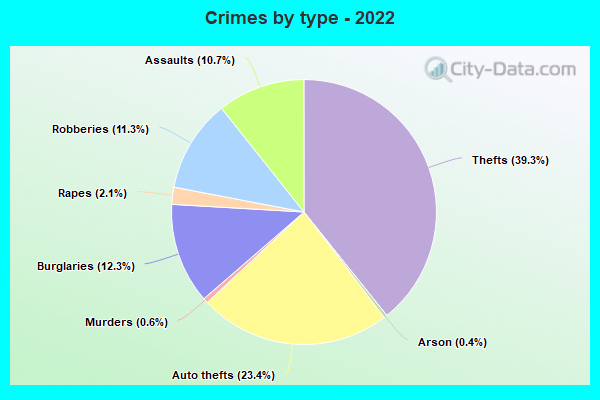
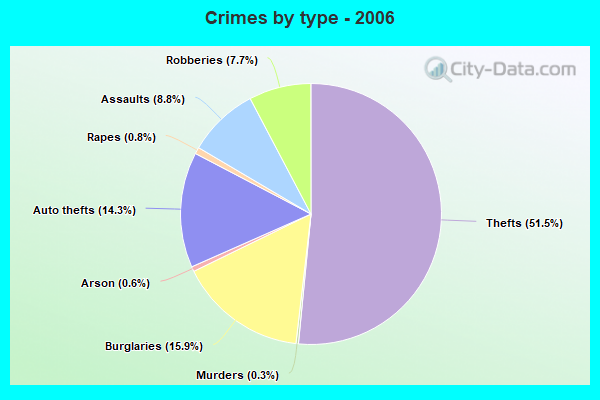
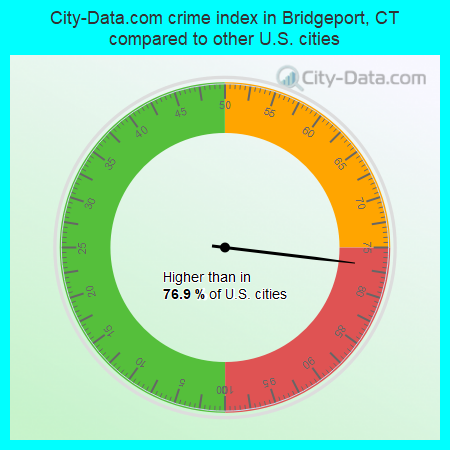
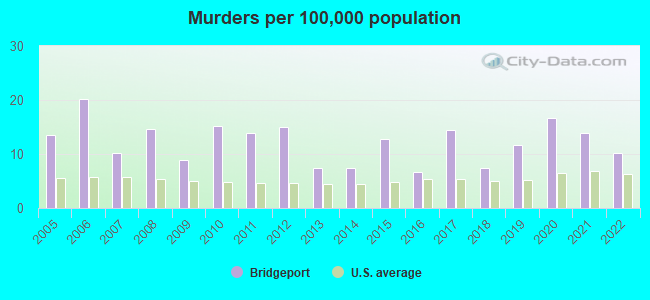
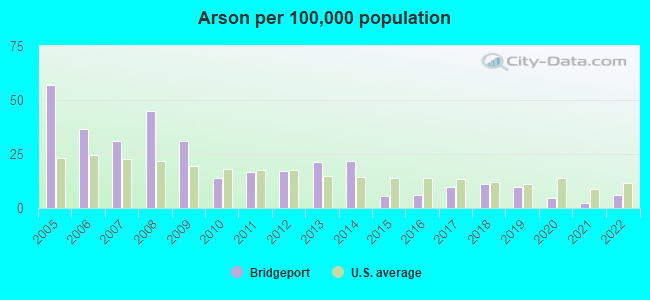
The 2022 crime rate in Bridgeport, CT is 211 (City-Data.com crime index), which is about the average for the U.S. cities. It was higher than in 76.9% U.S. cities. The 2022 Bridgeport crime rate fell by 25% compared to 2021. The number of homicides stood at 15 - a decrease of 5 compared to 2021. In the last 5 years Bridgeport has seen decline of violent crime and decreasing property crime.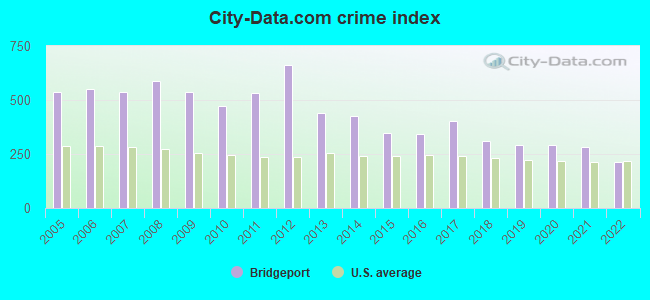
The City-Data.com crime index weighs serious crimes and violent crimes more heavily. Higher means more crime, U.S. average is 246.1. It adjusts for the number of visitors and daily workers commuting into cities.
- means the value is smaller than the state average.- means the value is about the same as the state average.
- means the value is bigger than the state average.
- means the value is much bigger than the state average.
According to our research of Connecticut and other state lists, there were 281 registered sex offenders living in Bridgeport, Connecticut as of May 21, 2024.
The ratio of all residents to sex offenders in Bridgeport is 519 to 1.
Violent crime rate in 2022
| Bridgeport: | 236.9 |
| U.S. Average: | 219.8 |
Violent crime rate in 2021
| Bridgeport: | 324.6 |
| U.S. Average: | 224.8 |
Violent crime rate in 2020
| Bridgeport: | 330.8 |
| U.S. Average: | 228.2 |
Violent crime rate in 2019
| Bridgeport: | 335.4 |
| U.S. Average: | 219.9 |
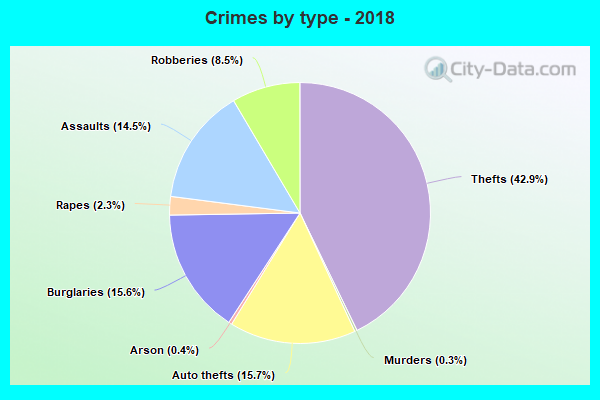
Violent crime rate in 2018
| Bridgeport: | 372.2 |
| U.S. Average: | 221.2 |
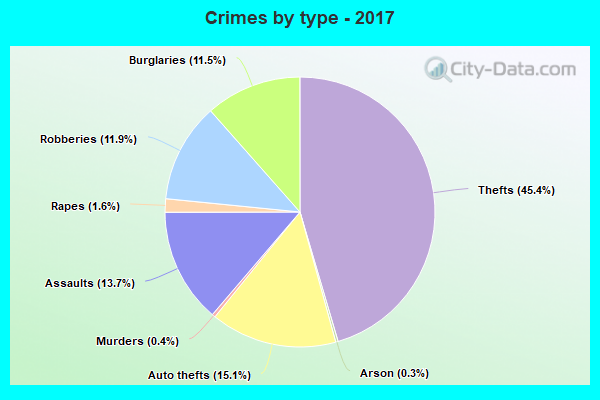
Violent crime rate in 2017
| Bridgeport: | 497.9 |
| U.S. Average: | 226.2 |
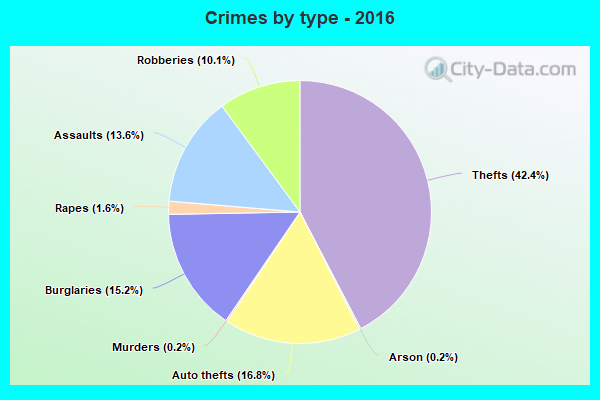
Violent crime rate in 2016
| Bridgeport: | 409.6 |
| U.S. Average: | 227.3 |
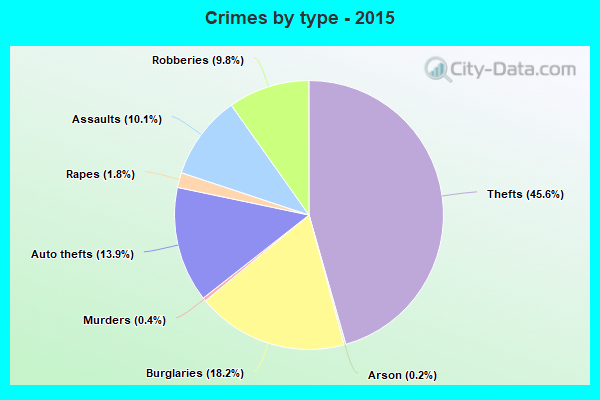
Violent crime rate in 2015
| Bridgeport: | 382.0 |
| U.S. Average: | 219.3 |
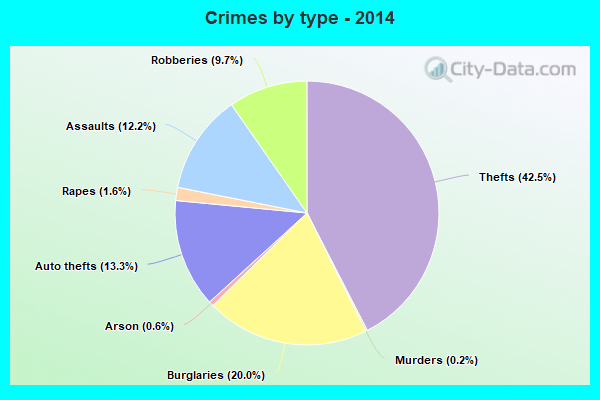
Violent crime rate in 2014
| Bridgeport: | 494.9 |
| U.S. Average: | 211.1 |
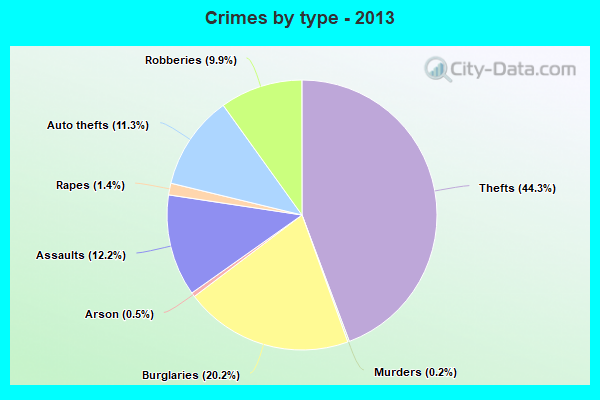
Violent crime rate in 2013
| Bridgeport: | 514.0 |
| U.S. Average: | 214.2 |
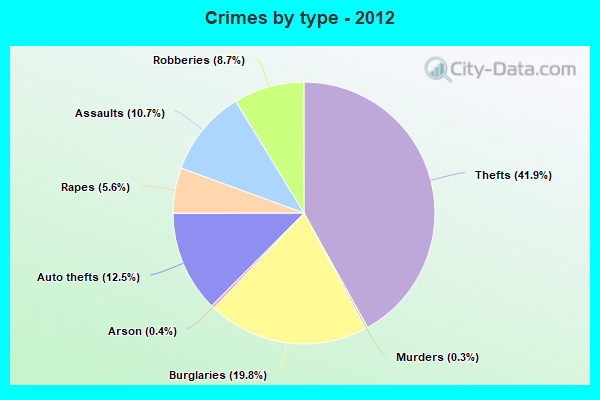
Violent crime rate in 2012
| Bridgeport: | 758.1 |
| U.S. Average: | 187.4 |
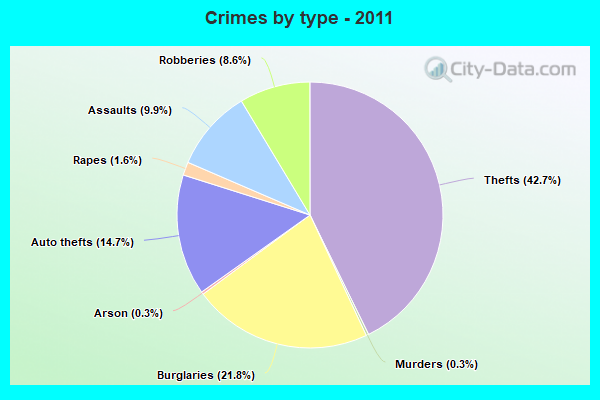
Violent crime rate in 2011
| Bridgeport: | 561.6 |
| U.S. Average: | 187.1 |
Violent crime rate in 2010
| Bridgeport: | 532.1 |
| U.S. Average: | 195.7 |
Violent crime rate in 2009
| Bridgeport: | 595.7 |
| U.S. Average: | 208.9 |
Violent crime rate in 2008
| Bridgeport: | 644.0 |
| U.S. Average: | 222.5 |
Violent crime rate in 2007
| Bridgeport: | 574.6 |
| U.S. Average: | 229.1 |
Violent crime rate in 2006
| Bridgeport: | 550.0 |
| U.S. Average: | 232.6 |
Violent crime rate in 2005
| Bridgeport: | 534.1 |
| U.S. Average: | 227.0 |
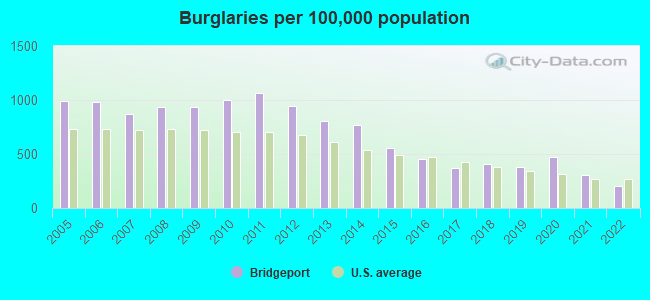
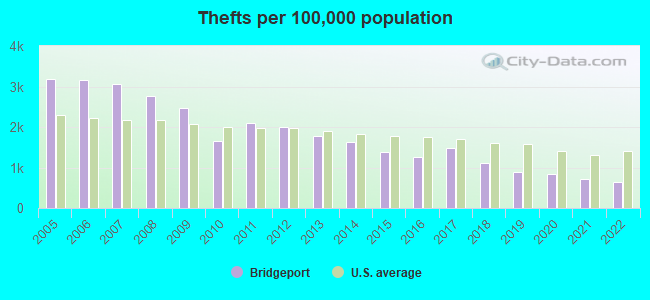
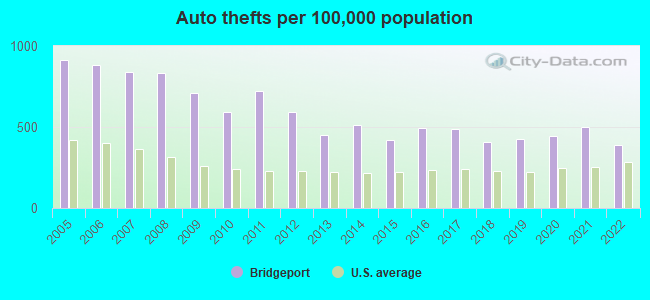
Property crime rate in 2022
| Bridgeport: | 131.5 |
| U.S. Average: | 166.5 |
Property crime rate in 2021
| Bridgeport: | 171.3 |
| U.S. Average: | 157.8 |
Property crime rate in 2020
| Bridgeport: | 202.3 |
| U.S. Average: | 169.6 |
Property crime rate in 2019
| Bridgeport: | 185.3 |
| U.S. Average: | 179.7 |
Property crime rate in 2018
| Bridgeport: | 197.8 |
| U.S. Average: | 190.2 |
Property crime rate in 2017
| Bridgeport: | 222.2 |
| U.S. Average: | 206.4 |
Property crime rate in 2016
| Bridgeport: | 227.0 |
| U.S. Average: | 216.6 |
Property crime rate in 2015
| Bridgeport: | 242.7 |
| U.S. Average: | 221.5 |
Property crime rate in 2014
| Bridgeport: | 310.5 |
| U.S. Average: | 230.8 |
Property crime rate in 2013
| Bridgeport: | 318.3 |
| U.S. Average: | 250.4 |
Property crime rate in 2012
| Bridgeport: | 377.3 |
| U.S. Average: | 267.3 |
Property crime rate in 2011
| Bridgeport: | 426.0 |
| U.S. Average: | 273.5 |
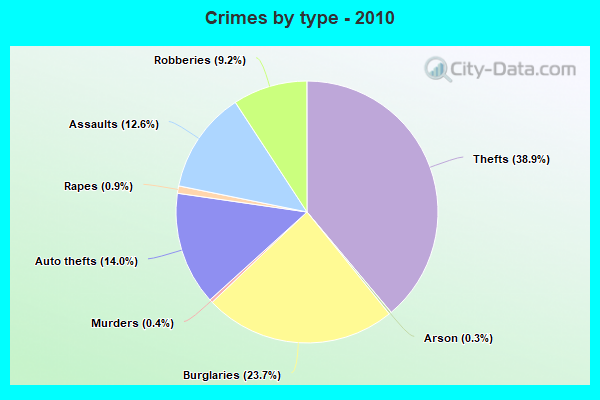
Property crime rate in 2010
| Bridgeport: | 372.4 |
| U.S. Average: | 276.4 |
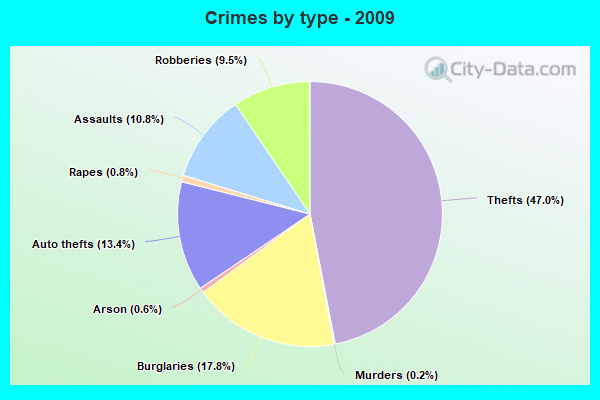
Property crime rate in 2009
| Bridgeport: | 417.9 |
| U.S. Average: | 285.6 |
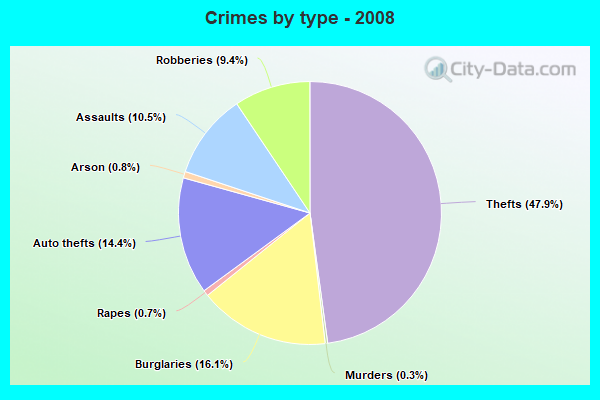
Property crime rate in 2008
| Bridgeport: | 449.5 |
| U.S. Average: | 302.2 |
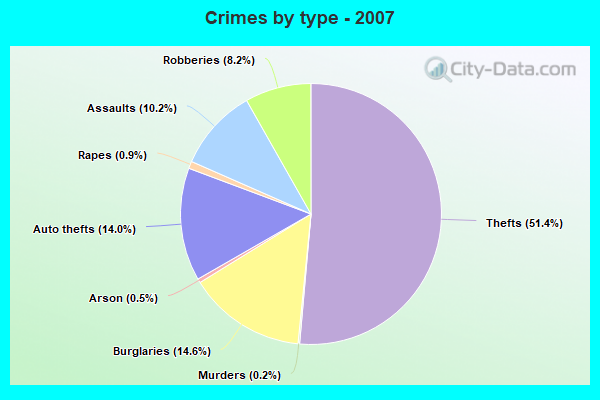
Property crime rate in 2007
| Bridgeport: | 416.6 |
| U.S. Average: | 309.2 |
Property crime rate in 2006
| Bridgeport: | 447.5 |
| U.S. Average: | 317.3 |
Property crime rate in 2005
| Bridgeport: | 453.2 |
| U.S. Average: | 322.3 |
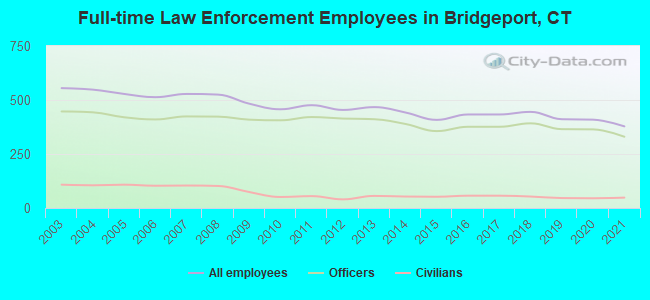
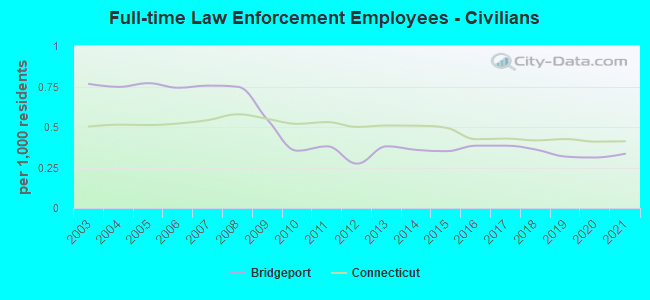
Full-time law enforcement employees in 2021, including police officers: 378 (330 officers - 281 male; 49 female).
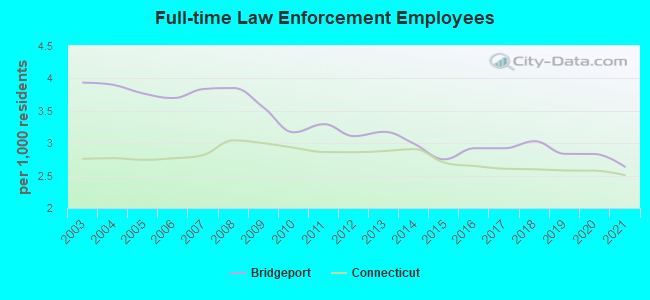
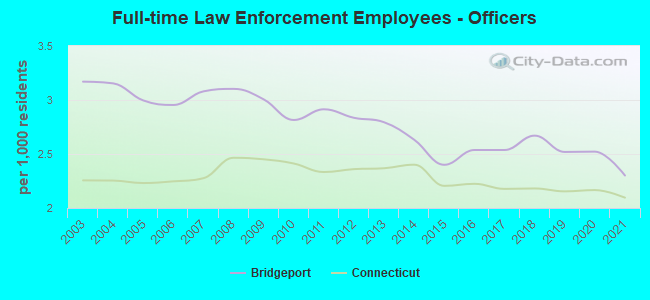
| Officers per 1,000 residents here: | 2.30 |
| Connecticut average: | 2.10 |
Full-time law enforcement employees in 2020, including police officers: 409 (364 officers - 305 male; 59 female).
| Officers per 1,000 residents here: | 2.52 |
| Connecticut average: | 2.17 |
Full-time law enforcement employees in 2019, including police officers: 411 (365 officers - 314 male; 51 female).
| Officers per 1,000 residents here: | 2.52 |
| Connecticut average: | 2.15 |
Full-time law enforcement employees in 2018, including police officers: 445 (392 officers - 338 male; 54 female).
| Officers per 1,000 residents here: | 2.67 |
| Connecticut average: | 2.18 |
Full-time law enforcement employees in 2016, including police officers: 433 (376 officers - 332 male; 44 female).
| Officers per 1,000 residents here: | 2.54 |
| Connecticut average: | 2.22 |
Full-time law enforcement employees in 2015, including police officers: 408 (356 officers - 316 male; 40 female).
| Officers per 1,000 residents here: | 2.40 |
| Connecticut average: | 2.21 |
Full-time law enforcement employees in 2014, including police officers: 442 (389 officers - 348 male; 41 female).
| Officers per 1,000 residents here: | 2.63 |
| Connecticut average: | 2.40 |
Full-time law enforcement employees in 2013, including police officers: 467 (411 officers - 369 male; 42 female).
| Officers per 1,000 residents here: | 2.79 |
| Connecticut average: | 2.37 |
Full-time law enforcement employees in 2012, including police officers: 454 (414 officers - 368 male; 46 female).
| Officers per 1,000 residents here: | 2.84 |
| Connecticut average: | 2.36 |
Full-time law enforcement employees in 2011, including police officers: 476 (421 officers - 374 male; 47 female).
| Officers per 1,000 residents here: | 2.91 |
| Connecticut average: | 2.33 |
Full-time law enforcement employees in 2010, including police officers: 457 (406 officers - 356 male; 50 female).
| Officers per 1,000 residents here: | 2.81 |
| Connecticut average: | 2.41 |
Full-time law enforcement employees in 2009, including police officers: 483 (409 officers - 361 male; 48 female).
| Officers per 1,000 residents here: | 3.01 |
| Connecticut average: | 2.45 |
Full-time law enforcement employees in 2008, including police officers: 525 (423 officers - 375 male; 48 female).
| Officers per 1,000 residents here: | 3.10 |
| Connecticut average: | 2.47 |
Full-time law enforcement employees in 2007, including police officers: 528 (424 officers - 371 male; 53 female).
| Officers per 1,000 residents here: | 3.08 |
| Connecticut average: | 2.28 |
Full-time law enforcement employees in 2006, including police officers: 513 (410 officers - 362 male; 48 female).
| Officers per 1,000 residents here: | 2.95 |
| Connecticut average: | 2.25 |
Full-time law enforcement employees in 2005, including police officers: 528 (420 officers - 372 male; 48 female).
| Officers per 1,000 residents here: | 3.00 |
| Connecticut average: | 2.23 |
Full-time law enforcement employees in 2004, including police officers: 548 (443 officers - 382 male; 61 female).
| Officers per 1,000 residents here: | 3.15 |
| Connecticut average: | 2.25 |
Full-time law enforcement employees in 2003, including police officers: 555 (447 officers - 394 male; 53 female).
| Officers per 1,000 residents here: | 3.17 |
| Connecticut average: | 2.26 |