Crime rate in Camden, New Jersey (NJ): murders, rapes, robberies, assaults, burglaries, thefts, auto thefts, arson, law enforcement employees, police officers, crime map
Crime rate in Camden, NJ
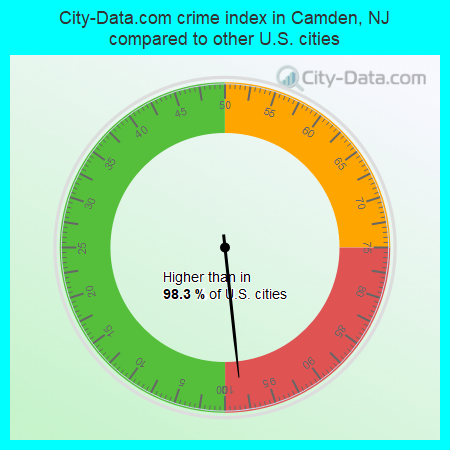
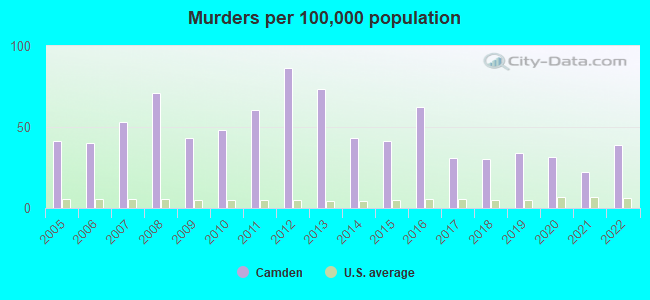
The 2022 crime rate in Camden, NJ is 610 (City-Data.com crime index), which is 2.5 times greater than the U.S. average. It was higher than in 98.3% U.S. cities. The 2022 Camden crime rate rose by 31% compared to 2021. The number of homicides stood at 28 - an increase of 11 compared to 2021. In the last 5 years Camden has seen decline of violent crime and decline of property crime.See how dangerous Camden, NJ is compared to the nearest cities:
(Note: Higher means more crime)
(Note: Higher means more crime)
| Camden: | 609.6 |
| Woodlynne: | 198.8 |
| Collingswood: | 194.6 |
| Oaklyn: | 282.0 |
| Audubon Park: | 131.2 |
| Pennsauken: | 246.5 |
| Gloucester City: | 161.8 |
| Merchantville: | 51.1 |
| Audubon: | 158.1 |
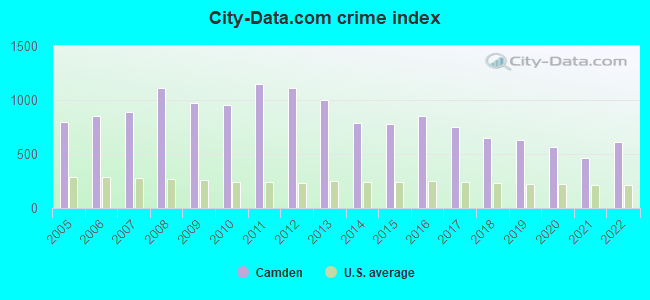
The City-Data.com crime index weighs serious crimes and violent crimes more heavily. Higher means more crime, U.S. average is 246.1. It adjusts for the number of visitors and daily workers commuting into cities.
- means the value is smaller than the state average.- means the value is about the same as the state average.
- means the value is bigger than the state average.
- means the value is much bigger than the state average.
According to our research of New Jersey and other state lists, there were 262 registered sex offenders living in Camden, New Jersey as of May 15, 2024.
The ratio of all residents to sex offenders in Camden is 290 to 1.
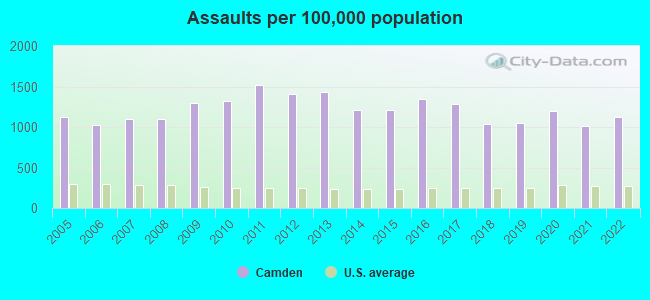
Violent crime rate in 2022
| Camden: | 880.4 |
| U.S. Average: | 219.8 |
Violent crime rate in 2021
| Camden: | 740.8 |
| U.S. Average: | 224.8 |
Violent crime rate in 2020
| Camden: | 886.1 |
| U.S. Average: | 228.2 |
Violent crime rate in 2019
| Camden: | 887.8 |
| U.S. Average: | 219.9 |
Violent crime rate in 2018
| Camden: | 907.2 |
| U.S. Average: | 221.2 |
Violent crime rate in 2017
| Camden: | 1,080.8 |
| U.S. Average: | 226.2 |
Violent crime rate in 2016
| Camden: | 1,194.1 |
| U.S. Average: | 227.3 |
Violent crime rate in 2015
| Camden: | 1,095.4 |
| U.S. Average: | 219.3 |
Violent crime rate in 2014
| Camden: | 1,105.4 |
| U.S. Average: | 211.1 |
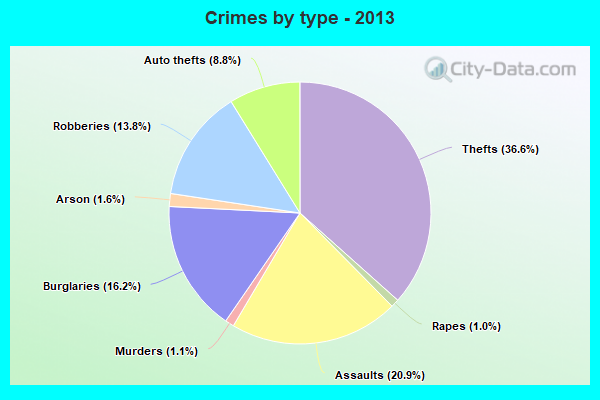
Violent crime rate in 2013
| Camden: | 1,407.3 |
| U.S. Average: | 214.2 |
Violent crime rate in 2012
| Camden: | 1,460.1 |
| U.S. Average: | 187.4 |
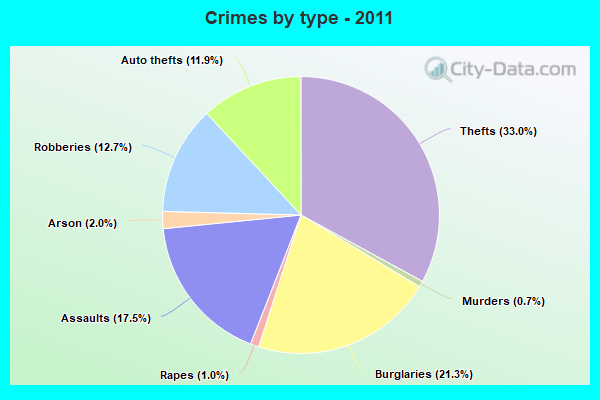
Violent crime rate in 2011
| Camden: | 1,519.9 |
| U.S. Average: | 187.1 |
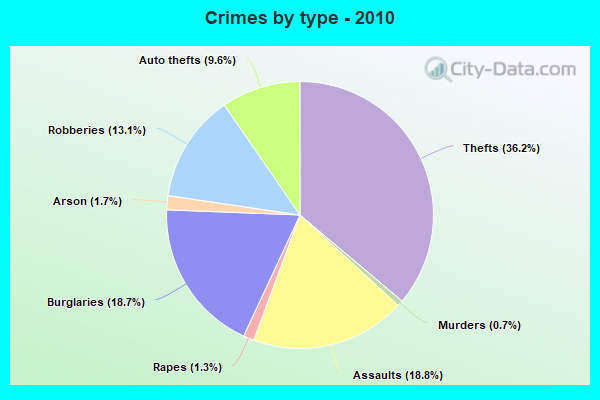
Violent crime rate in 2010
| Camden: | 1,309.1 |
| U.S. Average: | 195.7 |
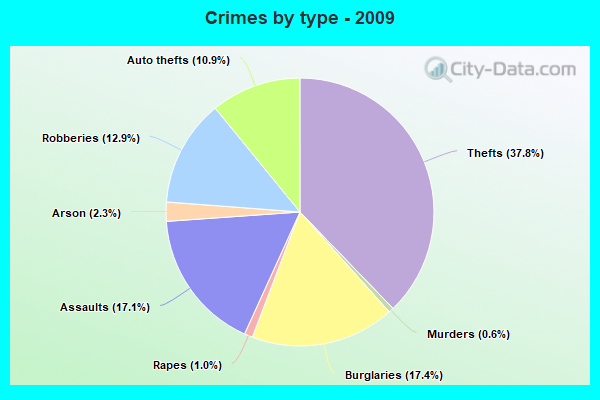
Violent crime rate in 2009
| Camden: | 1,292.7 |
| U.S. Average: | 208.9 |
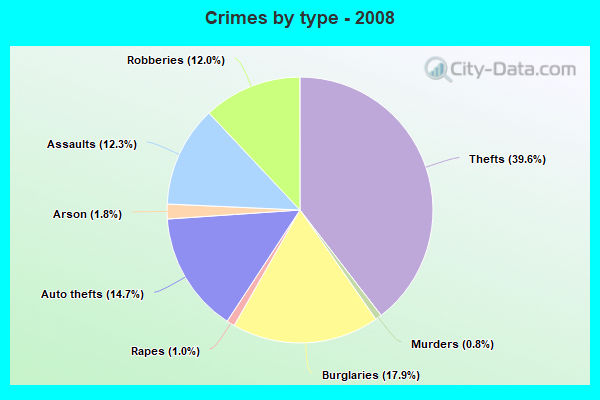
Violent crime rate in 2008
| Camden: | 1,318.6 |
| U.S. Average: | 222.5 |
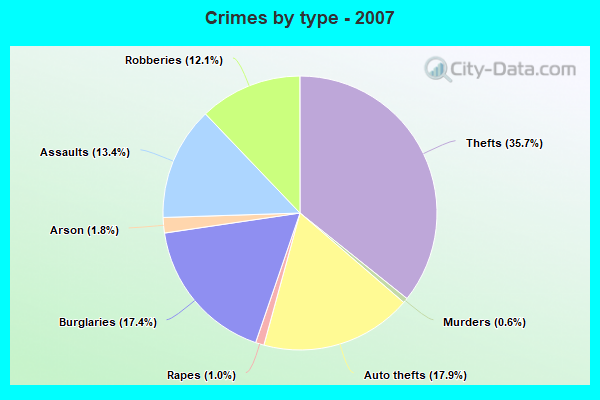
Violent crime rate in 2007
| Camden: | 1,073.7 |
| U.S. Average: | 229.1 |
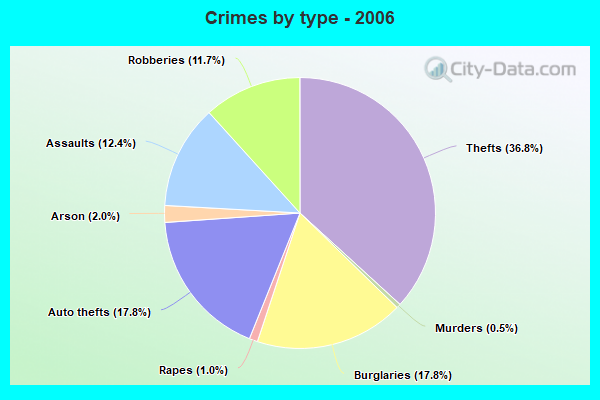
Violent crime rate in 2006
| Camden: | 1,008.3 |
| U.S. Average: | 232.6 |
Violent crime rate in 2005
| Camden: | 991.9 |
| U.S. Average: | 227.0 |
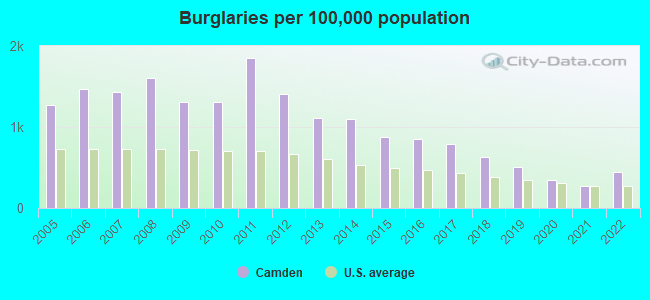
Property crime rate in 2022
| Camden: | 264.0 |
| U.S. Average: | 166.5 |
Property crime rate in 2021
| Camden: | 165.0 |
| U.S. Average: | 157.8 |
Property crime rate in 2020
| Camden: | 209.6 |
| U.S. Average: | 169.6 |
Property crime rate in 2019
| Camden: | 292.5 |
| U.S. Average: | 179.7 |
Property crime rate in 2018
| Camden: | 316.6 |
| U.S. Average: | 190.2 |
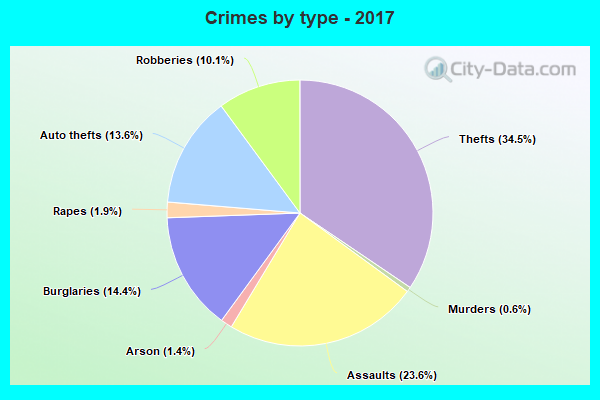
Property crime rate in 2017
| Camden: | 361.7 |
| U.S. Average: | 206.4 |
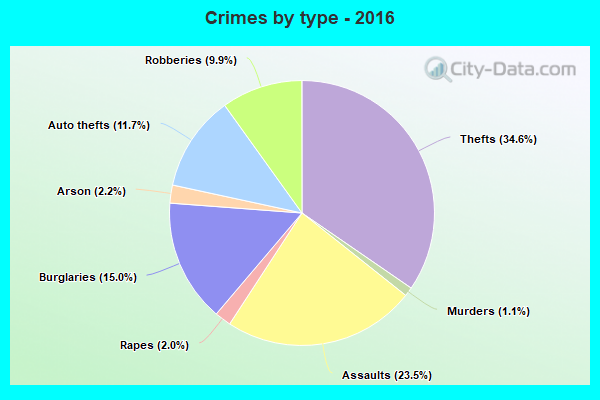
Property crime rate in 2016
| Camden: | 370.6 |
| U.S. Average: | 216.6 |
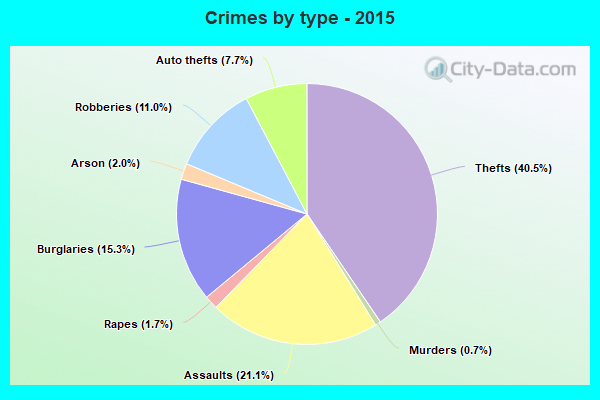
Property crime rate in 2015
| Camden: | 355.7 |
| U.S. Average: | 221.5 |
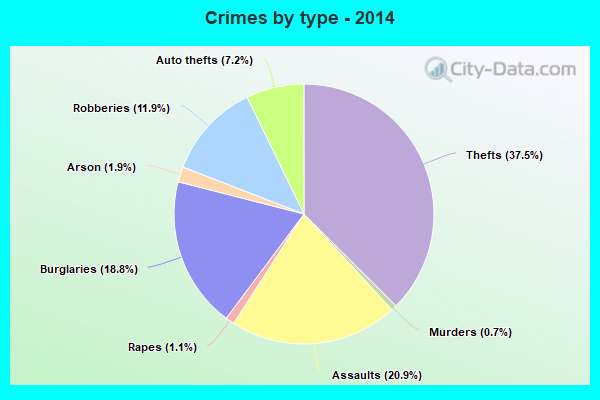
Property crime rate in 2014
| Camden: | 391.4 |
| U.S. Average: | 230.8 |
Property crime rate in 2013
| Camden: | 437.1 |
| U.S. Average: | 250.4 |
Property crime rate in 2012
| Camden: | 558.9 |
| U.S. Average: | 267.3 |
Property crime rate in 2011
| Camden: | 668.1 |
| U.S. Average: | 273.5 |
Property crime rate in 2010
| Camden: | 490.2 |
| U.S. Average: | 276.4 |
Property crime rate in 2009
| Camden: | 527.9 |
| U.S. Average: | 285.6 |
Property crime rate in 2008
| Camden: | 693.8 |
| U.S. Average: | 302.2 |
Property crime rate in 2007
| Camden: | 568.0 |
| U.S. Average: | 309.2 |
Property crime rate in 2006
| Camden: | 580.5 |
| U.S. Average: | 317.3 |
Property crime rate in 2005
| Camden: | 503.9 |
| U.S. Average: | 322.3 |
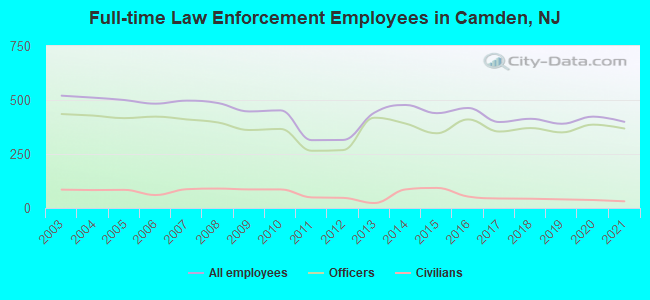
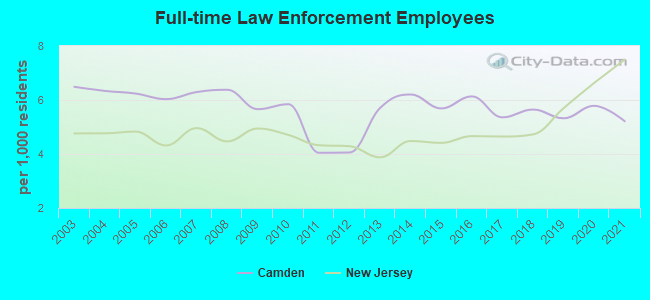
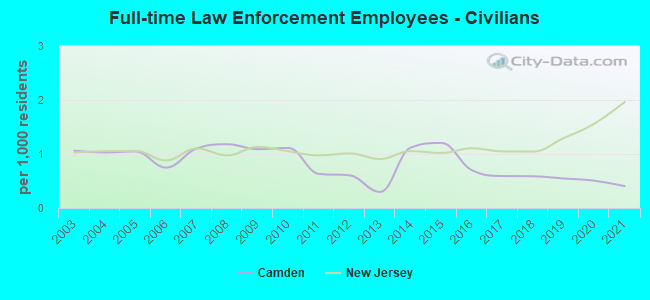
Full-time law enforcement employees in 2021, including police officers: 399 (368 officers - 313 male; 55 female).
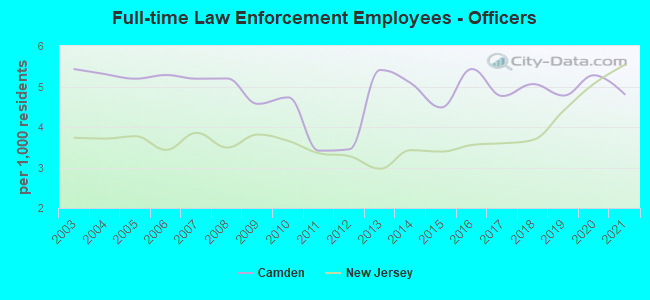
| Officers per 1,000 residents here: | 4.81 |
| New Jersey average: | 5.53 |
Full-time law enforcement employees in 2020, including police officers: 423 (386 officers - 332 male; 54 female).
| Officers per 1,000 residents here: | 5.28 |
| New Jersey average: | 5.07 |
Full-time law enforcement employees in 2019, including police officers: 390 (350 officers - 300 male; 50 female).
| Officers per 1,000 residents here: | 4.78 |
| New Jersey average: | 4.40 |
Full-time law enforcement employees in 2018, including police officers: 413 (370 officers - 317 male; 53 female).
| Officers per 1,000 residents here: | 5.06 |
| New Jersey average: | 3.68 |
Full-time law enforcement employees in 2017, including police officers: 398 (354 officers - 308 male; 46 female).
| Officers per 1,000 residents here: | 4.76 |
| New Jersey average: | 3.60 |
Full-time law enforcement employees in 2016, including police officers: 463 (410 officers - 354 male; 56 female).
| Officers per 1,000 residents here: | 5.43 |
| New Jersey average: | 3.56 |
Full-time law enforcement employees in 2015, including police officers: 439 (346 officers - 301 male; 45 female).
| Officers per 1,000 residents here: | 4.48 |
| New Jersey average: | 3.39 |
Full-time law enforcement employees in 2014, including police officers: 477 (391 officers - 342 male; 49 female).
| Officers per 1,000 residents here: | 5.09 |
| New Jersey average: | 3.43 |
Full-time law enforcement employees in 2013, including police officers: 441 (418 officers - 366 male; 52 female).
| Officers per 1,000 residents here: | 5.41 |
| New Jersey average: | 2.97 |
Full-time law enforcement employees in 2012, including police officers: 315 (268 officers - 226 male; 42 female).
| Officers per 1,000 residents here: | 3.45 |
| New Jersey average: | 3.28 |
Full-time law enforcement employees in 2011, including police officers: 314 (265 officers - 225 male; 40 female).
| Officers per 1,000 residents here: | 3.41 |
| New Jersey average: | 3.35 |
Full-time law enforcement employees in 2010, including police officers: 452 (366 officers - 315 male; 51 female).
| Officers per 1,000 residents here: | 4.73 |
| New Jersey average: | 3.66 |
Full-time law enforcement employees in 2009, including police officers: 447 (361 officers - 311 male; 50 female).
| Officers per 1,000 residents here: | 4.57 |
| New Jersey average: | 3.81 |
Full-time law enforcement employees in 2008, including police officers: 486 (396 officers - 342 male; 54 female).
| Officers per 1,000 residents here: | 5.20 |
| New Jersey average: | 3.49 |
Full-time law enforcement employees in 2007, including police officers: 497 (410 officers - 347 male; 63 female).
| Officers per 1,000 residents here: | 5.19 |
| New Jersey average: | 3.86 |
Full-time law enforcement employees in 2006, including police officers: 483 (423 officers - 360 male; 63 female).
| Officers per 1,000 residents here: | 5.28 |
| New Jersey average: | 3.44 |
Full-time law enforcement employees in 2005, including police officers: 500 (416 officers - 357 male; 59 female).
| Officers per 1,000 residents here: | 5.19 |
| New Jersey average: | 3.77 |
Full-time law enforcement employees in 2004, including police officers: 511 (428 officers - 365 male; 63 female).
| Officers per 1,000 residents here: | 5.31 |
| New Jersey average: | 3.71 |
Full-time law enforcement employees in 2003, including police officers: 520 (435 officers - 369 male; 66 female).
| Officers per 1,000 residents here: | 5.43 |
| New Jersey average: | 3.74 |