Crime rate in Chattanooga, Tennessee (TN): murders, rapes, robberies, assaults, burglaries, thefts, auto thefts, arson, law enforcement employees, police officers, crime map
Crime rate in Chattanooga, TN
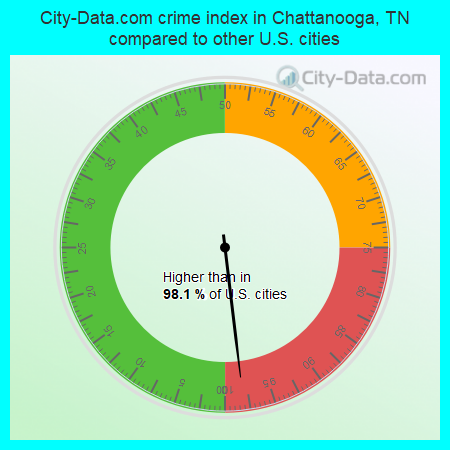
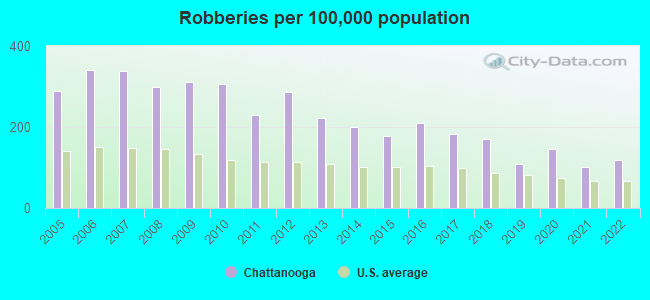
The 2022 crime rate in Chattanooga, TN is 574 (City-Data.com crime index), which is 2.3 times greater than the U.S. average. It was higher than in 98.1% U.S. cities. The 2022 Chattanooga crime rate fell by 12% compared to 2021. The number of homicides stood at 24 - a decrease of 11 compared to 2021. In the last 5 years Chattanooga has seen increasing violent crime and decreasing property crime.See how dangerous Chattanooga, TN is compared to the nearest cities:
(Note: Higher means more crime)
(Note: Higher means more crime)
| Chattanooga: | 573.8 |
| East Ridge: | 273.0 |
| Red Bank: | 147.3 |
| Rossville: | 272.3 |
| Lookout Mountain: | 11.4 |
| Lookout Mountain: | 14.4 |
| Fort Oglethorpe: | 187.2 |
| Signal Mountain: | 15.8 |
| Chickamauga: | 49.0 |

The City-Data.com crime index weighs serious crimes and violent crimes more heavily. Higher means more crime, U.S. average is 246.1. It adjusts for the number of visitors and daily workers commuting into cities.
- means the value is smaller than the state average.- means the value is about the same as the state average.
- means the value is bigger than the state average.
- means the value is much bigger than the state average.
According to our research of Tennessee and other state lists, there were 467 registered sex offenders living in Chattanooga, Tennessee as of May 15, 2024.
The ratio of all residents to sex offenders in Chattanooga is 383 to 1.
The ratio of registered sex offenders to all residents in this city is near the state average.
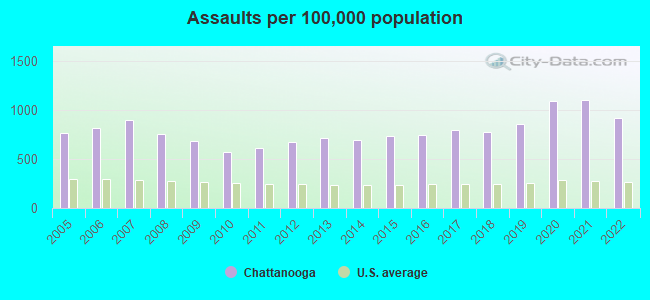
Violent crime rate in 2022
| Chattanooga: | 633.9 |
| U.S. Average: | 219.8 |
Violent crime rate in 2021
| Chattanooga: | 736.2 |
| U.S. Average: | 224.8 |
Violent crime rate in 2020
| Chattanooga: | 737.5 |
| U.S. Average: | 228.2 |
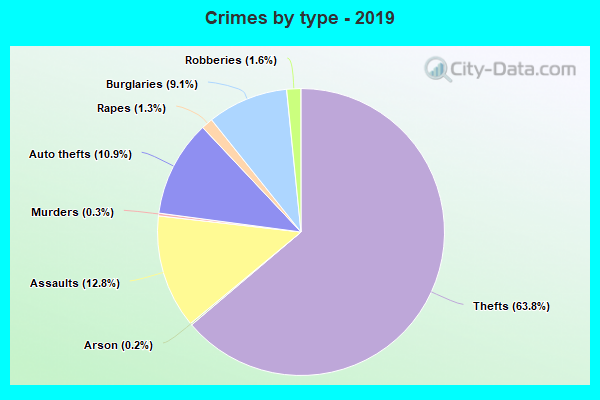
Violent crime rate in 2019
| Chattanooga: | 600.2 |
| U.S. Average: | 219.9 |
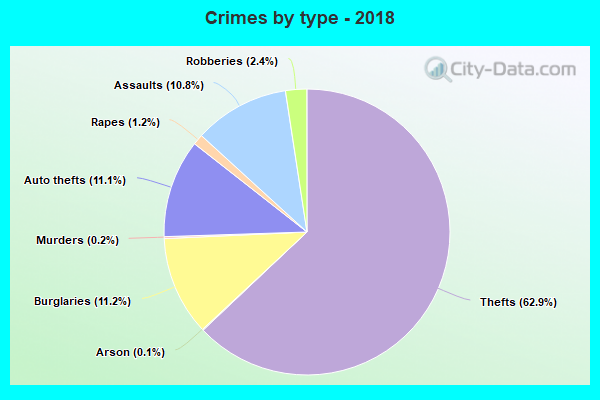
Violent crime rate in 2018
| Chattanooga: | 580.1 |
| U.S. Average: | 221.2 |
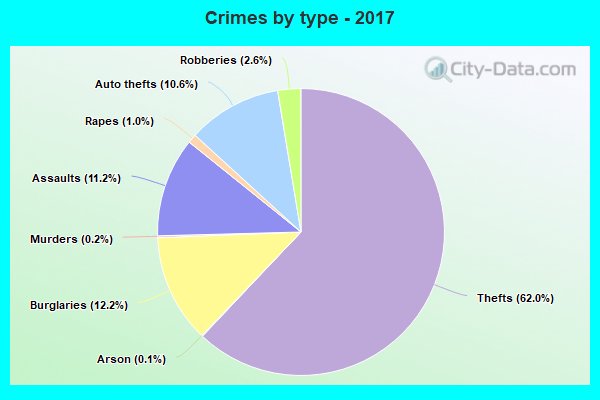
Violent crime rate in 2017
| Chattanooga: | 588.5 |
| U.S. Average: | 226.2 |
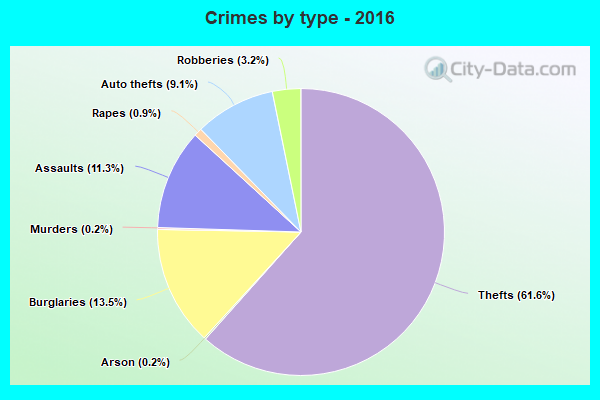
Violent crime rate in 2016
| Chattanooga: | 563.0 |
| U.S. Average: | 227.3 |
Violent crime rate in 2015
| Chattanooga: | 531.0 |
| U.S. Average: | 219.3 |
Violent crime rate in 2014
| Chattanooga: | 540.0 |
| U.S. Average: | 211.1 |
Violent crime rate in 2013
| Chattanooga: | 529.4 |
| U.S. Average: | 214.2 |
Violent crime rate in 2012
| Chattanooga: | 538.1 |
| U.S. Average: | 187.4 |
Violent crime rate in 2011
| Chattanooga: | 469.0 |
| U.S. Average: | 187.1 |
Violent crime rate in 2010
| Chattanooga: | 506.0 |
| U.S. Average: | 195.7 |
Violent crime rate in 2009
| Chattanooga: | 548.9 |
| U.S. Average: | 208.9 |
Violent crime rate in 2008
| Chattanooga: | 581.5 |
| U.S. Average: | 222.5 |
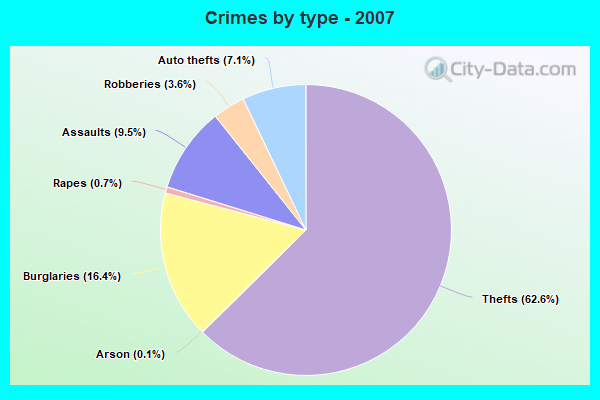
Violent crime rate in 2007
| Chattanooga: | 544.5 |
| U.S. Average: | 229.1 |
Violent crime rate in 2006
| Chattanooga: | 527.2 |
| U.S. Average: | 232.6 |
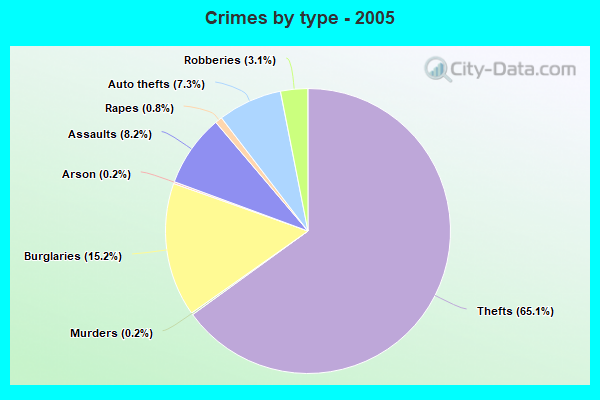
Violent crime rate in 2005
| Chattanooga: | 490.5 |
| U.S. Average: | 227.0 |
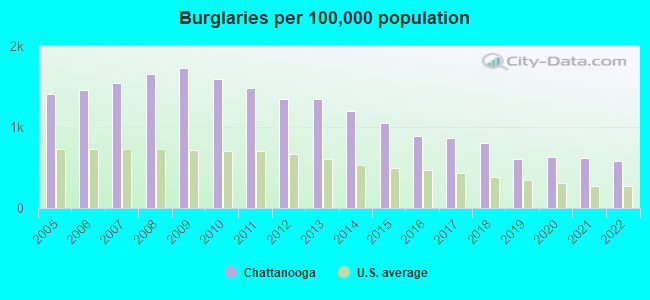
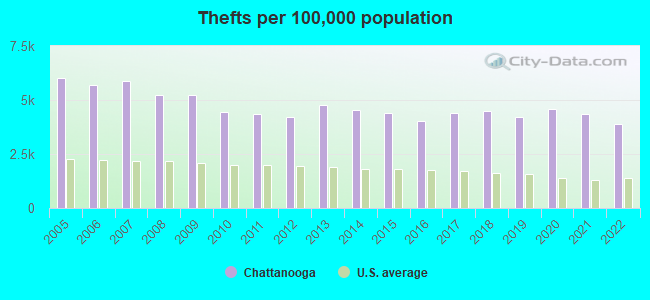
Property crime rate in 2022
| Chattanooga: | 423.1 |
| U.S. Average: | 166.5 |
Property crime rate in 2021
| Chattanooga: | 471.4 |
| U.S. Average: | 157.8 |
Property crime rate in 2020
| Chattanooga: | 527.4 |
| U.S. Average: | 169.6 |
Property crime rate in 2019
| Chattanooga: | 440.8 |
| U.S. Average: | 179.7 |
Property crime rate in 2018
| Chattanooga: | 502.6 |
| U.S. Average: | 190.2 |
Property crime rate in 2017
| Chattanooga: | 503.5 |
| U.S. Average: | 206.4 |
Property crime rate in 2016
| Chattanooga: | 468.1 |
| U.S. Average: | 216.6 |
Property crime rate in 2015
| Chattanooga: | 506.2 |
| U.S. Average: | 221.5 |
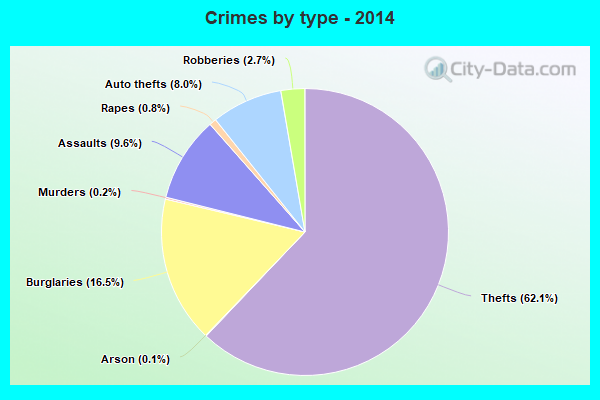
Property crime rate in 2014
| Chattanooga: | 553.5 |
| U.S. Average: | 230.8 |
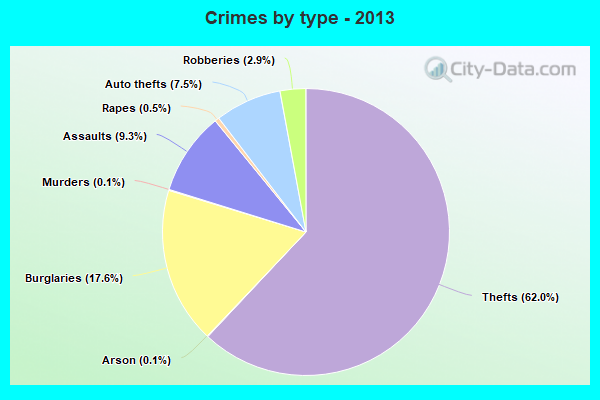
Property crime rate in 2013
| Chattanooga: | 593.6 |
| U.S. Average: | 250.4 |
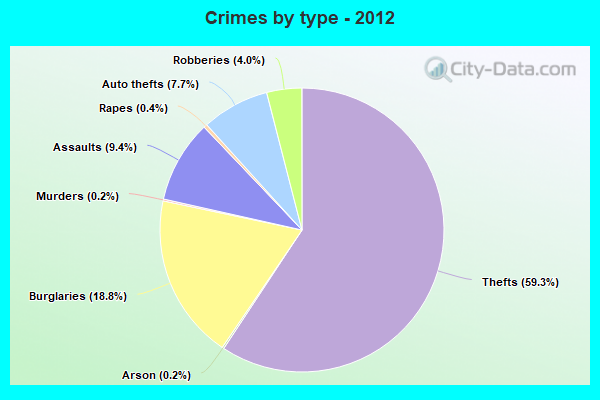
Property crime rate in 2012
| Chattanooga: | 561.2 |
| U.S. Average: | 267.3 |
Property crime rate in 2011
| Chattanooga: | 585.6 |
| U.S. Average: | 273.5 |
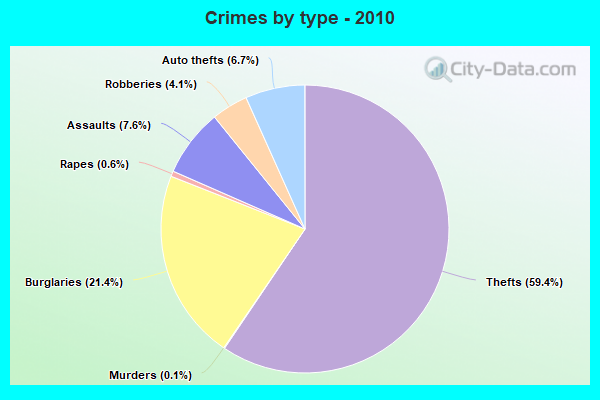
Property crime rate in 2010
| Chattanooga: | 616.9 |
| U.S. Average: | 276.4 |
Property crime rate in 2009
| Chattanooga: | 687.5 |
| U.S. Average: | 285.6 |
Property crime rate in 2008
| Chattanooga: | 689.5 |
| U.S. Average: | 302.2 |
Property crime rate in 2007
| Chattanooga: | 547.0 |
| U.S. Average: | 309.2 |
Property crime rate in 2006
| Chattanooga: | 532.6 |
| U.S. Average: | 317.3 |
Property crime rate in 2005
| Chattanooga: | 533.8 |
| U.S. Average: | 322.3 |
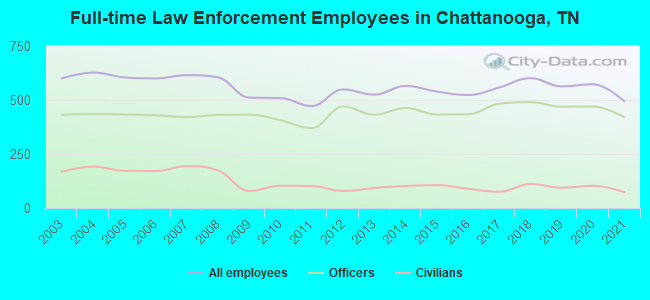
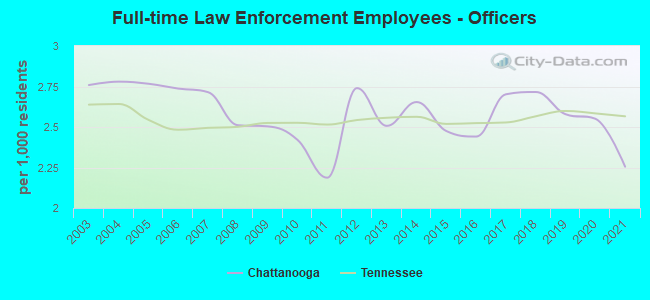
Full-time law enforcement employees in 2021, including police officers: 494 (420 officers - 386 male; 34 female).
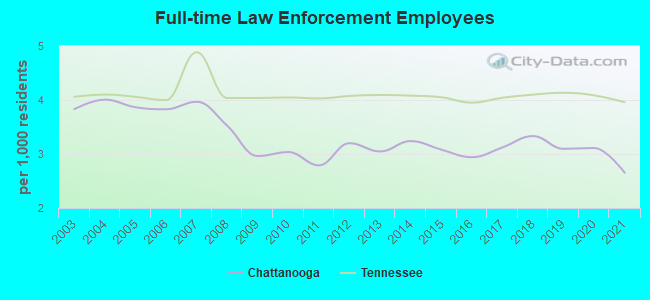
| Officers per 1,000 residents here: | 2.26 |
| Tennessee average: | 2.57 |
Full-time law enforcement employees in 2020, including police officers: 573 (470 officers - 426 male; 44 female).
| Officers per 1,000 residents here: | 2.55 |
| Tennessee average: | 2.58 |
Full-time law enforcement employees in 2019, including police officers: 563 (469 officers - 424 male; 45 female).
| Officers per 1,000 residents here: | 2.58 |
| Tennessee average: | 2.60 |
Full-time law enforcement employees in 2018, including police officers: 601 (490 officers - 446 male; 44 female).
| Officers per 1,000 residents here: | 2.72 |
| Tennessee average: | 2.57 |
Full-time law enforcement employees in 2017, including police officers: 558 (483 officers - 445 male; 38 female).
| Officers per 1,000 residents here: | 2.70 |
| Tennessee average: | 2.53 |
Full-time law enforcement employees in 2016, including police officers: 523 (434 officers - 400 male; 34 female).
| Officers per 1,000 residents here: | 2.44 |
| Tennessee average: | 2.52 |
Full-time law enforcement employees in 2015, including police officers: 539 (433 officers - 399 male; 34 female).
| Officers per 1,000 residents here: | 2.47 |
| Tennessee average: | 2.52 |
Full-time law enforcement employees in 2014, including police officers: 565 (463 officers - 429 male; 34 female).
| Officers per 1,000 residents here: | 2.65 |
| Tennessee average: | 2.56 |
Full-time law enforcement employees in 2013, including police officers: 525 (432 officers - 399 male; 33 female).
| Officers per 1,000 residents here: | 2.51 |
| Tennessee average: | 2.56 |
Full-time law enforcement employees in 2012, including police officers: 549 (470 officers - 435 male; 35 female).
| Officers per 1,000 residents here: | 2.74 |
| Tennessee average: | 2.54 |
Full-time law enforcement employees in 2011, including police officers: 472 (370 officers - 335 male; 35 female).
| Officers per 1,000 residents here: | 2.19 |
| Tennessee average: | 2.52 |
Full-time law enforcement employees in 2010, including police officers: 509 (406 officers - 370 male; 36 female).
| Officers per 1,000 residents here: | 2.42 |
| Tennessee average: | 2.53 |
Full-time law enforcement employees in 2009, including police officers: 511 (432 officers - 394 male; 38 female).
| Officers per 1,000 residents here: | 2.50 |
| Tennessee average: | 2.52 |
Full-time law enforcement employees in 2008, including police officers: 605 (431 officers - 393 male; 38 female).
| Officers per 1,000 residents here: | 2.51 |
| Tennessee average: | 2.50 |
Full-time law enforcement employees in 2007, including police officers: 615 (421 officers - 380 male; 41 female).
| Officers per 1,000 residents here: | 2.72 |
| Tennessee average: | 2.50 |
Full-time law enforcement employees in 2006, including police officers: 600 (429 officers - 389 male; 40 female).
| Officers per 1,000 residents here: | 2.74 |
| Tennessee average: | 2.48 |
Full-time law enforcement employees in 2005, including police officers: 605 (433 officers - 390 male; 43 female).
| Officers per 1,000 residents here: | 2.77 |
| Tennessee average: | 2.54 |
Full-time law enforcement employees in 2004, including police officers: 627 (435 officers - 394 male; 41 female).
| Officers per 1,000 residents here: | 2.78 |
| Tennessee average: | 2.64 |
Full-time law enforcement employees in 2003, including police officers: 600 (432 officers - 391 male; 41 female).
| Officers per 1,000 residents here: | 2.76 |
| Tennessee average: | 2.64 |


Zip codes: 37341, 37343, 37350, 37351, 37377, 37379, 37402, 37403, 37404, 37405, 37406, 37407, 37408, 37409, 37410, 37411, 37412, 37415, 37416, 37419, 37421.