Crime rate in Chesapeake, Ohio (OH): murders, rapes, robberies, assaults, burglaries, thefts, auto thefts, arson, crime map
Crime rate in Chesapeake, OH
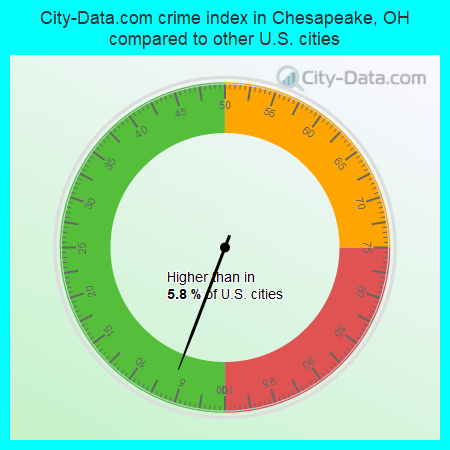
The 2022 crime rate in Chesapeake, OH is 5 (City-Data.com crime index), which is 45.7 times lower than the U.S. average. It was higher than in 5.8% U.S. cities. The 2022 Chesapeake crime rate fell by 97% compared to 2016.See how dangerous Chesapeake, OH is compared to the nearest cities:
(Note: Higher means more crime)
(Note: Higher means more crime)
| Chesapeake: | 5.4 |
| Huntington: | 341.0 |
| Proctorville: | 26.2 |
| Ceredo: | 147.2 |
| South Point: | 1.9 |
| Kenova: | 50.7 |
| Catlettsburg: | 89.3 |
| Barboursville: | 85.4 |
| Ashland: | 211.1 |
Type |
2009 |
2010 |
2011 |
2015 |
2016 |
2022 |
|---|---|---|---|---|---|---|
| Murders (per 100,000) | 0 (0.0) | 0 (0.0) | 0 (0.0) | 0 (0.0) | 0 (0.0) | 0 (0.0) |
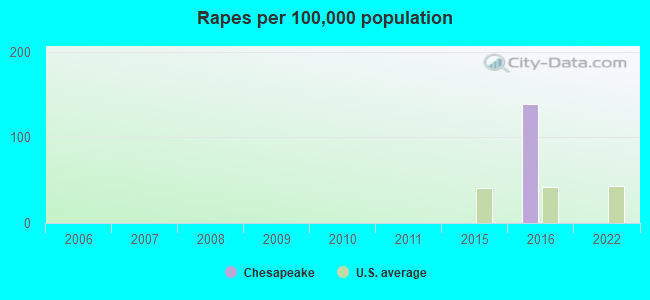
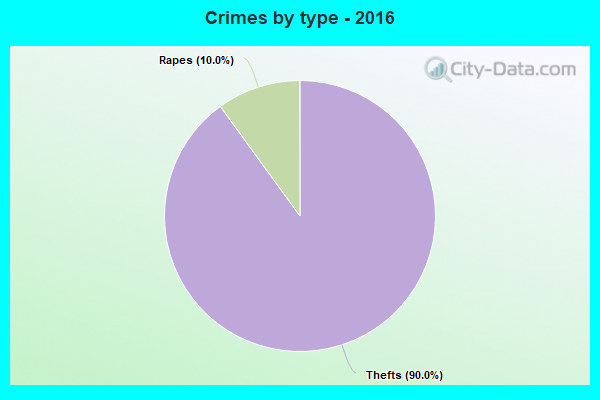
| Rapes (per 100,000) | 0 (0.0) | 0 (0.0) | 0 (0.0) | 0 (0.0) | 1 (138.5) | 0 (0.0) |
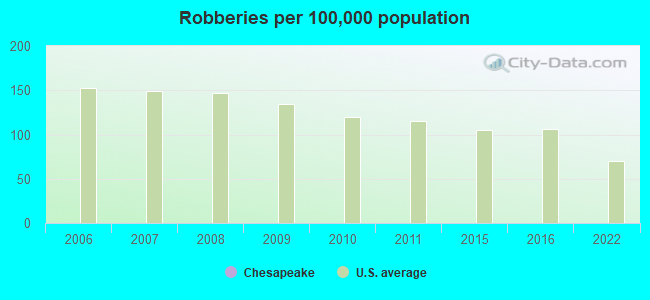
| Robberies (per 100,000) | 0 (0.0) | 0 (0.0) | 0 (0.0) | 0 (0.0) | 0 (0.0) | 0 (0.0) |
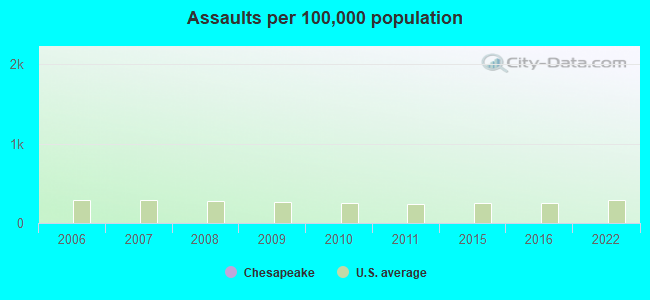
| Assaults (per 100,000) | 0 (0.0) | 0 (0.0) | 0 (0.0) | 0 (0.0) | 0 (0.0) | 0 (0.0) |
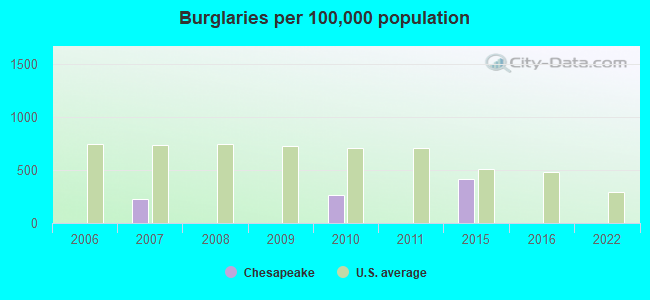
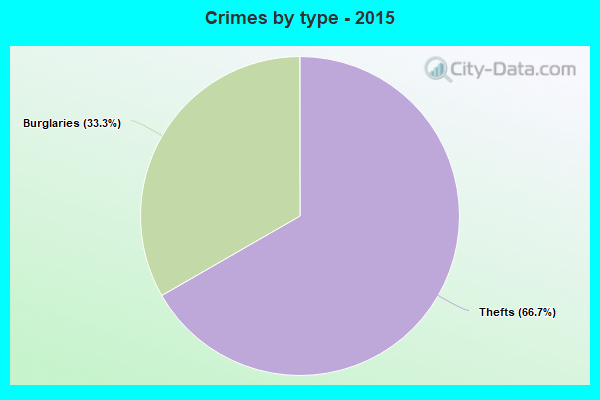
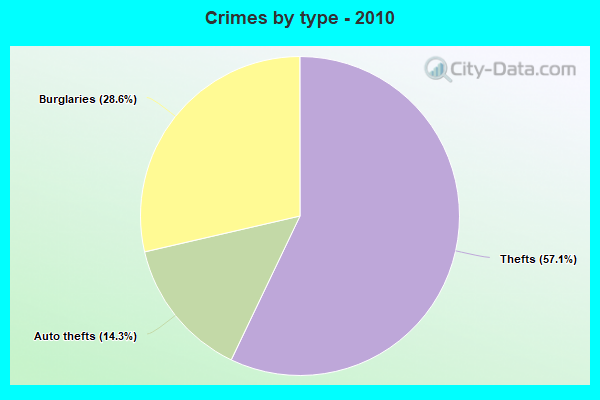
| Burglaries (per 100,000) | 0 (0.0) | 2 (268.5) | 0 (0.0) | 3 (411.0) | 0 (0.0) | 0 (0.0) |
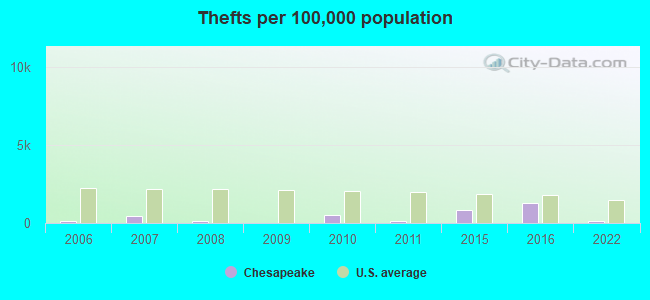
| Thefts (per 100,000) | 0 (0.0) | 4 (536.9) | 1 (134.0) | 6 (821.9) | 9 (1,247) | 1 (134.8) |
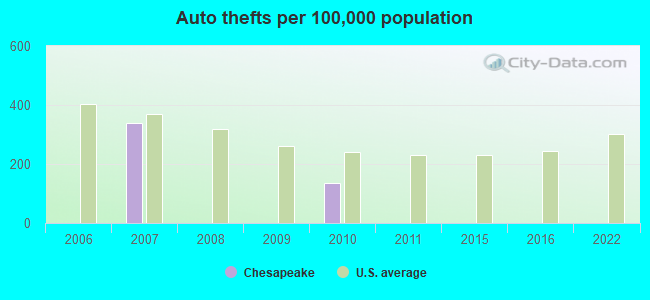
| Auto thefts (per 100,000) | 0 (0.0) | 1 (134.2) | 0 (0.0) | 0 (0.0) | 0 (0.0) | 0 (0.0) |
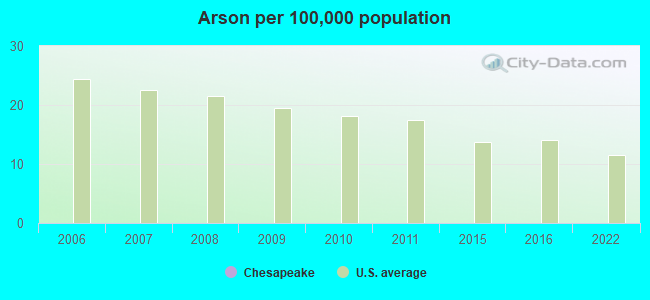
| Arson (per 100,000) | 0 (0.0) | 0 (0.0) | 0 (0.0) | 0 (0.0) | 0 (0.0) | 0 (0.0) |
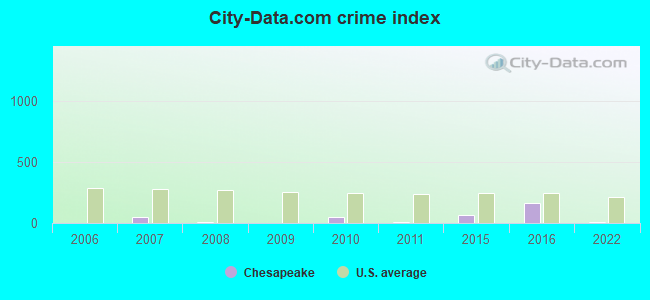
| City-Data.com crime index | 0.0 | 51.0 | 5.4 | 61.6 | 160.7 | 5.4 |
The City-Data.com crime index weighs serious crimes and violent crimes more heavily. Higher means more crime, U.S. average is 246.1. It adjusts for the number of visitors and daily workers commuting into cities.
According to our research of Ohio and other state lists, there were 9 registered sex offenders living in Chesapeake, Ohio as of May 14, 2024.
The ratio of all residents to sex offenders in Chesapeake is 93 to 1.
Violent crime rate in 2022
| Chesapeake: | 0.0 |
| U.S. Average: | 219.8 |
Violent crime rate in 2016
| Chesapeake: | 138.5 |
| U.S. Average: | 227.3 |
Violent crime rate in 2015
| Chesapeake: | 0.0 |
| U.S. Average: | 219.3 |
Violent crime rate in 2011
| Chesapeake: | 0.0 |
| U.S. Average: | 187.1 |
Violent crime rate in 2010
| Chesapeake: | 0.0 |
| U.S. Average: | 195.7 |
Violent crime rate in 2009
| Chesapeake: | 0.0 |
| U.S. Average: | 208.9 |
Violent crime rate in 2008
| Chesapeake: | 0.0 |
| U.S. Average: | 222.5 |
Violent crime rate in 2007
| Chesapeake: | 0.0 |
| U.S. Average: | 229.1 |
Violent crime rate in 2006
| Chesapeake: | 0.0 |
| U.S. Average: | 232.6 |
Property crime rate in 2022
| Chesapeake: | 6.7 |
| U.S. Average: | 166.5 |
Property crime rate in 2016
| Chesapeake: | 62.3 |
| U.S. Average: | 216.6 |
Property crime rate in 2015
| Chesapeake: | 123.3 |
| U.S. Average: | 221.5 |
Property crime rate in 2011
| Chesapeake: | 6.7 |
| U.S. Average: | 273.5 |
Property crime rate in 2010
| Chesapeake: | 100.7 |
| U.S. Average: | 276.4 |
Property crime rate in 2009
| Chesapeake: | 0.0 |
| U.S. Average: | 285.6 |
Property crime rate in 2008
| Chesapeake: | 5.7 |
| U.S. Average: | 302.2 |
Property crime rate in 2007
| Chesapeake: | 88.3 |
| U.S. Average: | 309.2 |
Property crime rate in 2006
| Chesapeake: | 4.2 |
| U.S. Average: | 317.3 |

Zip codes: 45619.