Crime rate in Cody, Wyoming (WY): murders, rapes, robberies, assaults, burglaries, thefts, auto thefts, arson, law enforcement employees, police officers, crime map
Crime rate in Cody, WY
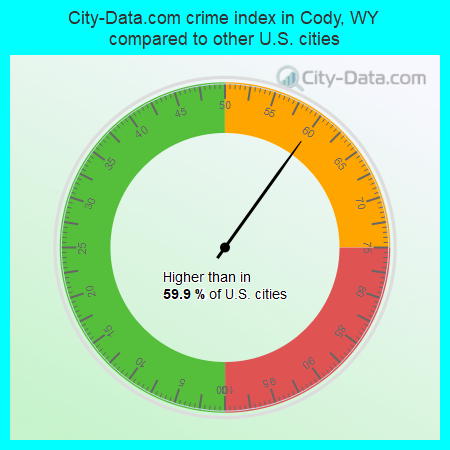
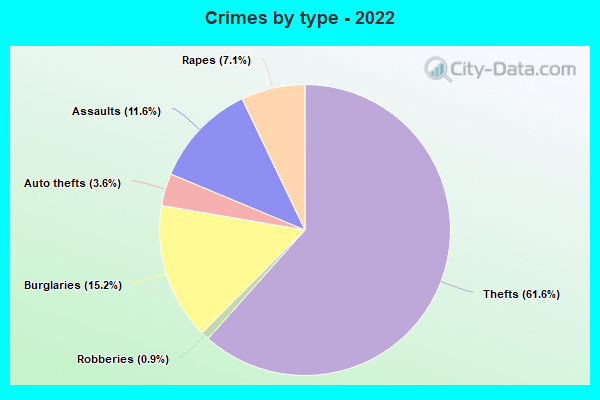
The 2022 crime rate in Cody, WY is 132 (City-Data.com crime index), which is 1.9 times lower than the U.S. average. It was higher than in 59.9% U.S. cities. The 2022 Cody crime rate rose by 0% compared to 2021. In the last 5 years Cody has seen rise of violent crime and decline of property crime.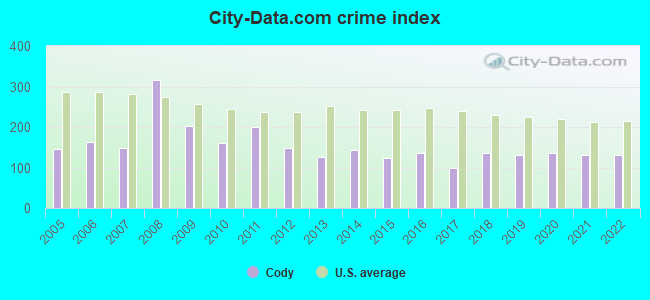
Type |
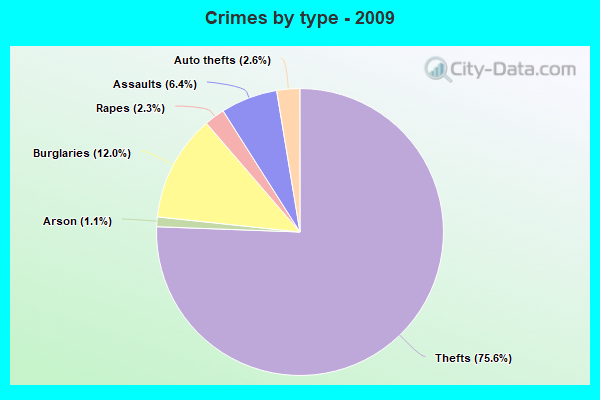
2009 |
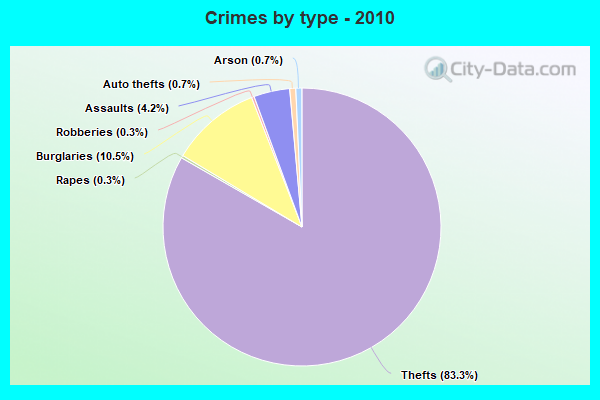
2010 |
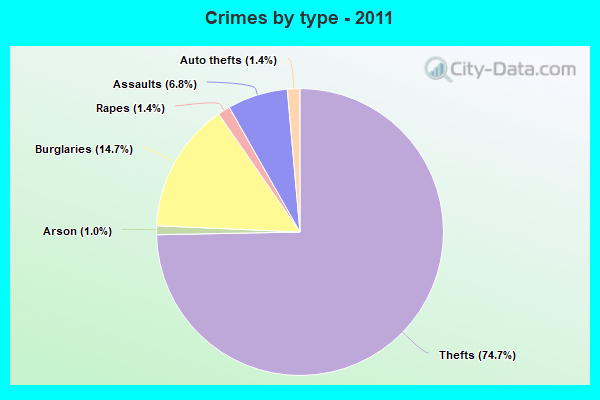
2011 |
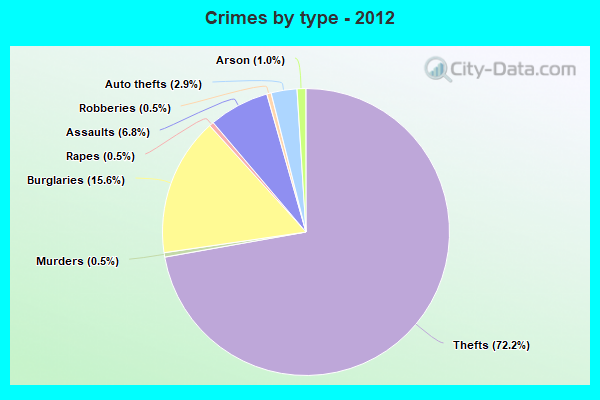
2012 |
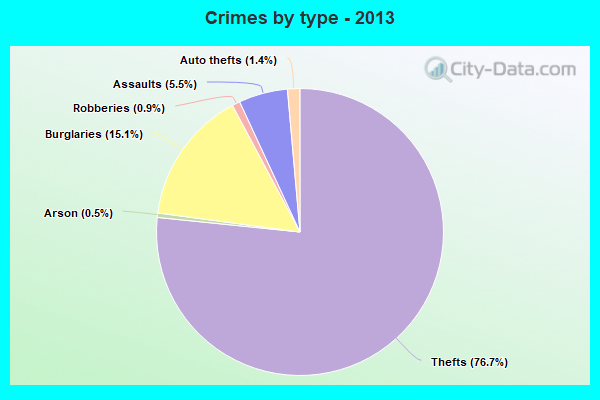
2013 |
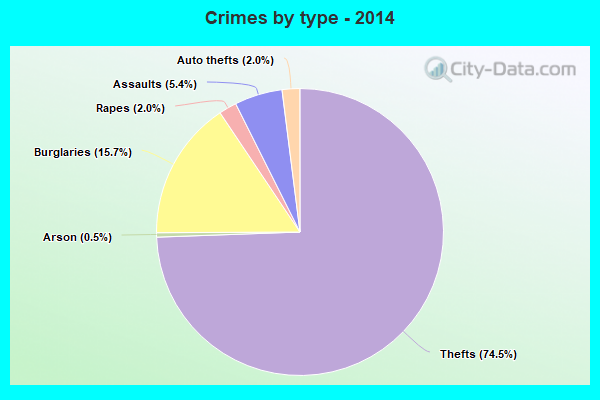
2014 |
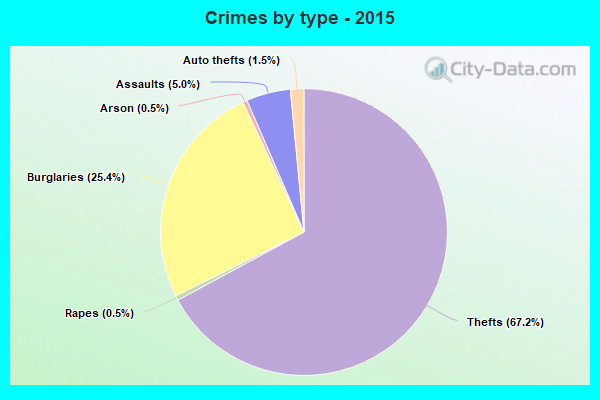
2015 |
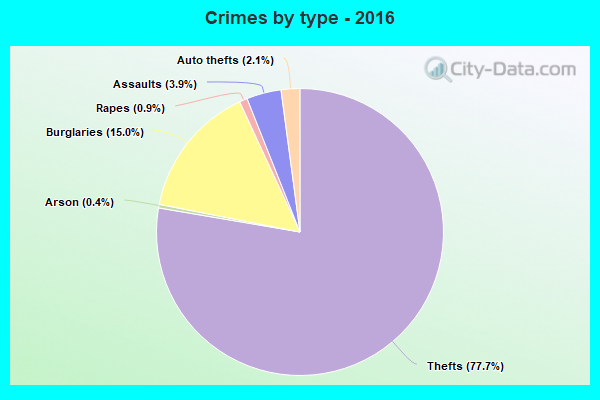
2016 |
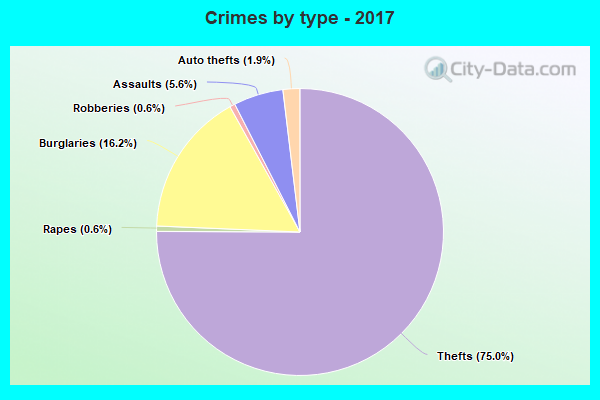
2017 |
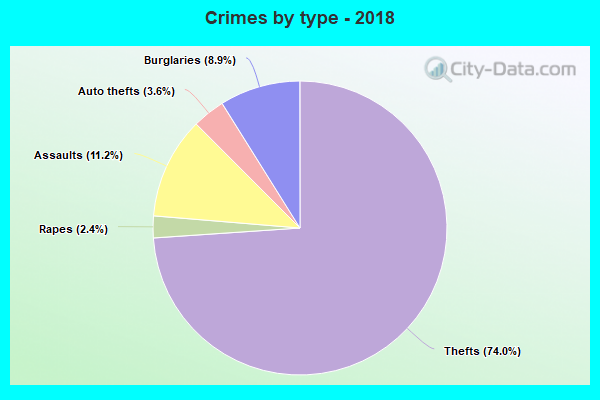
2018 |
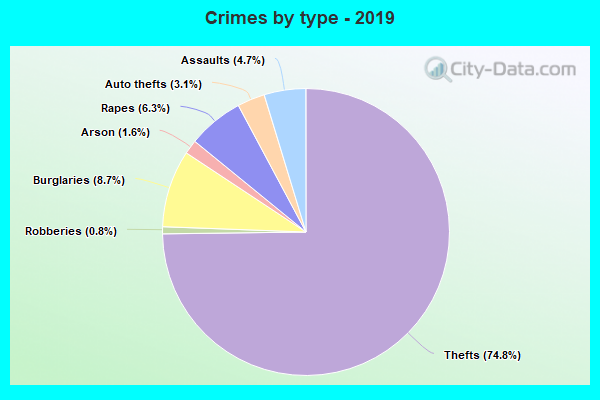
2019 |
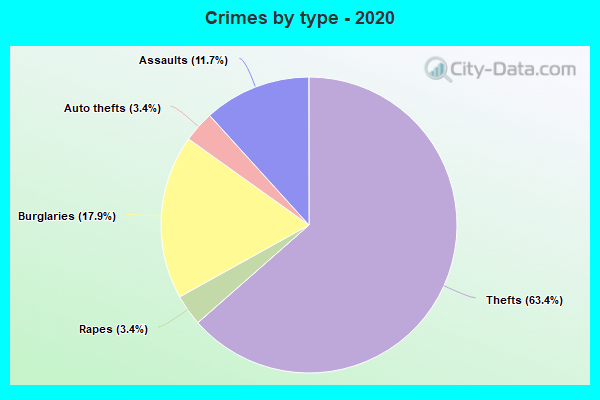
2020 |
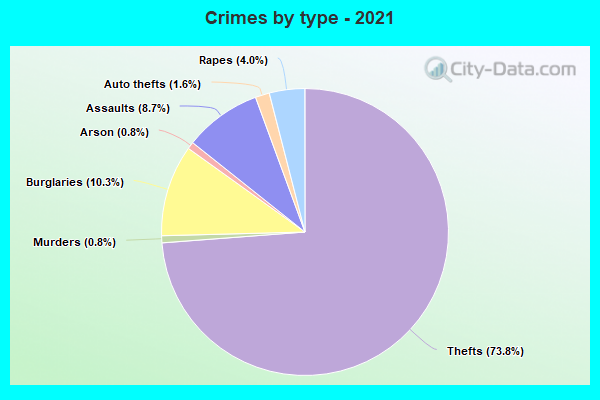
2021 |
2022 |
|---|---|---|---|---|---|---|---|---|---|---|---|---|---|---|
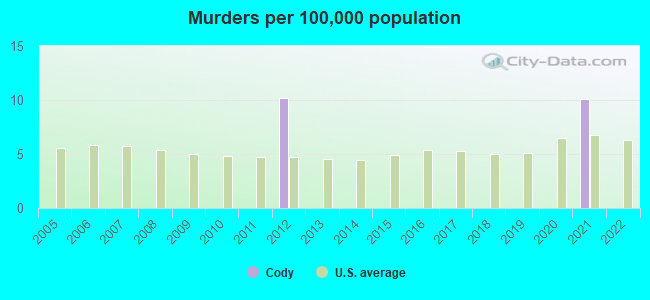
| Murders (per 100,000) | 0 (0.0) | 0 (0.0) | 0 (0.0) | 1 (10.2) | 0 (0.0) | 0 (0.0) | 0 (0.0) | 0 (0.0) | 0 (0.0) | 0 (0.0) | 0 (0.0) | 0 (0.0) | 1 (10.1) | 0 (0.0) |
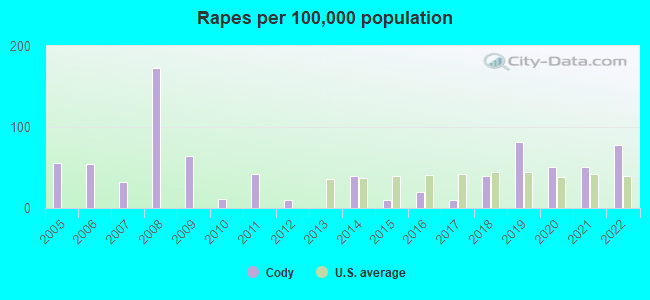
| Rapes (per 100,000) | 6 (64.1) | 1 (10.5) | 4 (41.7) | 1 (10.2) | 0 (0.0) | 4 (40.4) | 1 (10.2) | 2 (20.3) | 1 (10.1) | 4 (40.3) | 8 (81.1) | 5 (50.9) | 5 (50.6) | 8 (77.8) |
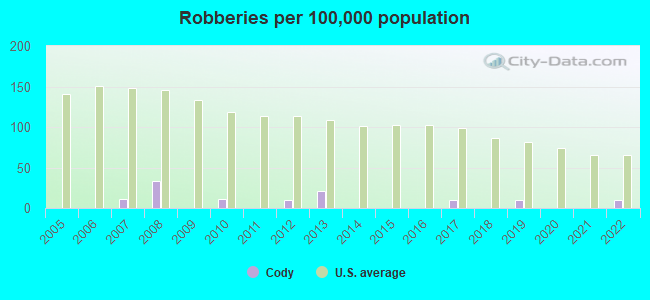
| Robberies (per 100,000) | 0 (0.0) | 1 (10.5) | 0 (0.0) | 1 (10.2) | 2 (20.5) | 0 (0.0) | 0 (0.0) | 0 (0.0) | 1 (10.1) | 0 (0.0) | 1 (10.1) | 0 (0.0) | 0 (0.0) | 1 (9.7) |
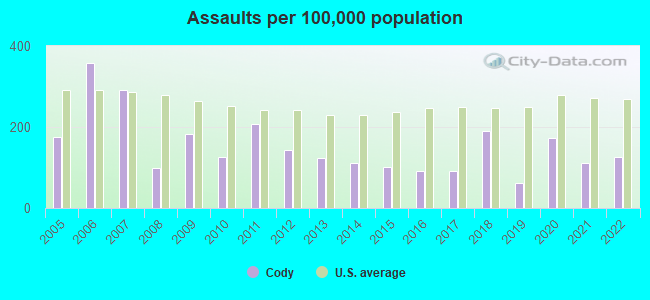
| Assaults (per 100,000) | 17 (181.7) | 12 (126.1) | 20 (208.4) | 14 (143.0) | 12 (123.3) | 11 (111.0) | 10 (102.2) | 9 (91.4) | 9 (91.0) | 19 (191.2) | 6 (60.8) | 17 (173.2) | 11 (111.4) | 13 (126.4) |
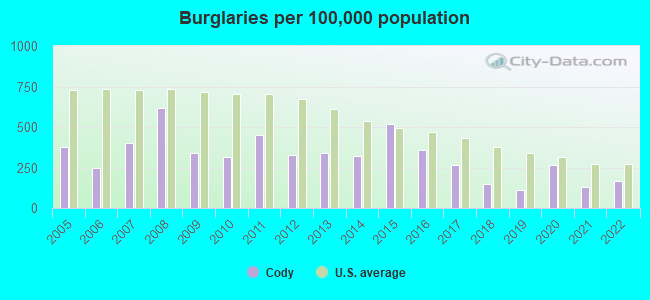
| Burglaries (per 100,000) | 32 (342.0) | 30 (315.1) | 43 (448.1) | 32 (326.8) | 33 (338.9) | 32 (323.0) | 51 (521.0) | 35 (355.6) | 26 (263.0) | 15 (151.0) | 11 (111.5) | 26 (264.9) | 13 (131.6) | 17 (165.4) |
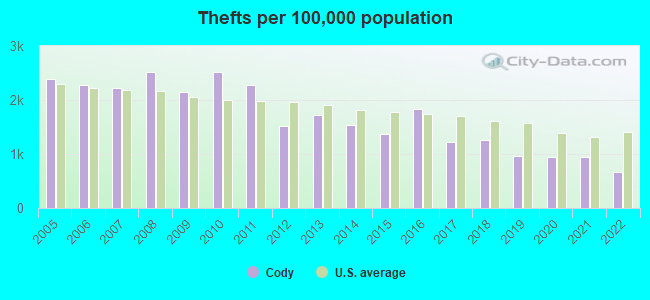
| Thefts (per 100,000) | 201 (2,148) | 239 (2,511) | 219 (2,282) | 148 (1,511) | 168 (1,726) | 152 (1,534) | 135 (1,379) | 181 (1,839) | 120 (1,214) | 125 (1,258) | 95 (963.0) | 92 (937.2) | 93 (941.5) | 69 (671.1) |
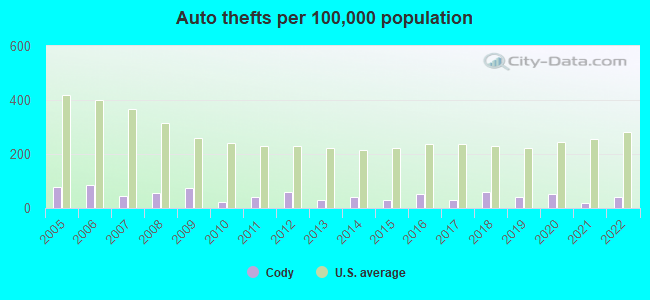
| Auto thefts (per 100,000) | 7 (74.8) | 2 (21.0) | 4 (41.7) | 6 (61.3) | 3 (30.8) | 4 (40.4) | 3 (30.6) | 5 (50.8) | 3 (30.3) | 6 (60.4) | 4 (40.5) | 5 (50.9) | 2 (20.2) | 4 (38.9) |
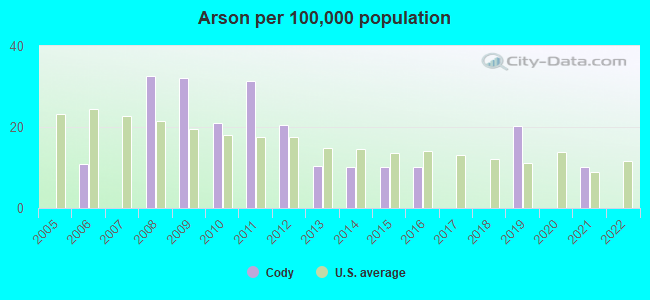
| Arson (per 100,000) | 3 (32.1) | 2 (21.0) | 3 (31.3) | 2 (20.4) | 1 (10.3) | 1 (10.1) | 1 (10.2) | 1 (10.2) | 0 (0.0) | 0 (0.0) | 2 (20.3) | 0 (0.0) | 1 (10.1) | 0 (0.0) |
| City-Data.com crime index | 203.5 | 160.9 | 201.0 | 148.5 | 126.0 | 141.7 | 122.7 | 137.1 | 98.7 | 136.2 | 129.7 | 135.5 | 131.5 | 132.0 |
The City-Data.com crime index weighs serious crimes and violent crimes more heavily. Higher means more crime, U.S. average is 246.1. It adjusts for the number of visitors and daily workers commuting into cities.
According to our research of Wyoming and other state lists, there were 14 registered sex offenders living in Cody, Wyoming as of May 08, 2024.
The ratio of all residents to sex offenders in Cody is 701 to 1.
The ratio of registered sex offenders to all residents in this city is much lower than the state average.
Violent crime rate in 2022
| Cody: | 145.9 |
| U.S. Average: | 219.8 |
Violent crime rate in 2021
| Cody: | 126.5 |
| U.S. Average: | 224.8 |
Violent crime rate in 2020
| Cody: | 137.5 |
| U.S. Average: | 228.2 |
Violent crime rate in 2019
| Cody: | 116.6 |
| U.S. Average: | 219.9 |
Violent crime rate in 2018
| Cody: | 135.9 |
| U.S. Average: | 221.2 |
Violent crime rate in 2017
| Cody: | 60.7 |
| U.S. Average: | 226.2 |
Violent crime rate in 2016
| Cody: | 66.0 |
| U.S. Average: | 227.3 |
Violent crime rate in 2015
| Cody: | 61.3 |
| U.S. Average: | 219.3 |
Violent crime rate in 2014
| Cody: | 95.9 |
| U.S. Average: | 211.1 |
Violent crime rate in 2013
| Cody: | 71.9 |
| U.S. Average: | 214.2 |
Violent crime rate in 2012
| Cody: | 107.2 |
| U.S. Average: | 187.4 |
Violent crime rate in 2011
| Cody: | 145.9 |
| U.S. Average: | 187.1 |
Violent crime rate in 2010
| Cody: | 78.8 |
| U.S. Average: | 195.7 |
Violent crime rate in 2009
| Cody: | 154.9 |
| U.S. Average: | 208.9 |
Violent crime rate in 2008
| Cody: | 238.5 |
| U.S. Average: | 222.5 |
Violent crime rate in 2007
| Cody: | 129.5 |
| U.S. Average: | 229.1 |
Violent crime rate in 2006
| Cody: | 164.9 |
| U.S. Average: | 232.6 |
Violent crime rate in 2005
| Cody: | 100.8 |
| U.S. Average: | 227.0 |
Property crime rate in 2022
| Cody: | 72.5 |
| U.S. Average: | 166.5 |
Property crime rate in 2021
| Cody: | 76.4 |
| U.S. Average: | 157.8 |
Property crime rate in 2020
| Cody: | 107.5 |
| U.S. Average: | 169.6 |
Property crime rate in 2019
| Cody: | 76.5 |
| U.S. Average: | 179.7 |
Property crime rate in 2018
| Cody: | 102.2 |
| U.S. Average: | 190.2 |
Property crime rate in 2017
| Cody: | 117.9 |
| U.S. Average: | 206.4 |
Property crime rate in 2016
| Cody: | 170.7 |
| U.S. Average: | 216.6 |
Property crime rate in 2015
| Cody: | 177.8 |
| U.S. Average: | 221.5 |
Property crime rate in 2014
| Cody: | 147.4 |
| U.S. Average: | 230.8 |
Property crime rate in 2013
| Cody: | 158.7 |
| U.S. Average: | 250.4 |
Property crime rate in 2012
| Cody: | 150.1 |
| U.S. Average: | 267.3 |
Property crime rate in 2011
| Cody: | 210.0 |
| U.S. Average: | 273.5 |
Property crime rate in 2010
| Cody: | 191.7 |
| U.S. Average: | 276.4 |
Property crime rate in 2009
| Cody: | 187.0 |
| U.S. Average: | 285.6 |
Property crime rate in 2008
| Cody: | 258.0 |
| U.S. Average: | 302.2 |
Property crime rate in 2007
| Cody: | 139.4 |
| U.S. Average: | 309.2 |
Property crime rate in 2006
| Cody: | 124.6 |
| U.S. Average: | 317.3 |
Property crime rate in 2005
| Cody: | 145.4 |
| U.S. Average: | 322.3 |
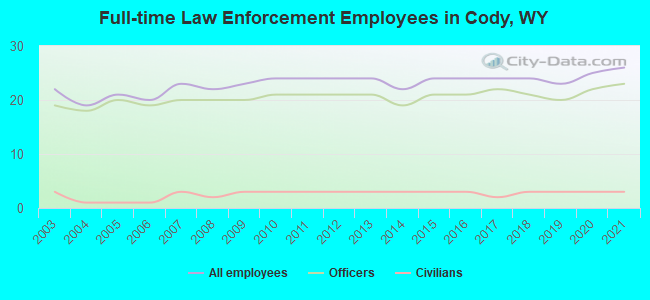
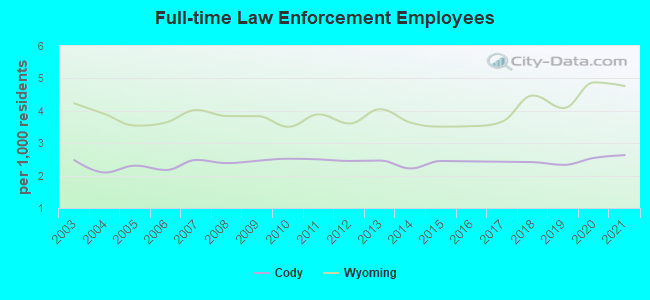
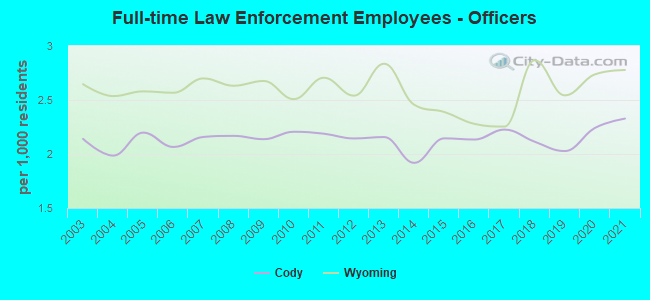
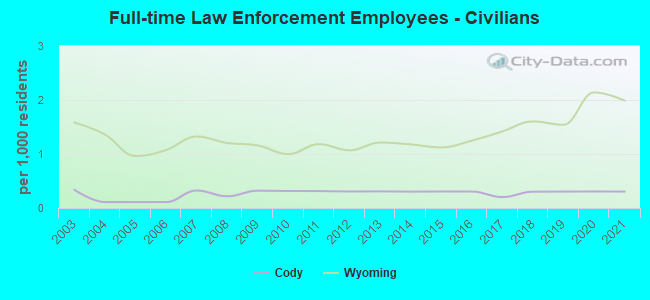
Full-time law enforcement employees in 2021, including police officers: 26 (23 officers - 22 male; 1 female).
| Officers per 1,000 residents here: | 2.33 |
| Wyoming average: | 2.78 |
Full-time law enforcement employees in 2020, including police officers: 25 (22 officers - 21 male; 1 female).
| Officers per 1,000 residents here: | 2.24 |
| Wyoming average: | 2.74 |
Full-time law enforcement employees in 2019, including police officers: 23 (20 officers - 19 male; 1 female).
| Officers per 1,000 residents here: | 2.03 |
| Wyoming average: | 2.54 |
Full-time law enforcement employees in 2018, including police officers: 24 (21 officers - 20 male; 1 female).
| Officers per 1,000 residents here: | 2.11 |
| Wyoming average: | 2.87 |
Full-time law enforcement employees in 2017, including police officers: 24 (22 officers - 20 male; 2 female).
| Officers per 1,000 residents here: | 2.23 |
| Wyoming average: | 2.25 |
Full-time law enforcement employees in 2016, including police officers: 24 (21 officers - 20 male; 1 female).
| Officers per 1,000 residents here: | 2.13 |
| Wyoming average: | 2.28 |
Full-time law enforcement employees in 2015, including police officers: 24 (21 officers - 20 male; 1 female).
| Officers per 1,000 residents here: | 2.15 |
| Wyoming average: | 2.39 |
Full-time law enforcement employees in 2014, including police officers: 22 (19 officers - 18 male; 1 female).
| Officers per 1,000 residents here: | 1.92 |
| Wyoming average: | 2.46 |
Full-time law enforcement employees in 2013, including police officers: 24 (21 officers - 20 male; 1 female).
| Officers per 1,000 residents here: | 2.16 |
| Wyoming average: | 2.84 |
Full-time law enforcement employees in 2012, including police officers: 24 (21 officers - 20 male; 1 female).
| Officers per 1,000 residents here: | 2.14 |
| Wyoming average: | 2.54 |
Full-time law enforcement employees in 2011, including police officers: 24 (21 officers - 19 male; 2 female).
| Officers per 1,000 residents here: | 2.19 |
| Wyoming average: | 2.71 |
Full-time law enforcement employees in 2010, including police officers: 24 (21 officers - 19 male; 2 female).
| Officers per 1,000 residents here: | 2.21 |
| Wyoming average: | 2.51 |
Full-time law enforcement employees in 2009, including police officers: 23 (20 officers - 17 male; 3 female).
| Officers per 1,000 residents here: | 2.14 |
| Wyoming average: | 2.68 |
Full-time law enforcement employees in 2008, including police officers: 22 (20 officers - 17 male; 3 female).
| Officers per 1,000 residents here: | 2.17 |
| Wyoming average: | 2.63 |
Full-time law enforcement employees in 2007, including police officers: 23 (20 officers - 18 male; 2 female).
| Officers per 1,000 residents here: | 2.16 |
| Wyoming average: | 2.70 |
Full-time law enforcement employees in 2006, including police officers: 20 (19 officers - 16 male; 3 female).
| Officers per 1,000 residents here: | 2.06 |
| Wyoming average: | 2.57 |
Full-time law enforcement employees in 2005, including police officers: 21 (20 officers - 15 male; 5 female).
| Officers per 1,000 residents here: | 2.20 |
| Wyoming average: | 2.58 |
Full-time law enforcement employees in 2004, including police officers: 19 (18 officers - 14 male; 4 female).
| Officers per 1,000 residents here: | 1.99 |
| Wyoming average: | 2.54 |
Full-time law enforcement employees in 2003, including police officers: 22 (19 officers - 17 male; 2 female).
| Officers per 1,000 residents here: | 2.14 |
| Wyoming average: | 2.65 |
Zip codes: 82414.