Crime rate in Daytona Beach, Florida (FL): murders, rapes, robberies, assaults, burglaries, thefts, auto thefts, arson, law enforcement employees, police officers, crime map
Crime rate in Daytona Beach, FL
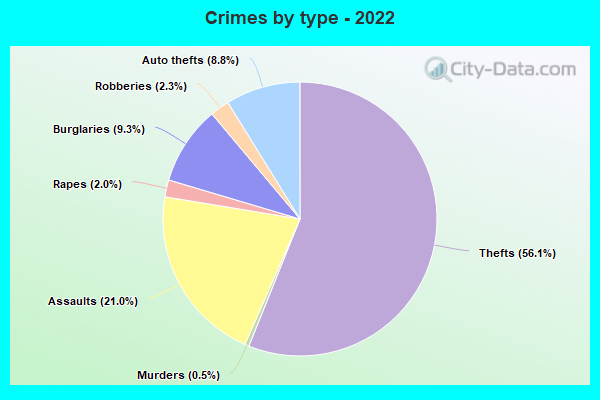
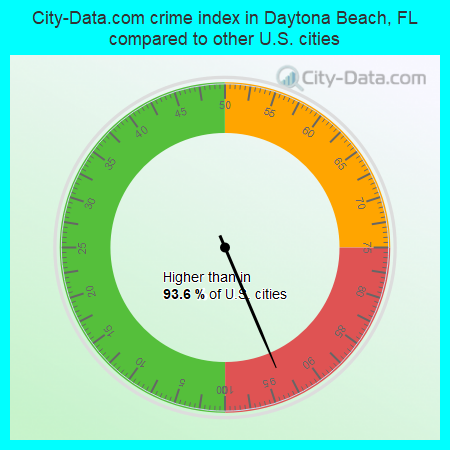
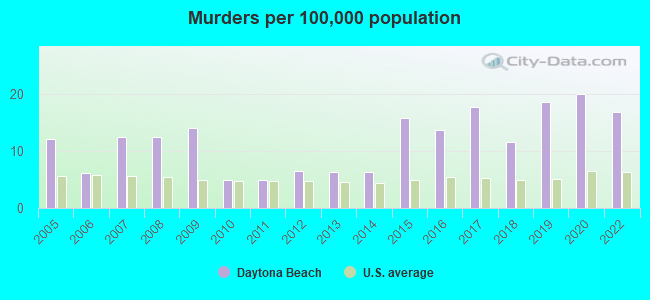
The 2022 crime rate in Daytona Beach, FL is 397 (City-Data.com crime index), which is 1.6 times higher than the U.S. average. It was higher than in 93.6% U.S. cities. The 2022 Daytona Beach crime rate fell by 6% compared to 2020. The number of homicides stood at 13 - a decrease of 1 compared to 2020. In the last 5 years Daytona Beach has seen decline of violent crime and decline of property crime.See how dangerous Daytona Beach, FL is compared to the nearest cities:
(Note: Higher means more crime)
(Note: Higher means more crime)
| Daytona Beach: | 396.9 |
| Holly Hill: | 141.2 |
| South Daytona: | 113.2 |
| Daytona Beach Shores: | 165.5 |
| Ormond Beach: | 143.3 |
| Port Orange: | 85.2 |
| Ponce Inlet: | 101.6 |
| New Smyrna Beach: | 76.2 |
| Edgewater: | 104.9 |
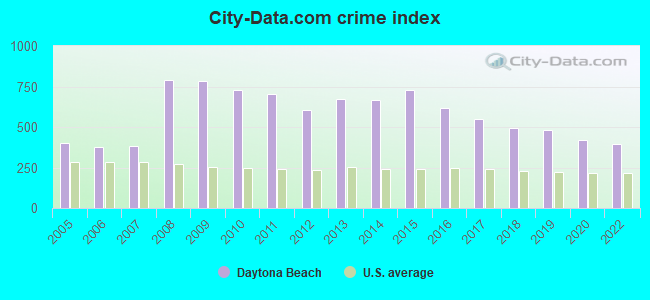
The City-Data.com crime index weighs serious crimes and violent crimes more heavily. Higher means more crime, U.S. average is 246.1. It adjusts for the number of visitors and daily workers commuting into cities.
- means the value is bigger than the state average.- means the value is much bigger than the state average.
According to our research of Florida and other state lists, there were 265 registered sex offenders living in Daytona Beach, Florida as of May 15, 2024.
The ratio of all residents to sex offenders in Daytona Beach is 251 to 1.
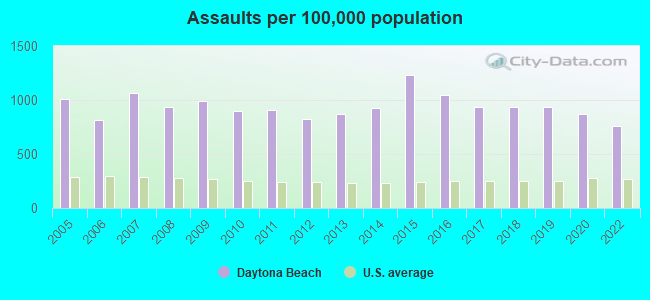
Violent crime rate in 2022
| Daytona Beach: | 525.1 |
| U.S. Average: | 219.8 |
Violent crime rate in 2020
| Daytona Beach: | 565.0 |
| U.S. Average: | 228.2 |
Violent crime rate in 2019
| Daytona Beach: | 609.3 |
| U.S. Average: | 219.9 |
Violent crime rate in 2018
| Daytona Beach: | 583.1 |
| U.S. Average: | 221.2 |
Violent crime rate in 2017
| Daytona Beach: | 597.2 |
| U.S. Average: | 226.2 |
Violent crime rate in 2016
| Daytona Beach: | 661.9 |
| U.S. Average: | 227.3 |
Violent crime rate in 2015
| Daytona Beach: | 842.5 |
| U.S. Average: | 219.3 |
Violent crime rate in 2014
| Daytona Beach: | 706.5 |
| U.S. Average: | 211.1 |
Violent crime rate in 2013
| Daytona Beach: | 695.7 |
| U.S. Average: | 214.2 |
Violent crime rate in 2012
| Daytona Beach: | 606.2 |
| U.S. Average: | 187.4 |
Violent crime rate in 2011
| Daytona Beach: | 712.4 |
| U.S. Average: | 187.1 |
Violent crime rate in 2010
| Daytona Beach: | 697.5 |
| U.S. Average: | 195.7 |
Violent crime rate in 2009
| Daytona Beach: | 809.3 |
| U.S. Average: | 208.9 |
Violent crime rate in 2008
| Daytona Beach: | 824.1 |
| U.S. Average: | 222.5 |
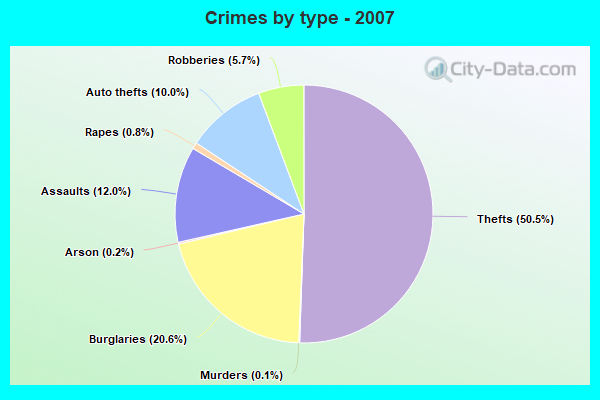
Violent crime rate in 2007
| Daytona Beach: | 410.3 |
| U.S. Average: | 229.1 |
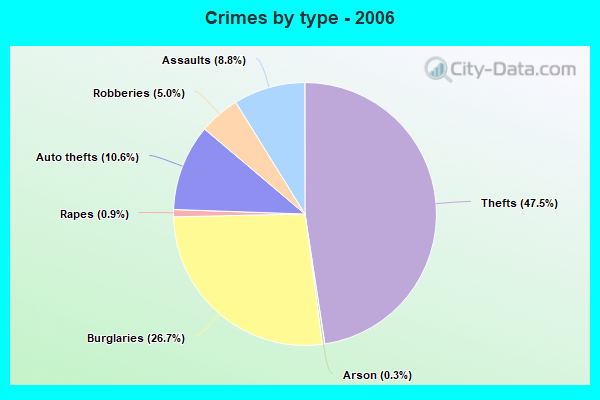
Violent crime rate in 2006
| Daytona Beach: | 341.4 |
| U.S. Average: | 232.6 |
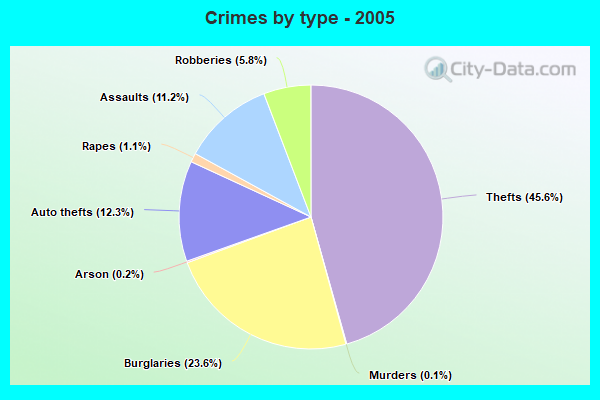
Violent crime rate in 2005
| Daytona Beach: | 411.7 |
| U.S. Average: | 227.0 |
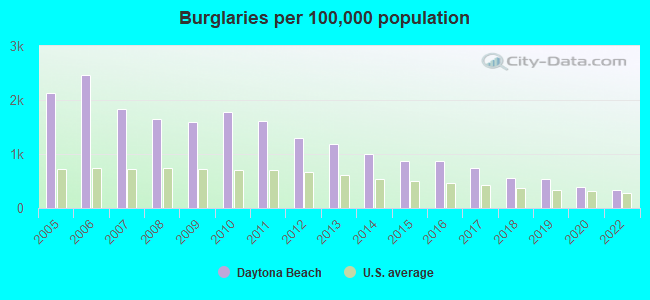
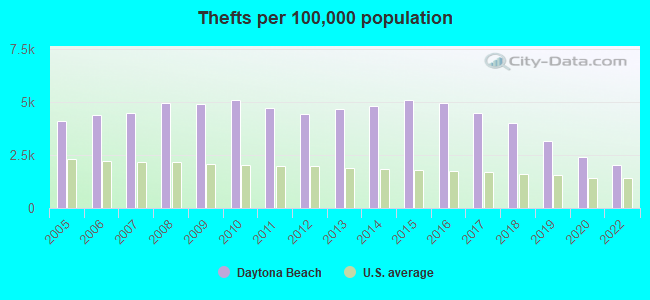
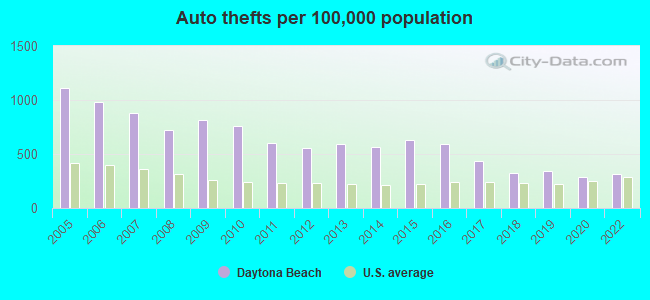
Property crime rate in 2022
| Daytona Beach: | 215.7 |
| U.S. Average: | 166.5 |
Property crime rate in 2020
| Daytona Beach: | 240.6 |
| U.S. Average: | 169.6 |
Property crime rate in 2019
| Daytona Beach: | 318.8 |
| U.S. Average: | 179.7 |
Property crime rate in 2018
| Daytona Beach: | 359.1 |
| U.S. Average: | 190.2 |
Property crime rate in 2017
| Daytona Beach: | 436.6 |
| U.S. Average: | 206.4 |
Property crime rate in 2016
| Daytona Beach: | 511.1 |
| U.S. Average: | 216.6 |
Property crime rate in 2015
| Daytona Beach: | 523.1 |
| U.S. Average: | 221.5 |
Property crime rate in 2014
| Daytona Beach: | 524.2 |
| U.S. Average: | 230.8 |
Property crime rate in 2013
| Daytona Beach: | 560.5 |
| U.S. Average: | 250.4 |
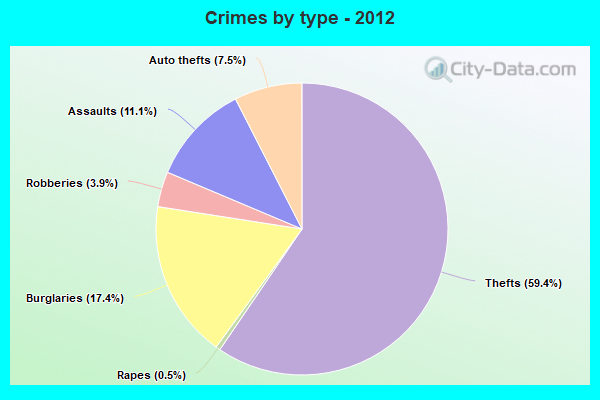
Property crime rate in 2012
| Daytona Beach: | 562.4 |
| U.S. Average: | 267.3 |
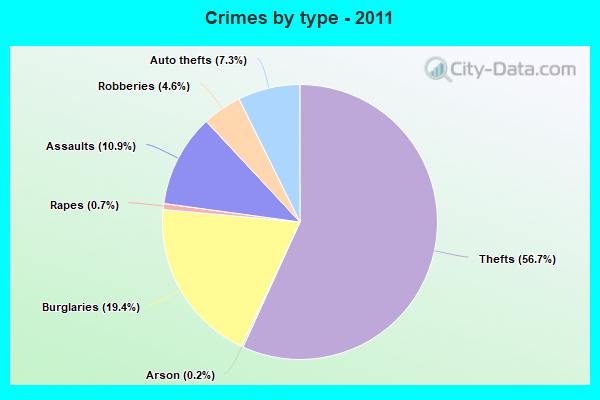
Property crime rate in 2011
| Daytona Beach: | 646.9 |
| U.S. Average: | 273.5 |
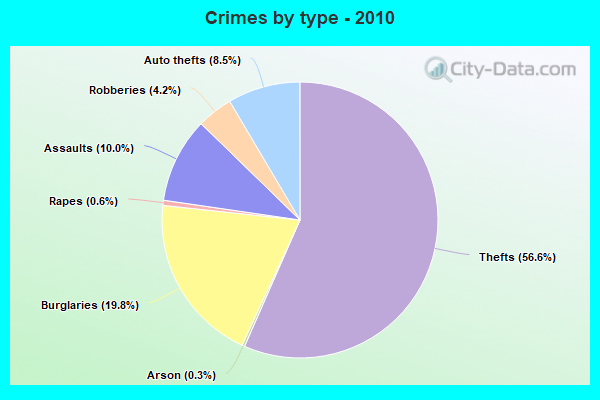
Property crime rate in 2010
| Daytona Beach: | 722.1 |
| U.S. Average: | 276.4 |
Property crime rate in 2009
| Daytona Beach: | 685.5 |
| U.S. Average: | 285.6 |
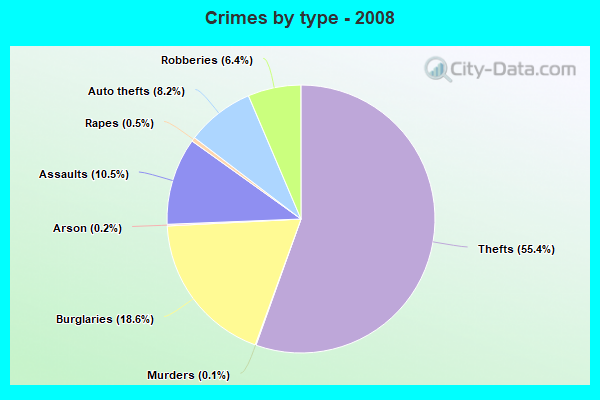
Property crime rate in 2008
| Daytona Beach: | 685.2 |
| U.S. Average: | 302.2 |
Property crime rate in 2007
| Daytona Beach: | 334.8 |
| U.S. Average: | 309.2 |
Property crime rate in 2006
| Daytona Beach: | 399.3 |
| U.S. Average: | 317.3 |
Property crime rate in 2005
| Daytona Beach: | 369.6 |
| U.S. Average: | 322.3 |
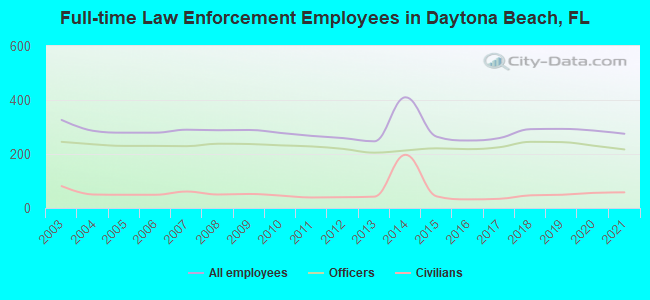
Full-time law enforcement employees in 2021, including police officers: 275 (217 officers - 175 male; 42 female).
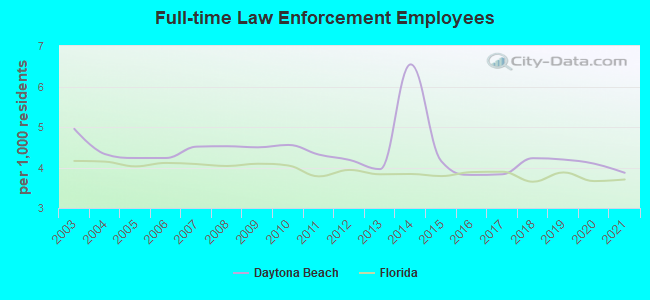
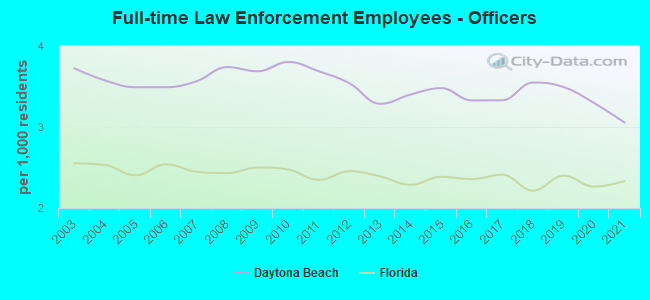
| Officers per 1,000 residents here: | 3.05 |
| Florida average: | 2.33 |
Full-time law enforcement employees in 2020, including police officers: 287 (231 officers - 189 male; 42 female).
| Officers per 1,000 residents here: | 3.30 |
| Florida average: | 2.26 |
Full-time law enforcement employees in 2019, including police officers: 293 (244 officers - 199 male; 45 female).
| Officers per 1,000 residents here: | 3.49 |
| Florida average: | 2.40 |
Full-time law enforcement employees in 2018, including police officers: 292 (245 officers - 203 male; 42 female).
| Officers per 1,000 residents here: | 3.55 |
| Florida average: | 2.21 |
Full-time law enforcement employees in 2017, including police officers: 259 (225 officers - 180 male; 45 female).
| Officers per 1,000 residents here: | 3.33 |
| Florida average: | 2.41 |
Full-time law enforcement employees in 2016, including police officers: 250 (218 officers - 176 male; 42 female).
| Officers per 1,000 residents here: | 3.33 |
| Florida average: | 2.36 |
Full-time law enforcement employees in 2015, including police officers: 264 (221 officers - 176 male; 45 female).
| Officers per 1,000 residents here: | 3.48 |
| Florida average: | 2.39 |
Full-time law enforcement employees in 2014, including police officers: 410 (213 officers - 171 male; 42 female).
| Officers per 1,000 residents here: | 3.40 |
| Florida average: | 2.29 |
Full-time law enforcement employees in 2013, including police officers: 247 (205 officers - 164 male; 41 female).
| Officers per 1,000 residents here: | 3.29 |
| Florida average: | 2.39 |
Full-time law enforcement employees in 2012, including police officers: 259 (219 officers - 174 male; 45 female).
| Officers per 1,000 residents here: | 3.54 |
| Florida average: | 2.45 |
Full-time law enforcement employees in 2011, including police officers: 267 (228 officers - 180 male; 48 female).
| Officers per 1,000 residents here: | 3.69 |
| Florida average: | 2.35 |
Full-time law enforcement employees in 2010, including police officers: 278 (232 officers - 185 male; 47 female).
| Officers per 1,000 residents here: | 3.80 |
| Florida average: | 2.47 |
Full-time law enforcement employees in 2009, including police officers: 289 (237 officers - 186 male; 51 female).
| Officers per 1,000 residents here: | 3.69 |
| Florida average: | 2.50 |
Full-time law enforcement employees in 2008, including police officers: 288 (238 officers - 189 male; 49 female).
| Officers per 1,000 residents here: | 3.74 |
| Florida average: | 2.43 |
Full-time law enforcement employees in 2007, including police officers: 290 (229 officers - 183 male; 46 female).
| Officers per 1,000 residents here: | 3.56 |
| Florida average: | 2.45 |
Full-time law enforcement employees in 2005, including police officers: 279 (230 officers - 191 male; 39 female).
| Officers per 1,000 residents here: | 3.49 |
| Florida average: | 2.40 |
Full-time law enforcement employees in 2004, including police officers: 286 (236 officers - 197 male; 39 female).
| Officers per 1,000 residents here: | 3.57 |
| Florida average: | 2.53 |
Full-time law enforcement employees in 2003, including police officers: 326 (245 officers - 207 male; 38 female).
| Officers per 1,000 residents here: | 3.72 |
| Florida average: | 2.55 |