Crime rate in Fall River, Massachusetts (MA): murders, rapes, robberies, assaults, burglaries, thefts, auto thefts, arson, law enforcement employees, police officers, crime map
Crime rate in Fall River, MA
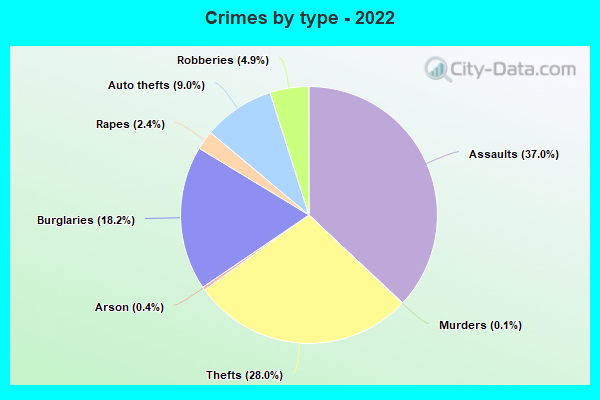
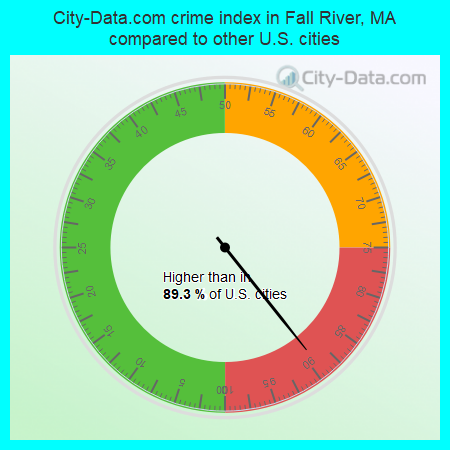
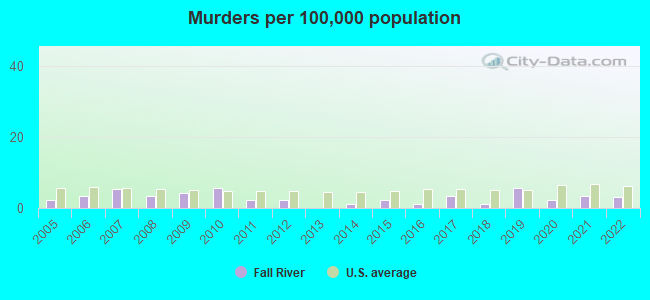
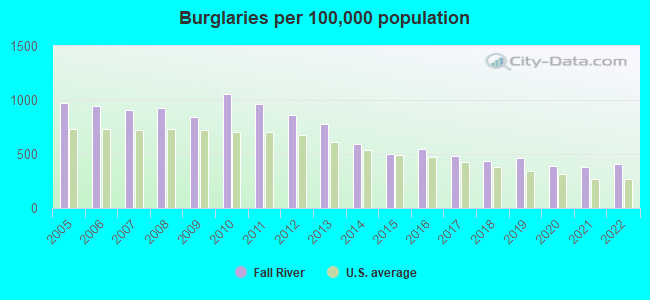
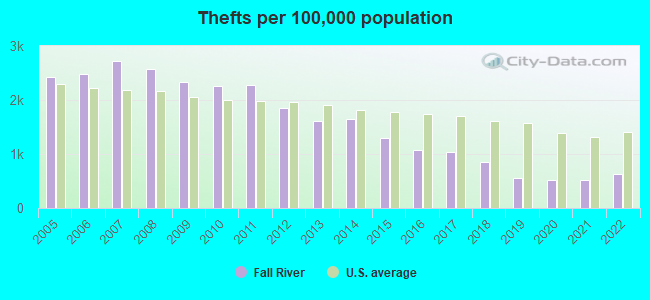
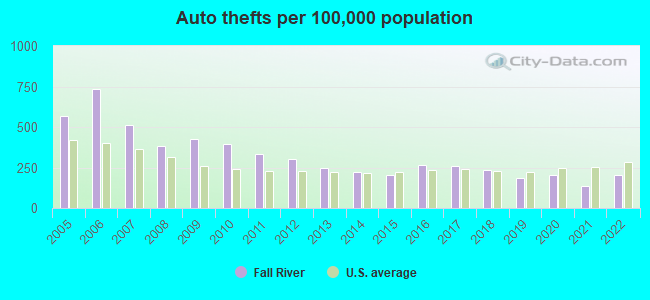
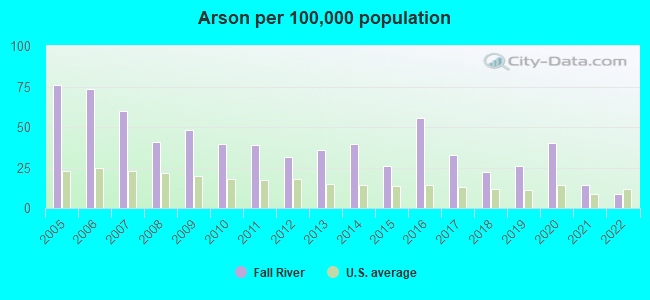
The 2022 crime rate in Fall River, MA is 316 (City-Data.com crime index), which is 1.3 times greater than the U.S. average. It was higher than in 89.3% U.S. cities. The 2022 Fall River crime rate rose by 5% compared to 2021. The number of homicides stood at 3. In the last 5 years Fall River has seen decreasing violent crime and decline of property crime.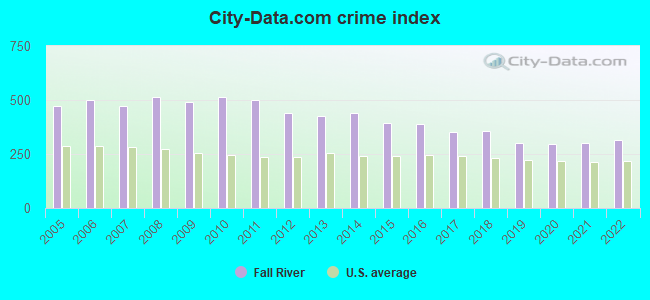
The City-Data.com crime index weighs serious crimes and violent crimes more heavily. Higher means more crime, U.S. average is 246.1. It adjusts for the number of visitors and daily workers commuting into cities.
- means the value is smaller than the state average.- means the value is about the same as the state average.
- means the value is bigger than the state average.
- means the value is much bigger than the state average.
According to our research of Massachusetts and other state lists, there were 126 registered sex offenders living in Fall River, Massachusetts as of May 19, 2024.
The ratio of all residents to sex offenders in Fall River is 706 to 1.
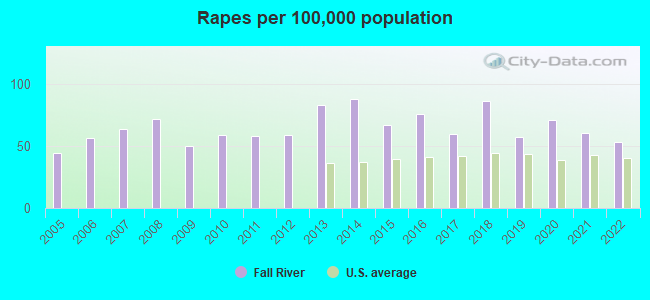
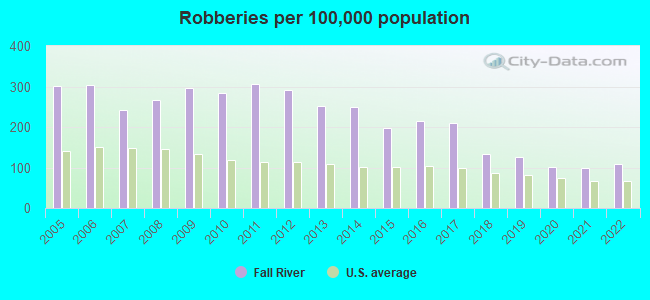
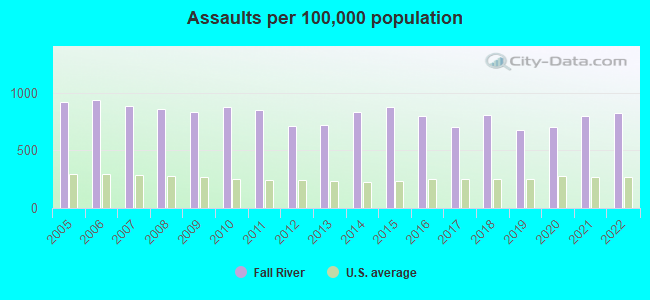
Violent crime rate in 2022
| Fall River: | 526.8 |
| U.S. Average: | 219.8 |
Violent crime rate in 2021
| Fall River: | 514.8 |
| U.S. Average: | 224.8 |
Violent crime rate in 2020
| Fall River: | 476.8 |
| U.S. Average: | 228.2 |
Violent crime rate in 2019
| Fall River: | 471.0 |
| U.S. Average: | 219.9 |
Violent crime rate in 2018
| Fall River: | 559.9 |
| U.S. Average: | 221.2 |
Violent crime rate in 2017
| Fall River: | 521.3 |
| U.S. Average: | 226.2 |
Violent crime rate in 2016
| Fall River: | 586.7 |
| U.S. Average: | 227.3 |
Violent crime rate in 2015
| Fall River: | 606.5 |
| U.S. Average: | 219.3 |
Violent crime rate in 2014
| Fall River: | 629.3 |
| U.S. Average: | 211.1 |
Violent crime rate in 2013
| Fall River: | 571.1 |
| U.S. Average: | 214.2 |
Violent crime rate in 2012
| Fall River: | 564.9 |
| U.S. Average: | 187.4 |
Violent crime rate in 2011
| Fall River: | 641.5 |
| U.S. Average: | 187.1 |
Violent crime rate in 2010
| Fall River: | 649.9 |
| U.S. Average: | 195.7 |
Violent crime rate in 2009
| Fall River: | 623.0 |
| U.S. Average: | 208.9 |
Violent crime rate in 2008
| Fall River: | 640.7 |
| U.S. Average: | 222.5 |
Violent crime rate in 2007
| Fall River: | 573.0 |
| U.S. Average: | 229.1 |
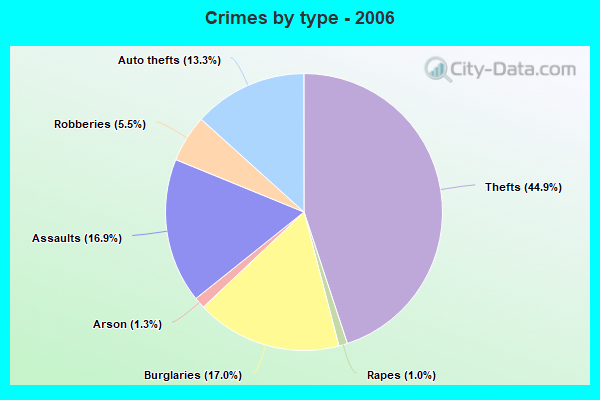
Violent crime rate in 2006
| Fall River: | 615.5 |
| U.S. Average: | 232.6 |
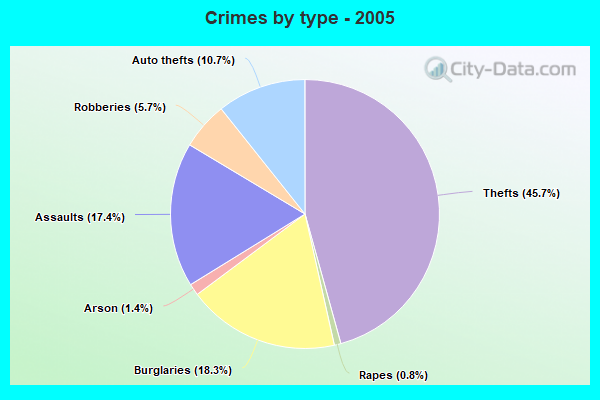
Violent crime rate in 2005
| Fall River: | 595.0 |
| U.S. Average: | 227.0 |
Property crime rate in 2022
| Fall River: | 142.6 |
| U.S. Average: | 166.5 |
Property crime rate in 2021
| Fall River: | 121.7 |
| U.S. Average: | 157.8 |
Property crime rate in 2020
| Fall River: | 134.1 |
| U.S. Average: | 169.6 |
Property crime rate in 2019
| Fall River: | 148.2 |
| U.S. Average: | 179.7 |
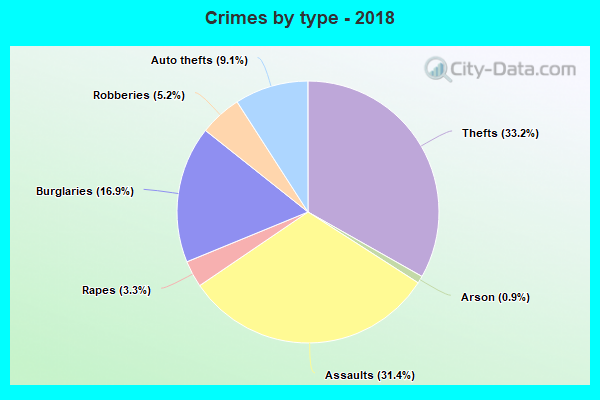
Property crime rate in 2018
| Fall River: | 165.0 |
| U.S. Average: | 190.2 |
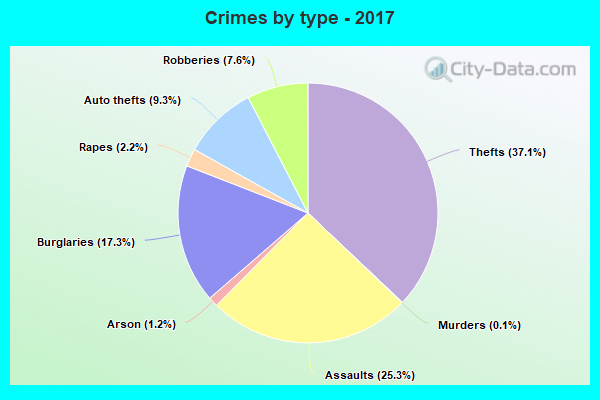
Property crime rate in 2017
| Fall River: | 185.7 |
| U.S. Average: | 206.4 |
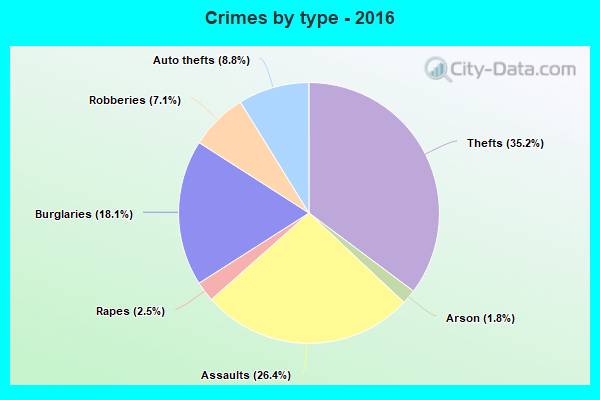
Property crime rate in 2016
| Fall River: | 203.4 |
| U.S. Average: | 216.6 |
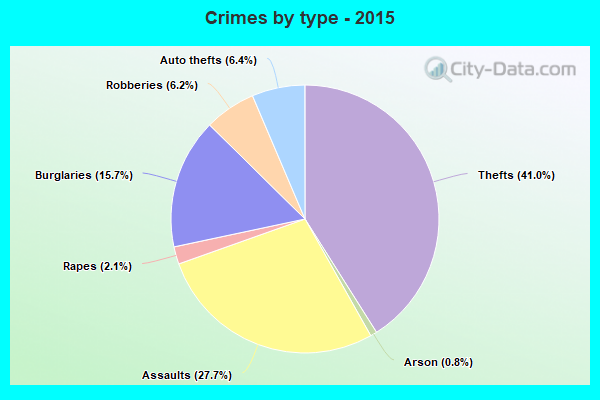
Property crime rate in 2015
| Fall River: | 194.2 |
| U.S. Average: | 221.5 |
Property crime rate in 2014
| Fall River: | 234.7 |
| U.S. Average: | 230.8 |
Property crime rate in 2013
| Fall River: | 274.6 |
| U.S. Average: | 250.4 |
Property crime rate in 2012
| Fall River: | 310.6 |
| U.S. Average: | 267.3 |
Property crime rate in 2011
| Fall River: | 356.2 |
| U.S. Average: | 273.5 |
Property crime rate in 2010
| Fall River: | 384.0 |
| U.S. Average: | 276.4 |
Property crime rate in 2009
| Fall River: | 349.5 |
| U.S. Average: | 285.6 |
Property crime rate in 2008
| Fall River: | 372.0 |
| U.S. Average: | 302.2 |
Property crime rate in 2007
| Fall River: | 355.8 |
| U.S. Average: | 309.2 |
Property crime rate in 2006
| Fall River: | 380.7 |
| U.S. Average: | 317.3 |
Property crime rate in 2005
| Fall River: | 360.2 |
| U.S. Average: | 322.3 |
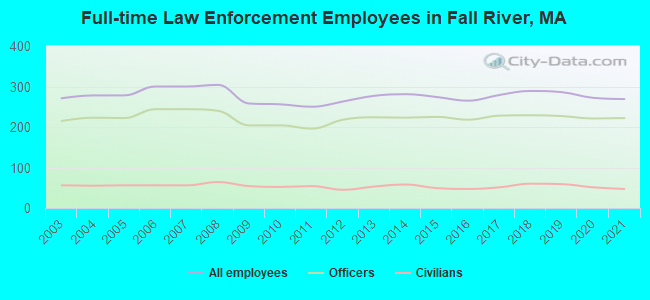
Full-time law enforcement employees in 2021, including police officers: 269 (222 officers - 207 male; 15 female).
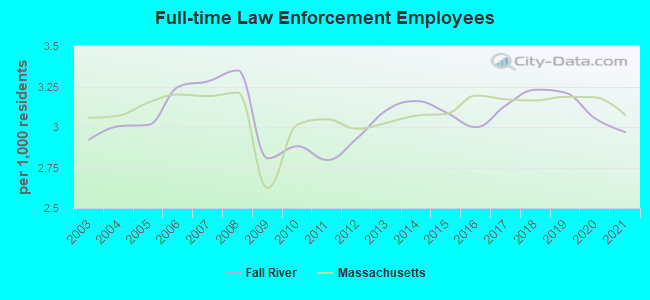
| Officers per 1,000 residents here: | 2.45 |
| Massachusetts average: | 2.53 |
Full-time law enforcement employees in 2020, including police officers: 272 (221 officers - 208 male; 13 female).
| Officers per 1,000 residents here: | 2.48 |
| Massachusetts average: | 2.59 |
Full-time law enforcement employees in 2019, including police officers: 286 (227 officers - 216 male; 11 female).
| Officers per 1,000 residents here: | 2.55 |
| Massachusetts average: | 2.59 |
Full-time law enforcement employees in 2018, including police officers: 289 (229 officers - 217 male; 12 female).
| Officers per 1,000 residents here: | 2.56 |
| Massachusetts average: | 2.60 |
Full-time law enforcement employees in 2017, including police officers: 279 (228 officers - 214 male; 14 female).
| Officers per 1,000 residents here: | 2.56 |
| Massachusetts average: | 2.60 |
Full-time law enforcement employees in 2016, including police officers: 265 (218 officers - 209 male; 9 female).
| Officers per 1,000 residents here: | 2.47 |
| Massachusetts average: | 2.63 |
Full-time law enforcement employees in 2015, including police officers: 274 (225 officers - 215 male; 10 female).
| Officers per 1,000 residents here: | 2.54 |
| Massachusetts average: | 2.54 |
Full-time law enforcement employees in 2014, including police officers: 281 (223 officers - 214 male; 9 female).
| Officers per 1,000 residents here: | 2.51 |
| Massachusetts average: | 2.55 |
Full-time law enforcement employees in 2013, including police officers: 277 (224 officers - 216 male; 8 female).
| Officers per 1,000 residents here: | 2.51 |
| Massachusetts average: | 2.51 |
Full-time law enforcement employees in 2012, including police officers: 263 (218 officers - 209 male; 9 female).
| Officers per 1,000 residents here: | 2.43 |
| Massachusetts average: | 2.49 |
Full-time law enforcement employees in 2011, including police officers: 250 (196 officers - 189 male; 7 female).
| Officers per 1,000 residents here: | 2.19 |
| Massachusetts average: | 2.52 |
Full-time law enforcement employees in 2010, including police officers: 256 (204 officers - 196 male; 8 female).
| Officers per 1,000 residents here: | 2.30 |
| Massachusetts average: | 2.49 |
Full-time law enforcement employees in 2009, including police officers: 258 (204 officers - 195 male; 9 female).
| Officers per 1,000 residents here: | 2.22 |
| Massachusetts average: | 2.18 |
Full-time law enforcement employees in 2008, including police officers: 304 (240 officers - 228 male; 12 female).
| Officers per 1,000 residents here: | 2.64 |
| Massachusetts average: | 2.64 |
Full-time law enforcement employees in 2007, including police officers: 300 (244 officers - 233 male; 11 female).
| Officers per 1,000 residents here: | 2.67 |
| Massachusetts average: | 2.64 |
Full-time law enforcement employees in 2006, including police officers: 300 (244 officers - 233 male; 11 female).
| Officers per 1,000 residents here: | 2.64 |
| Massachusetts average: | 2.67 |
Full-time law enforcement employees in 2005, including police officers: 278 (222 officers - 212 male; 10 female).
| Officers per 1,000 residents here: | 2.41 |
| Massachusetts average: | 2.62 |
Full-time law enforcement employees in 2004, including police officers: 278 (223 officers - 214 male; 9 female).
| Officers per 1,000 residents here: | 2.41 |
| Massachusetts average: | 2.54 |
Full-time law enforcement employees in 2003, including police officers: 271 (215 officers - 206 male; 9 female).
| Officers per 1,000 residents here: | 2.32 |
| Massachusetts average: | 2.56 |