Crime rate in Green, Ohio (OH): murders, rapes, robberies, assaults, burglaries, thefts, auto thefts, arson, crime map
Crime rate in Green, OH
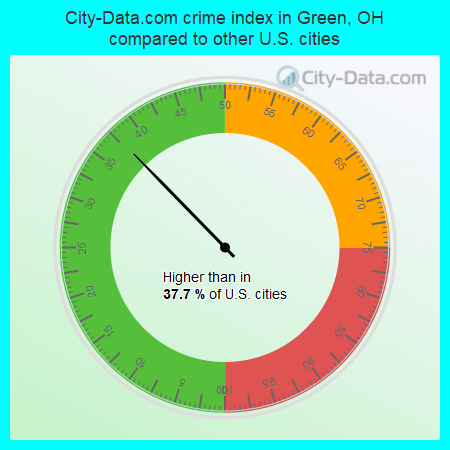
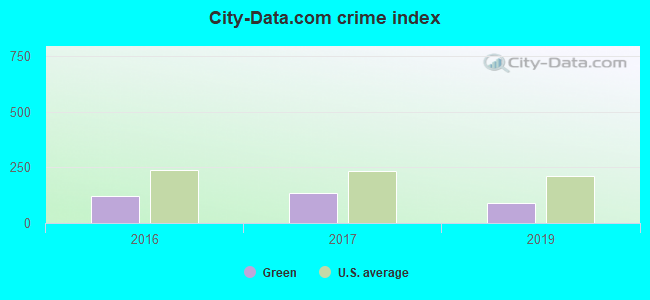
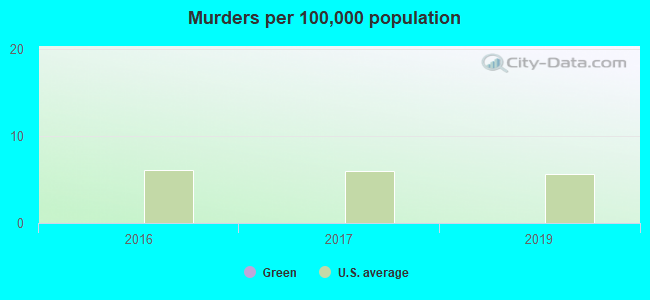
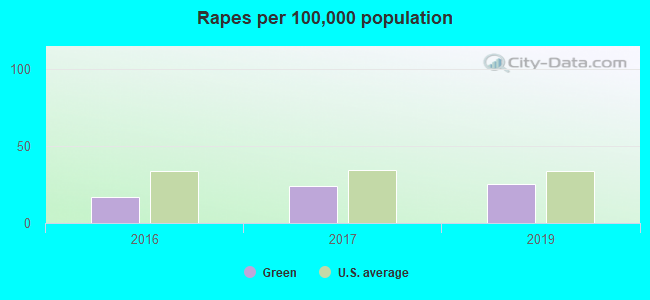
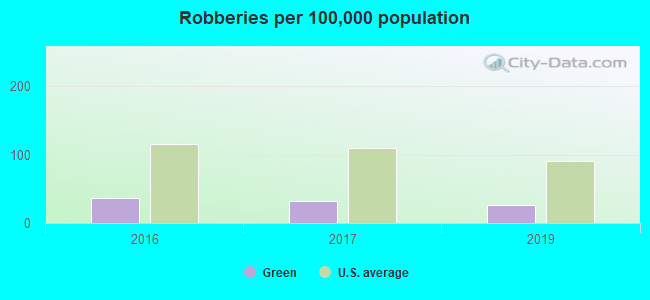
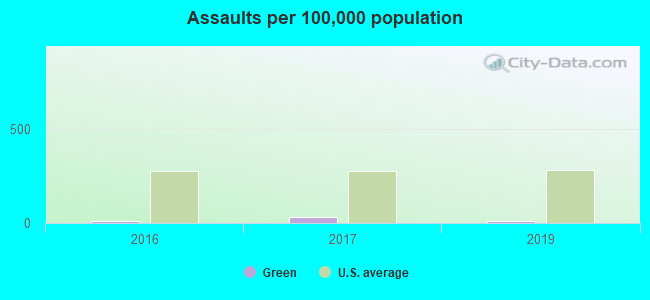
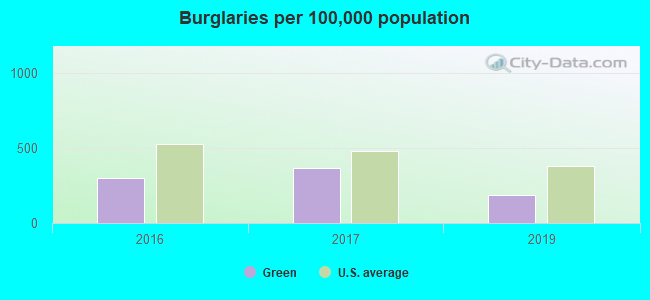
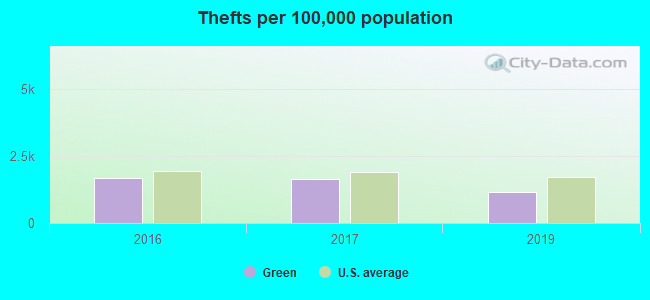
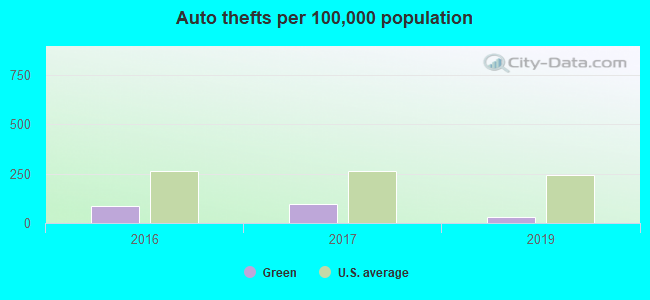
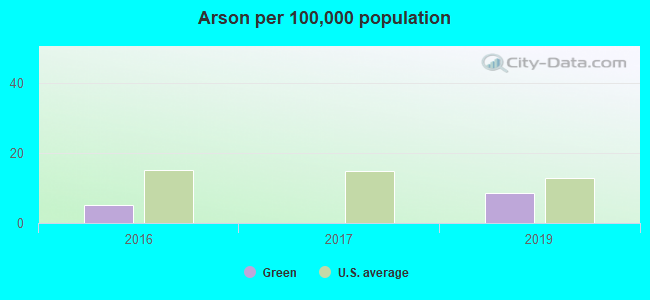
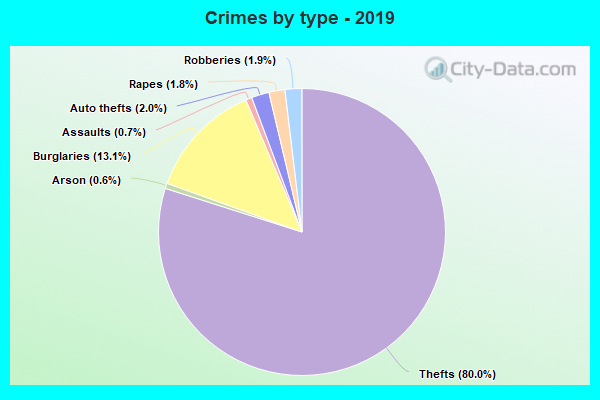
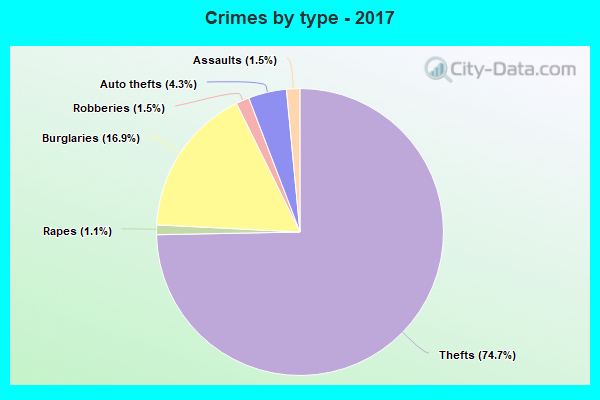
The 2019 crime rate in Green, OH is 92 (City-Data.com crime index), which is 3.0 times smaller than the U.S. average. It was higher than in 37.7% U.S. cities. The 2019 Green crime rate fell by 32% compared to 2017. In the last 5 years Green has seen increasing violent crime and decreasing property crime.See how dangerous Green, OH is compared to the nearest cities:
(Note: Higher means more crime)
(Note: Higher means more crime)
| Green: | 91.7 |
| New Franklin: | 50.8 |
| Uniontown: | 100.8 |
| Lakemore: | 253.1 |
| North Canton: | 95.1 |
| Hartville: | 41.7 |
| Canal Fulton: | 74.5 |
| Barberton: | 229.0 |
| Mogadore: | 50.1 |
The City-Data.com crime index weighs serious crimes and violent crimes more heavily. Higher means more crime, U.S. average is 270.6. It adjusts for the number of visitors and daily workers commuting into cities.
- means the value is smaller than the state average.- means the value is about the same as the state average.
Violent crime rate in 2019
| Green: | 43.9 |
| U.S. Average: | 205.8 |
Violent crime rate in 2017
| Green: | 56.1 |
| U.S. Average: | 215.2 |
Violent crime rate in 2016
| Green: | 41.7 |
| U.S. Average: | 216.3 |
Property crime rate in 2019
| Green: | 99.1 |
| U.S. Average: | 178.6 |
Property crime rate in 2017
| Green: | 170.2 |
| U.S. Average: | 206.4 |
Property crime rate in 2016
| Green: | 156.8 |
| U.S. Average: | 216.6 |
Zip codes: 44685.