Crime rate in Gulfport, Mississippi (MS): murders, rapes, robberies, assaults, burglaries, thefts, auto thefts, arson, law enforcement employees, police officers, crime map

Crime rate in Gulfport, MS
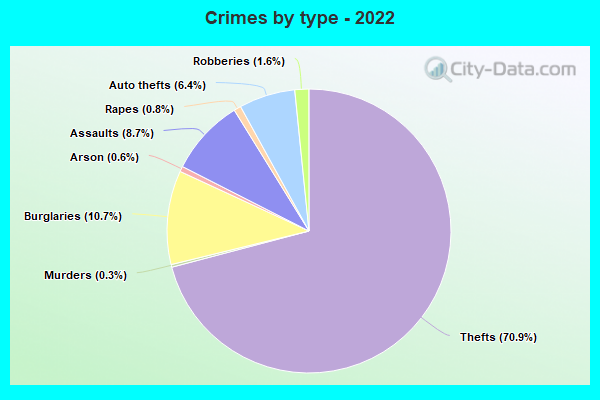
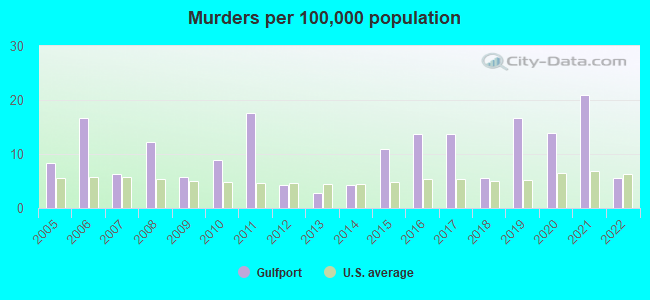
The 2022 crime rate in Gulfport, MS is 166 (City-Data.com crime index), which is 1.5 times smaller than the U.S. average. It was higher than in 68.1% U.S. cities. The 2022 Gulfport crime rate fell by 56% compared to 2021. The number of homicides stood at 4 - a decrease of 11 compared to 2021. In the last 5 years Gulfport has seen decreasing violent crime and decline of property crime.See how dangerous Gulfport, MS is compared to the nearest cities:
(Note: Higher means more crime)
(Note: Higher means more crime)
| Gulfport: | 166.0 |
| Long Beach: | 98.2 |
| Biloxi: | 84.5 |
| D'Iberville: | 233.8 |
| Pass Christian: | 104.8 |
| Ocean Springs: | 144.6 |
| Bay St. Louis: | 254.0 |
| Waveland: | 99.7 |
| Gautier: | 224.3 |
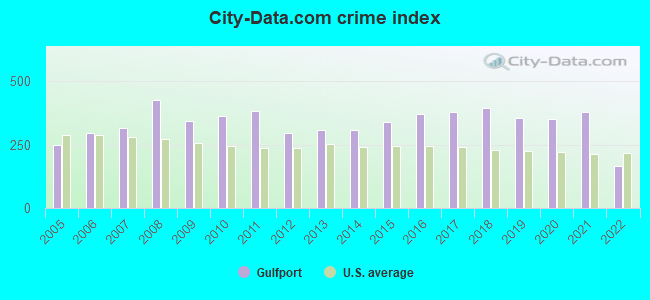
The City-Data.com crime index weighs serious crimes and violent crimes more heavily. Higher means more crime, U.S. average is 246.1. It adjusts for the number of visitors and daily workers commuting into cities.
- means the value is smaller than the state average.- means the value is about the same as the state average.
- means the value is bigger than the state average.
- means the value is much bigger than the state average.
According to our research of Mississippi and other state lists, there were 194 registered sex offenders living in Gulfport, Mississippi as of May 18, 2024.
The ratio of all residents to sex offenders in Gulfport is 376 to 1.
The ratio of registered sex offenders to all residents in this city is near the state average.
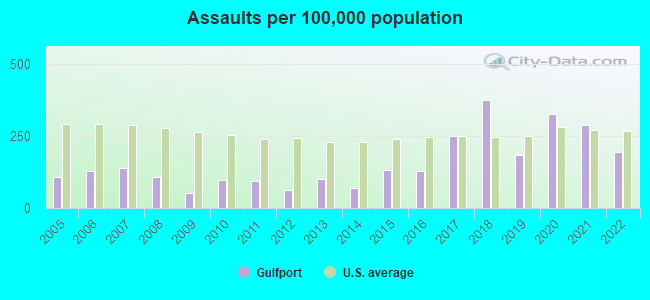
Violent crime rate in 2022
| Gulfport: | 143.6 |
| U.S. Average: | 219.8 |
Violent crime rate in 2021
| Gulfport: | 278.5 |
| U.S. Average: | 224.8 |
Violent crime rate in 2020
| Gulfport: | 265.4 |
| U.S. Average: | 228.2 |
Violent crime rate in 2019
| Gulfport: | 211.4 |
| U.S. Average: | 219.9 |
Violent crime rate in 2018
| Gulfport: | 295.6 |
| U.S. Average: | 221.2 |
Violent crime rate in 2017
| Gulfport: | 245.9 |
| U.S. Average: | 226.2 |
Violent crime rate in 2016
| Gulfport: | 196.1 |
| U.S. Average: | 227.3 |
Violent crime rate in 2015
| Gulfport: | 164.3 |
| U.S. Average: | 219.3 |
Violent crime rate in 2014
| Gulfport: | 121.1 |
| U.S. Average: | 211.1 |
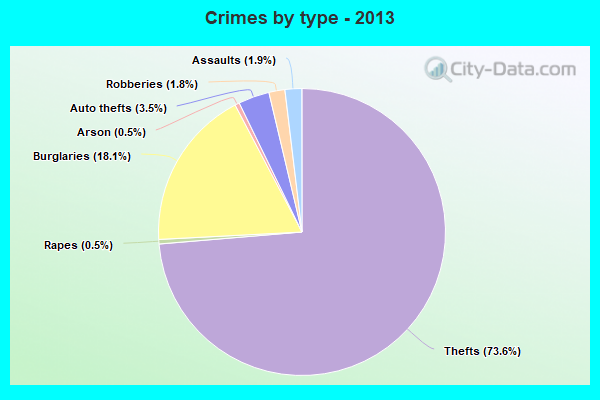
Violent crime rate in 2013
| Gulfport: | 128.4 |
| U.S. Average: | 214.2 |
Violent crime rate in 2012
| Gulfport: | 108.1 |
| U.S. Average: | 187.4 |
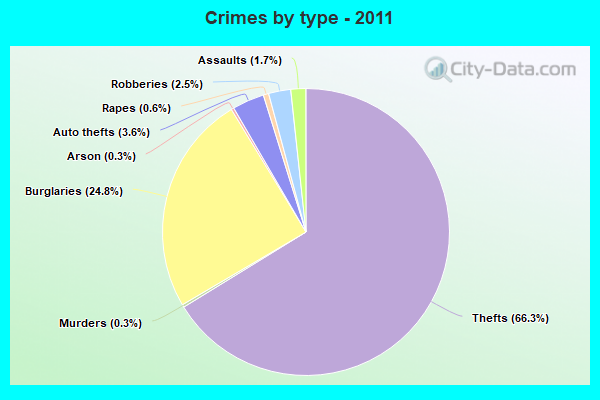
Violent crime rate in 2011
| Gulfport: | 183.7 |
| U.S. Average: | 187.1 |
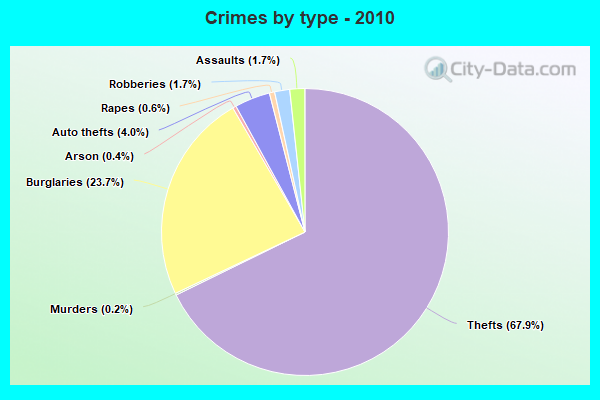
Violent crime rate in 2010
| Gulfport: | 149.0 |
| U.S. Average: | 195.7 |
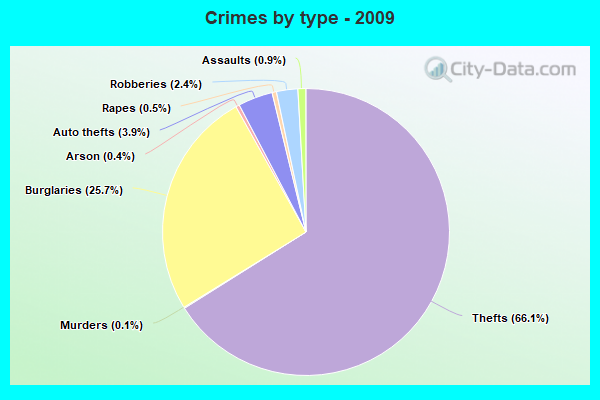
Violent crime rate in 2009
| Gulfport: | 128.0 |
| U.S. Average: | 208.9 |
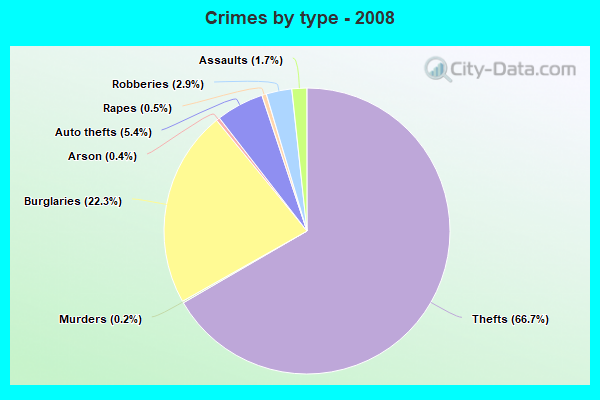
Violent crime rate in 2008
| Gulfport: | 201.7 |
| U.S. Average: | 222.5 |
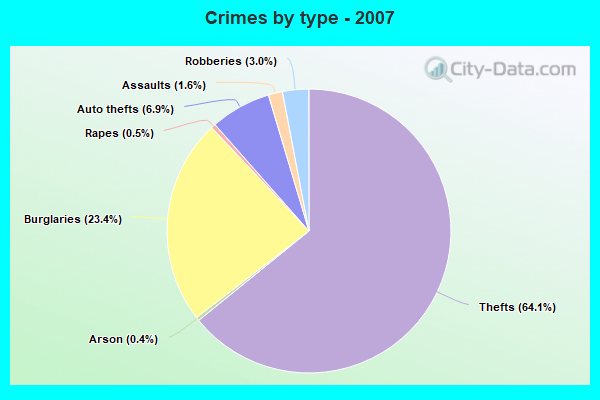
Violent crime rate in 2007
| Gulfport: | 142.6 |
| U.S. Average: | 229.1 |
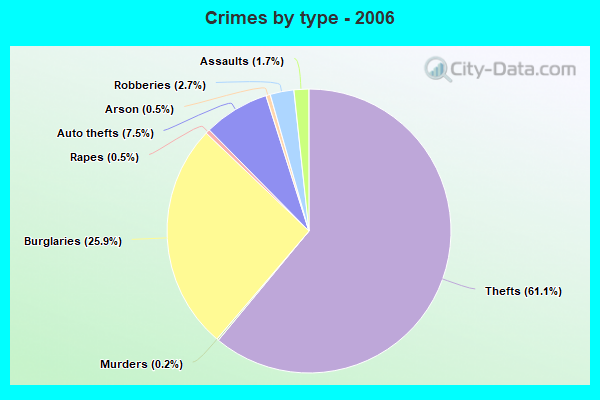
Violent crime rate in 2006
| Gulfport: | 133.6 |
| U.S. Average: | 232.6 |
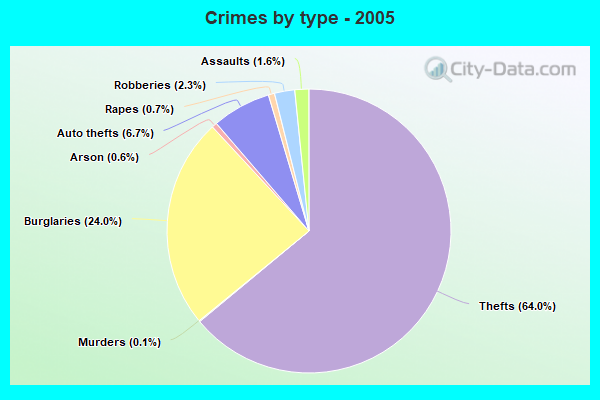
Violent crime rate in 2005
| Gulfport: | 109.1 |
| U.S. Average: | 227.0 |
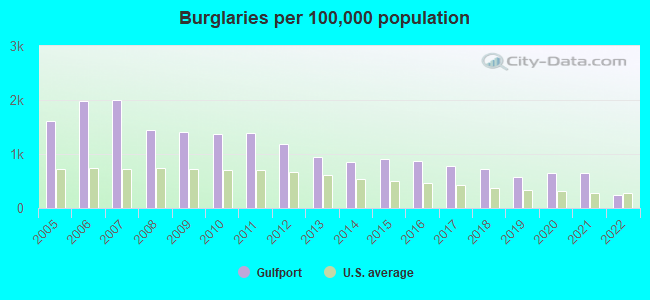
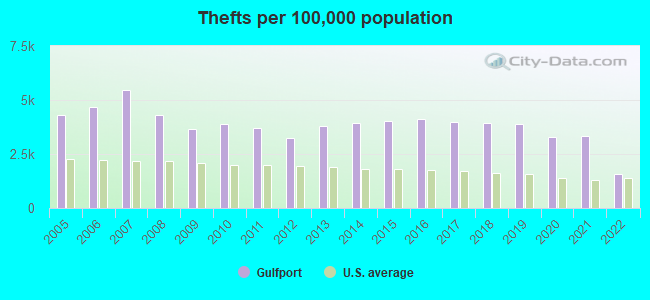
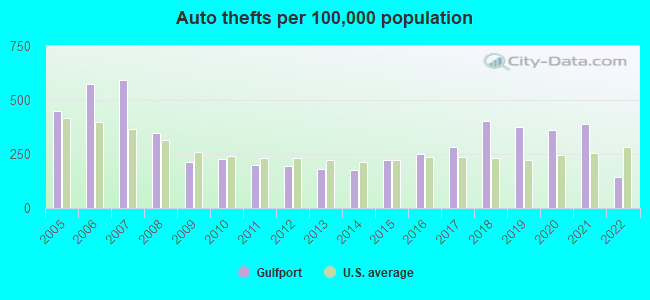
Property crime rate in 2022
| Gulfport: | 147.8 |
| U.S. Average: | 166.5 |
Property crime rate in 2021
| Gulfport: | 353.7 |
| U.S. Average: | 157.8 |
Property crime rate in 2020
| Gulfport: | 346.7 |
| U.S. Average: | 169.6 |
Property crime rate in 2019
| Gulfport: | 365.8 |
| U.S. Average: | 179.7 |
Property crime rate in 2018
| Gulfport: | 403.2 |
| U.S. Average: | 190.2 |
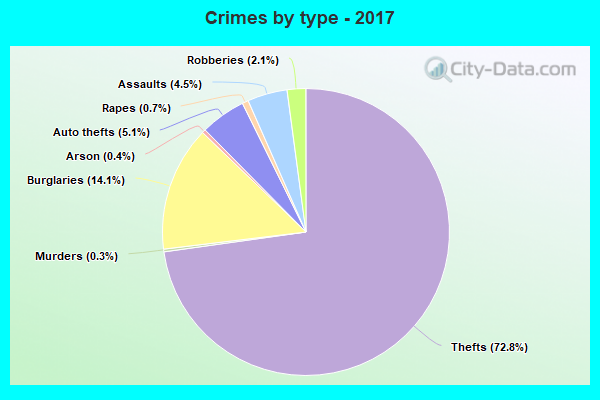
Property crime rate in 2017
| Gulfport: | 396.3 |
| U.S. Average: | 206.4 |
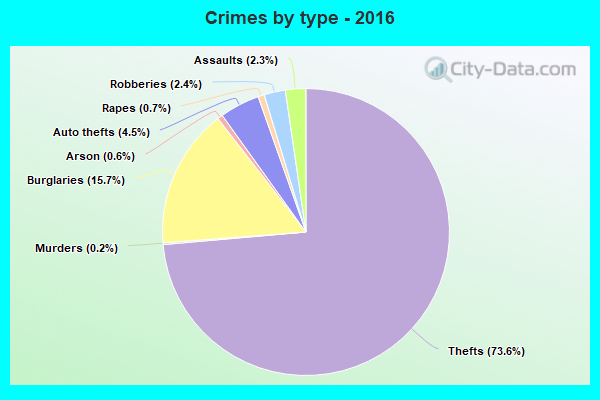
Property crime rate in 2016
| Gulfport: | 420.5 |
| U.S. Average: | 216.6 |
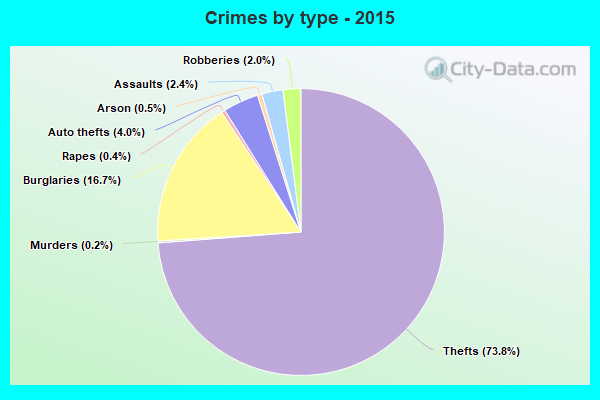
Property crime rate in 2015
| Gulfport: | 416.5 |
| U.S. Average: | 221.5 |
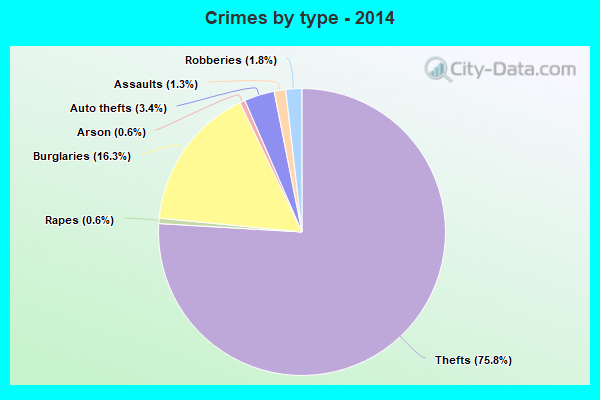
Property crime rate in 2014
| Gulfport: | 392.8 |
| U.S. Average: | 230.8 |
Property crime rate in 2013
| Gulfport: | 404.9 |
| U.S. Average: | 250.4 |
Property crime rate in 2012
| Gulfport: | 426.4 |
| U.S. Average: | 267.3 |
Property crime rate in 2011
| Gulfport: | 494.2 |
| U.S. Average: | 273.5 |
Property crime rate in 2010
| Gulfport: | 502.4 |
| U.S. Average: | 276.4 |
Property crime rate in 2009
| Gulfport: | 497.5 |
| U.S. Average: | 285.6 |
Property crime rate in 2008
| Gulfport: | 554.7 |
| U.S. Average: | 302.2 |
Property crime rate in 2007
| Gulfport: | 431.2 |
| U.S. Average: | 309.2 |
Property crime rate in 2006
| Gulfport: | 404.8 |
| U.S. Average: | 317.3 |
Property crime rate in 2005
| Gulfport: | 341.8 |
| U.S. Average: | 322.3 |
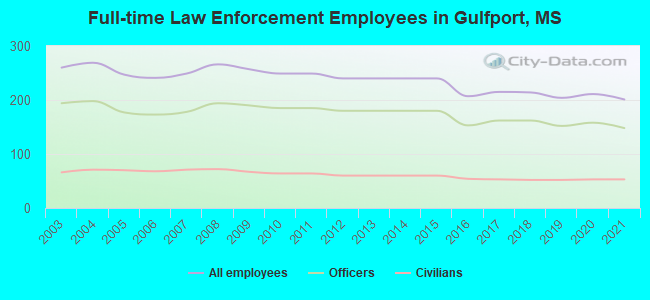
Full-time law enforcement employees in 2021, including police officers: 201 (148 officers - 132 male; 16 female).
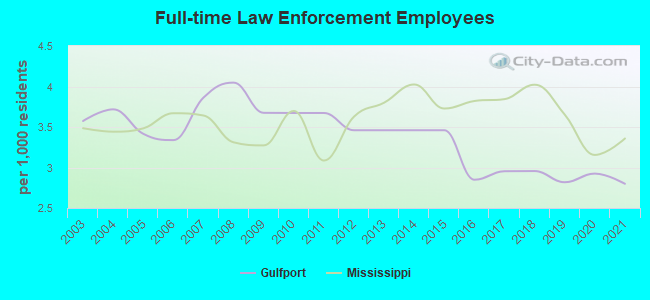
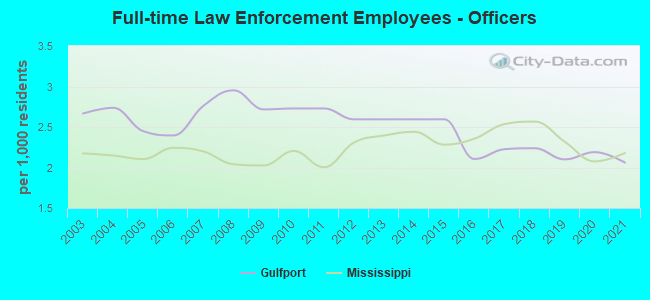
| Officers per 1,000 residents here: | 2.06 |
| Mississippi average: | 2.18 |
Full-time law enforcement employees in 2020, including police officers: 211 (158 officers - 139 male; 19 female).
| Officers per 1,000 residents here: | 2.19 |
| Mississippi average: | 2.08 |
Full-time law enforcement employees in 2019, including police officers: 204 (152 officers - 137 male; 15 female).
| Officers per 1,000 residents here: | 2.10 |
| Mississippi average: | 2.32 |
Full-time law enforcement employees in 2018, including police officers: 214 (162 officers - 150 male; 12 female).
| Officers per 1,000 residents here: | 2.24 |
| Mississippi average: | 2.57 |
Full-time law enforcement employees in 2017, including police officers: 215 (162 officers - 151 male; 11 female).
| Officers per 1,000 residents here: | 2.23 |
| Mississippi average: | 2.54 |
Full-time law enforcement employees in 2016, including police officers: 207 (153 officers - 142 male; 11 female).
| Officers per 1,000 residents here: | 2.11 |
| Mississippi average: | 2.36 |
Full-time law enforcement employees in 2012, including police officers: 240 (180 officers - 168 male; 12 female).
| Officers per 1,000 residents here: | 2.59 |
| Mississippi average: | 2.31 |
Full-time law enforcement employees in 2010, including police officers: 249 (185 officers - 175 male; 10 female).
| Officers per 1,000 residents here: | 2.73 |
| Mississippi average: | 2.20 |
Full-time law enforcement employees in 2009, including police officers: 257 (190 officers - 180 male; 10 female).
| Officers per 1,000 residents here: | 2.72 |
| Mississippi average: | 2.02 |
Full-time law enforcement employees in 2008, including police officers: 266 (194 officers - 182 male; 12 female).
| Officers per 1,000 residents here: | 2.95 |
| Mississippi average: | 2.04 |
Full-time law enforcement employees in 2007, including police officers: 249 (178 officers - 164 male; 14 female).
| Officers per 1,000 residents here: | 2.76 |
| Mississippi average: | 2.20 |
Full-time law enforcement employees in 2006, including police officers: 241 (173 officers - 164 male; 9 female).
| Officers per 1,000 residents here: | 2.40 |
| Mississippi average: | 2.24 |
Full-time law enforcement employees in 2005, including police officers: 247 (177 officers - 167 male; 10 female).
| Officers per 1,000 residents here: | 2.45 |
| Mississippi average: | 2.10 |
Full-time law enforcement employees in 2004, including police officers: 269 (198 officers - 188 male; 10 female).
| Officers per 1,000 residents here: | 2.74 |
| Mississippi average: | 2.15 |
Full-time law enforcement employees in 2003, including police officers: 260 (194 officers - 184 male; 10 female).
| Officers per 1,000 residents here: | 2.67 |
| Mississippi average: | 2.18 |