Crime rate in Hampton, Virginia (VA): murders, rapes, robberies, assaults, burglaries, thefts, auto thefts, arson, law enforcement employees, police officers, crime map
Crime rate in Hampton, VA
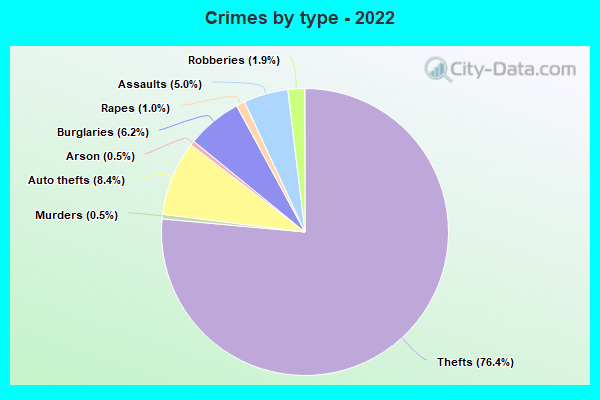
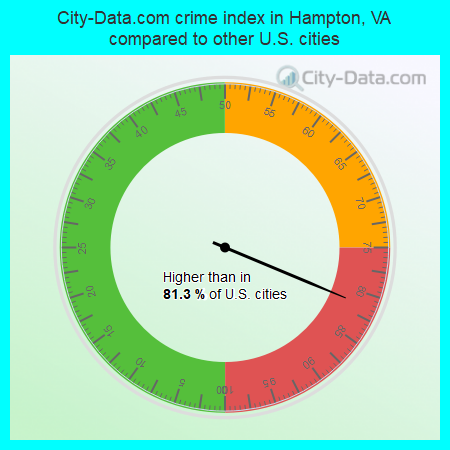
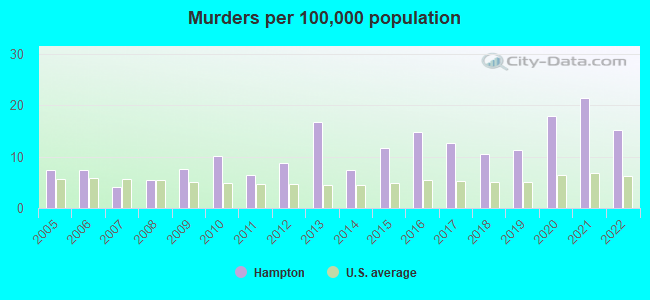
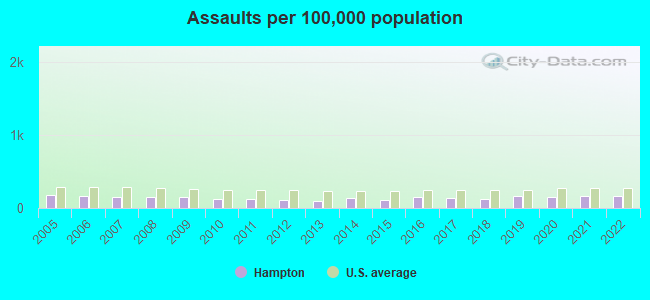
The 2022 crime rate in Hampton, VA is 240 (City-Data.com crime index), which is comparable to the U.S. average. It was higher than in 81.3% U.S. cities. The 2022 Hampton crime rate fell by 2% compared to 2021. The number of homicides stood at 21 - a decrease of 8 compared to 2021. In the last 5 years Hampton has seen increasing violent crime and decreasing property crime.See how dangerous Hampton, VA is compared to the nearest cities:
(Note: Higher means more crime)
(Note: Higher means more crime)
| Hampton: | 239.8 |
| Poquoson: | 76.7 |
| Newport News: | 288.4 |
| Norfolk: | 461.0 |
| Portsmouth: | 537.5 |
| Smithfield: | 99.7 |
| Chesapeake: | 214.0 |
| Virginia Beach: | 109.6 |
| Suffolk: | 226.4 |
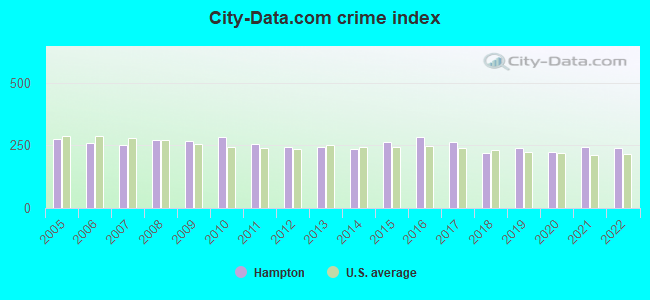
The City-Data.com crime index weighs serious crimes and violent crimes more heavily. Higher means more crime, U.S. average is 246.1. It adjusts for the number of visitors and daily workers commuting into cities.
- means the value is smaller than the state average.- means the value is about the same as the state average.
- means the value is bigger than the state average.
- means the value is much bigger than the state average.
According to our research of Virginia and other state lists, there were 515 registered sex offenders living in Hampton, Virginia as of May 17, 2024.
The ratio of all residents to sex offenders in Hampton is 263 to 1.
Violent crime rate in 2022
| Hampton: | 173.9 |
| U.S. Average: | 219.8 |
Violent crime rate in 2021
| Hampton: | 196.5 |
| U.S. Average: | 224.8 |
Violent crime rate in 2020
| Hampton: | 172.7 |
| U.S. Average: | 228.2 |
Violent crime rate in 2019
| Hampton: | 176.5 |
| U.S. Average: | 219.9 |
Violent crime rate in 2018
| Hampton: | 146.7 |
| U.S. Average: | 221.2 |
Violent crime rate in 2017
| Hampton: | 181.9 |
| U.S. Average: | 226.2 |
Violent crime rate in 2016
| Hampton: | 197.8 |
| U.S. Average: | 227.3 |
Violent crime rate in 2015
| Hampton: | 169.7 |
| U.S. Average: | 219.3 |
Violent crime rate in 2014
| Hampton: | 150.8 |
| U.S. Average: | 211.1 |
Violent crime rate in 2013
| Hampton: | 140.2 |
| U.S. Average: | 214.2 |
Violent crime rate in 2012
| Hampton: | 140.7 |
| U.S. Average: | 187.4 |
Violent crime rate in 2011
| Hampton: | 139.1 |
| U.S. Average: | 187.1 |
Violent crime rate in 2010
| Hampton: | 169.5 |
| U.S. Average: | 195.7 |
Violent crime rate in 2009
| Hampton: | 173.7 |
| U.S. Average: | 208.9 |
Violent crime rate in 2008
| Hampton: | 181.3 |
| U.S. Average: | 222.5 |
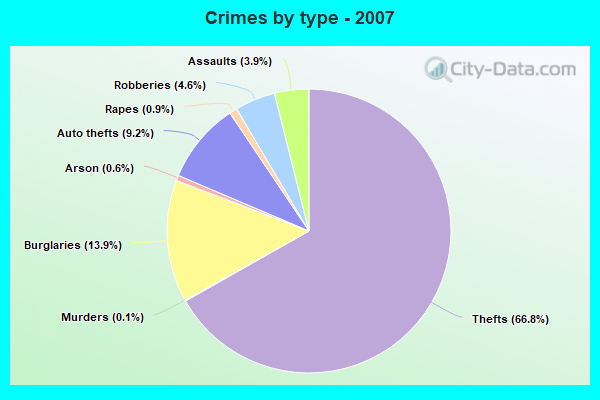
Violent crime rate in 2007
| Hampton: | 181.3 |
| U.S. Average: | 229.1 |
Violent crime rate in 2006
| Hampton: | 197.4 |
| U.S. Average: | 232.6 |
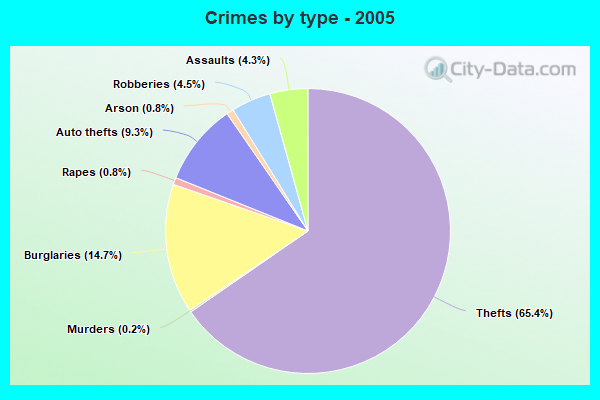
Violent crime rate in 2005
| Hampton: | 200.5 |
| U.S. Average: | 227.0 |
Property crime rate in 2022
| Hampton: | 201.8 |
| U.S. Average: | 166.5 |
Property crime rate in 2021
| Hampton: | 180.1 |
| U.S. Average: | 157.8 |
Property crime rate in 2020
| Hampton: | 178.5 |
| U.S. Average: | 169.6 |
Property crime rate in 2019
| Hampton: | 203.1 |
| U.S. Average: | 179.7 |
Property crime rate in 2018
| Hampton: | 213.6 |
| U.S. Average: | 190.2 |
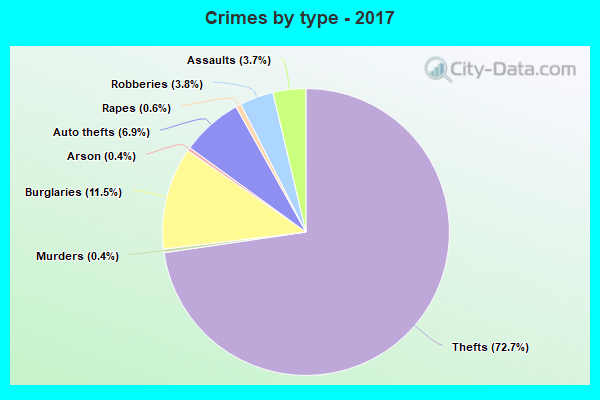
Property crime rate in 2017
| Hampton: | 248.2 |
| U.S. Average: | 206.4 |
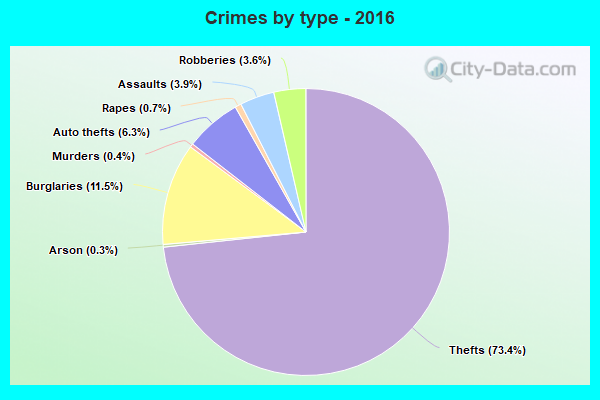
Property crime rate in 2016
| Hampton: | 260.9 |
| U.S. Average: | 216.6 |
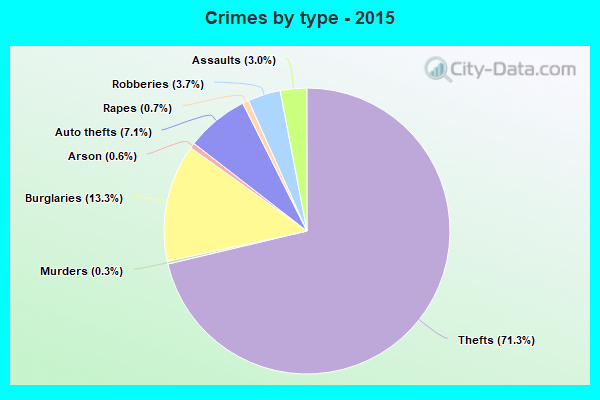
Property crime rate in 2015
| Hampton: | 262.0 |
| U.S. Average: | 221.5 |
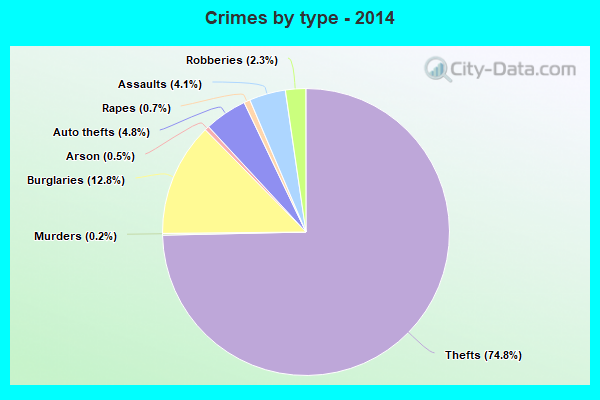
Property crime rate in 2014
| Hampton: | 246.8 |
| U.S. Average: | 230.8 |
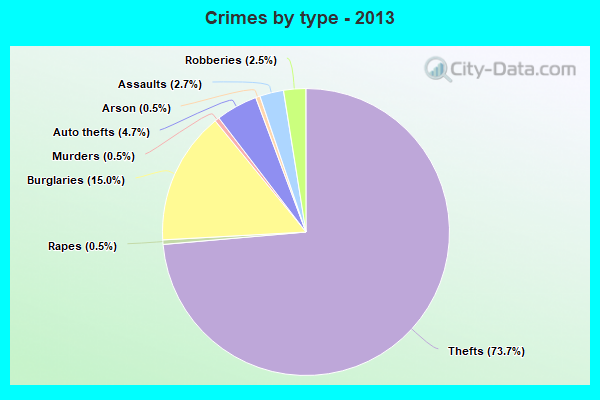
Property crime rate in 2013
| Hampton: | 259.2 |
| U.S. Average: | 250.4 |
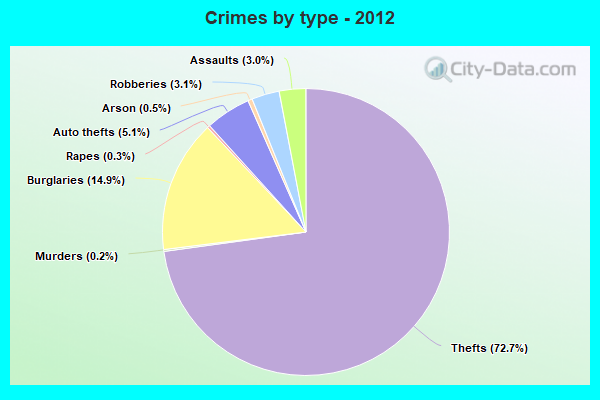
Property crime rate in 2012
| Hampton: | 270.5 |
| U.S. Average: | 267.3 |
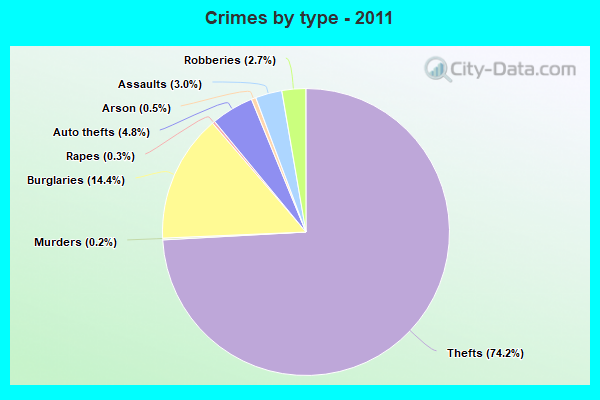
Property crime rate in 2011
| Hampton: | 296.8 |
| U.S. Average: | 273.5 |
Property crime rate in 2010
| Hampton: | 303.4 |
| U.S. Average: | 276.4 |
Property crime rate in 2009
| Hampton: | 290.4 |
| U.S. Average: | 285.6 |
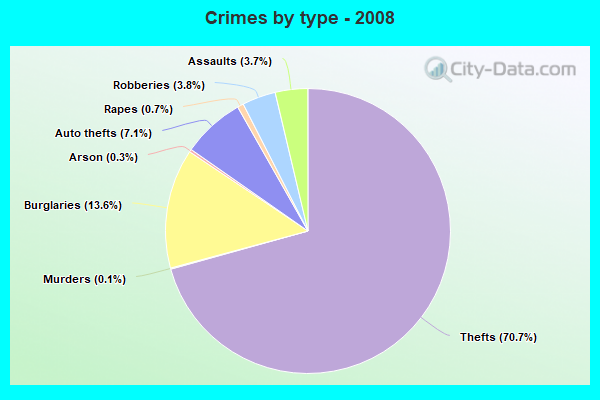
Property crime rate in 2008
| Hampton: | 282.3 |
| U.S. Average: | 302.2 |
Property crime rate in 2007
| Hampton: | 252.2 |
| U.S. Average: | 309.2 |
Property crime rate in 2006
| Hampton: | 245.5 |
| U.S. Average: | 317.3 |
Property crime rate in 2005
| Hampton: | 274.1 |
| U.S. Average: | 322.3 |
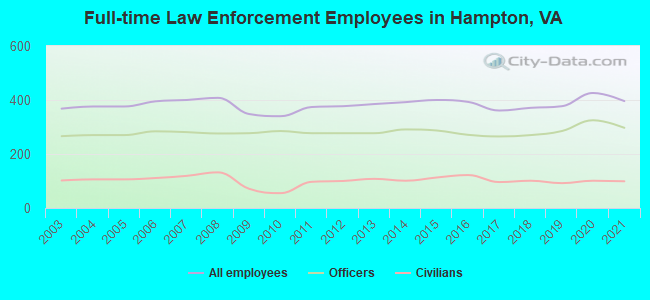
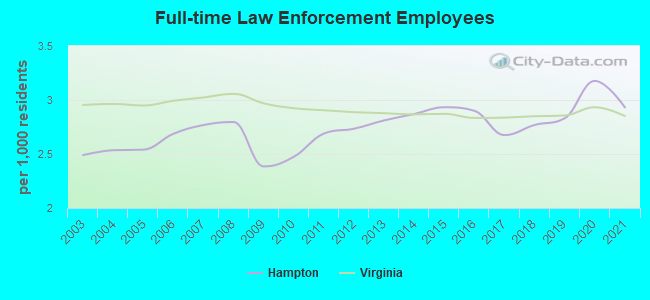
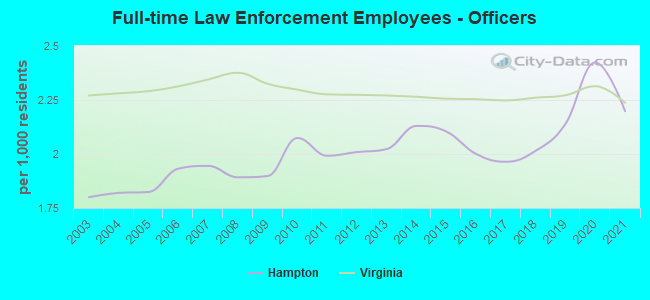
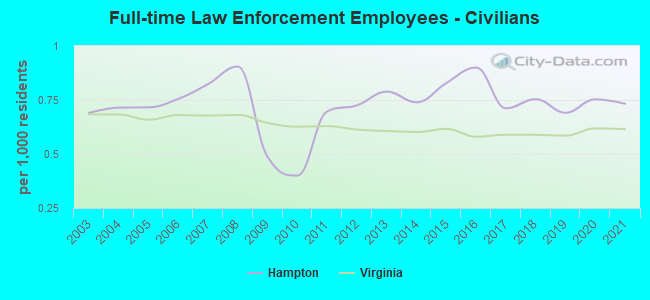
Full-time law enforcement employees in 2021, including police officers: 396 (297 officers - 248 male; 49 female).
| Officers per 1,000 residents here: | 2.20 |
| Virginia average: | 2.24 |
Full-time law enforcement employees in 2020, including police officers: 426 (325 officers - 272 male; 53 female).
| Officers per 1,000 residents here: | 2.42 |
| Virginia average: | 2.31 |
Full-time law enforcement employees in 2019, including police officers: 377 (285 officers - 239 male; 46 female).
| Officers per 1,000 residents here: | 2.14 |
| Virginia average: | 2.27 |
Full-time law enforcement employees in 2018, including police officers: 371 (270 officers - 228 male; 42 female).
| Officers per 1,000 residents here: | 2.02 |
| Virginia average: | 2.26 |
Full-time law enforcement employees in 2017, including police officers: 361 (265 officers - 222 male; 43 female).
| Officers per 1,000 residents here: | 1.96 |
| Virginia average: | 2.25 |
Full-time law enforcement employees in 2016, including police officers: 393 (271 officers - 228 male; 43 female).
| Officers per 1,000 residents here: | 2.00 |
| Virginia average: | 2.25 |
Full-time law enforcement employees in 2015, including police officers: 400 (287 officers - 244 male; 43 female).
| Officers per 1,000 residents here: | 2.10 |
| Virginia average: | 2.26 |
Full-time law enforcement employees in 2014, including police officers: 392 (291 officers - 249 male; 42 female).
| Officers per 1,000 residents here: | 2.13 |
| Virginia average: | 2.27 |
Full-time law enforcement employees in 2013, including police officers: 385 (277 officers - 233 male; 44 female).
| Officers per 1,000 residents here: | 2.02 |
| Virginia average: | 2.27 |
Full-time law enforcement employees in 2012, including police officers: 377 (277 officers - 232 male; 45 female).
| Officers per 1,000 residents here: | 2.01 |
| Virginia average: | 2.27 |
Full-time law enforcement employees in 2011, including police officers: 374 (277 officers - 231 male; 46 female).
| Officers per 1,000 residents here: | 1.99 |
| Virginia average: | 2.28 |
Full-time law enforcement employees in 2010, including police officers: 340 (285 officers - 238 male; 47 female).
| Officers per 1,000 residents here: | 2.07 |
| Virginia average: | 2.30 |
Full-time law enforcement employees in 2009, including police officers: 348 (277 officers - 229 male; 48 female).
| Officers per 1,000 residents here: | 1.90 |
| Virginia average: | 2.32 |
Full-time law enforcement employees in 2008, including police officers: 408 (276 officers - 231 male; 45 female).
| Officers per 1,000 residents here: | 1.89 |
| Virginia average: | 2.38 |
Full-time law enforcement employees in 2007, including police officers: 400 (281 officers - 235 male; 46 female).
| Officers per 1,000 residents here: | 1.94 |
| Virginia average: | 2.34 |
Full-time law enforcement employees in 2006, including police officers: 395 (284 officers - 240 male; 44 female).
| Officers per 1,000 residents here: | 1.93 |
| Virginia average: | 2.31 |
Full-time law enforcement employees in 2005, including police officers: 376 (270 officers - 230 male; 40 female).
| Officers per 1,000 residents here: | 1.82 |
| Virginia average: | 2.29 |
Full-time law enforcement employees in 2004, including police officers: 376 (270 officers - 230 male; 40 female).
| Officers per 1,000 residents here: | 1.82 |
| Virginia average: | 2.28 |
Full-time law enforcement employees in 2003, including police officers: 368 (266 officers - 226 male; 40 female).
| Officers per 1,000 residents here: | 1.80 |
| Virginia average: | 2.27 |