Crime rate in Hartford, Connecticut (CT): murders, rapes, robberies, assaults, burglaries, thefts, auto thefts, arson, law enforcement employees, police officers, crime map
Crime rate in Hartford, CT
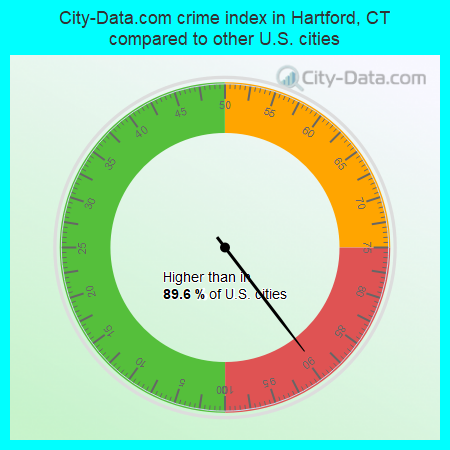
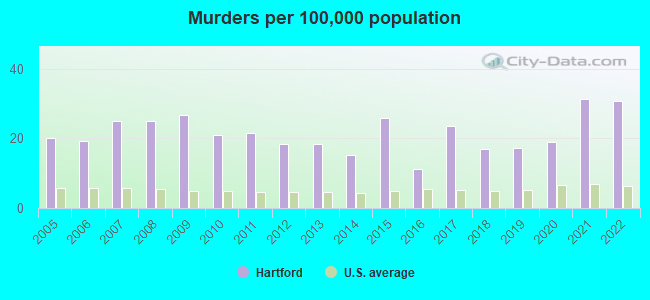
The 2022 crime rate in Hartford, CT is 319 (City-Data.com crime index), which is 1.3 times higher than the U.S. average. It was higher than in 89.6% U.S. cities. The 2022 Hartford crime rate fell by 11% compared to 2021. The number of homicides stood at 37 - a decrease of 1 compared to 2021. In the last 5 years Hartford has seen decreasing violent crime and decline of property crime.See how dangerous Hartford, CT is compared to the nearest cities:
(Note: Higher means more crime)
(Note: Higher means more crime)
| Hartford: | 319.4 |
| West Hartford: | 134.2 |
| East Hartford: | 199.4 |
| Wethersfield: | 110.9 |
| Bloomfield: | 155.4 |
| Newington: | 159.1 |
| Windsor: | 90.2 |
| Rocky Hill: | 121.0 |
| Glastonbury: | 71.9 |
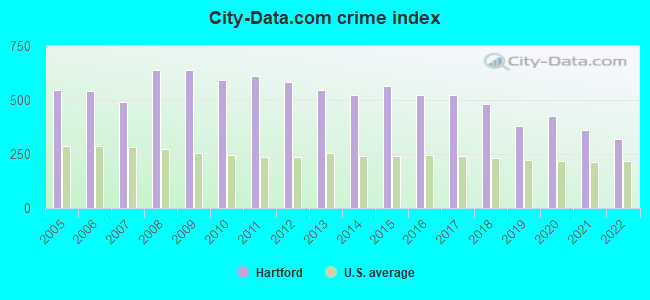
The City-Data.com crime index weighs serious crimes and violent crimes more heavily. Higher means more crime, U.S. average is 246.1. It adjusts for the number of visitors and daily workers commuting into cities.
- means the value is smaller than the state average.- means the value is about the same as the state average.
- means the value is bigger than the state average.
- means the value is much bigger than the state average.
According to our research of Connecticut and other state lists, there were 554 registered sex offenders living in Hartford, Connecticut as of May 21, 2024.
The ratio of all residents to sex offenders in Hartford is 223 to 1.
Violent crime rate in 2022
| Hartford: | 340.3 |
| U.S. Average: | 219.8 |
Violent crime rate in 2021
| Hartford: | 386.3 |
| U.S. Average: | 224.8 |
Violent crime rate in 2020
| Hartford: | 537.2 |
| U.S. Average: | 228.2 |
Violent crime rate in 2019
| Hartford: | 467.5 |
| U.S. Average: | 219.9 |
Violent crime rate in 2018
| Hartford: | 580.3 |
| U.S. Average: | 221.2 |
Violent crime rate in 2017
| Hartford: | 600.1 |
| U.S. Average: | 226.2 |
Violent crime rate in 2016
| Hartford: | 590.0 |
| U.S. Average: | 227.3 |
Violent crime rate in 2015
| Hartford: | 626.6 |
| U.S. Average: | 219.3 |
Violent crime rate in 2014
| Hartford: | 593.1 |
| U.S. Average: | 211.1 |
Violent crime rate in 2013
| Hartford: | 638.4 |
| U.S. Average: | 214.2 |
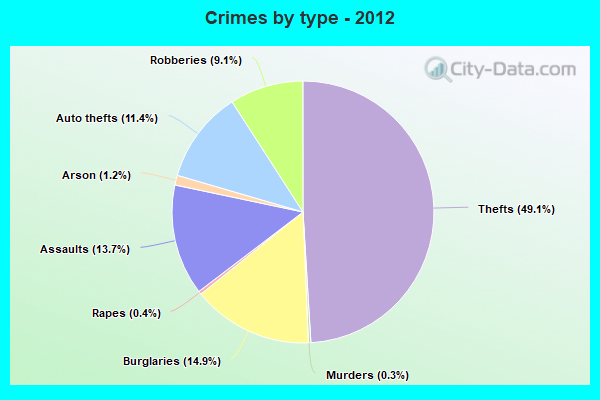
Violent crime rate in 2012
| Hartford: | 699.3 |
| U.S. Average: | 187.4 |
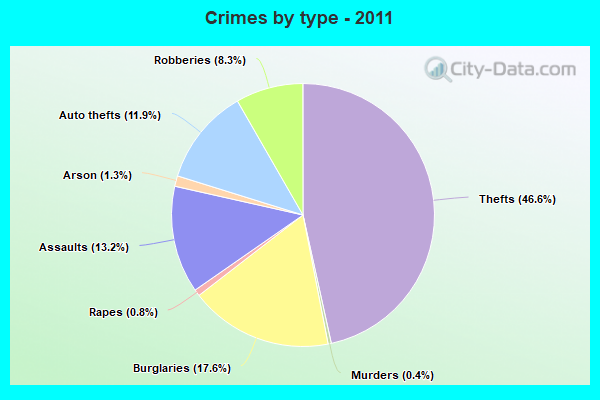
Violent crime rate in 2011
| Hartford: | 710.0 |
| U.S. Average: | 187.1 |
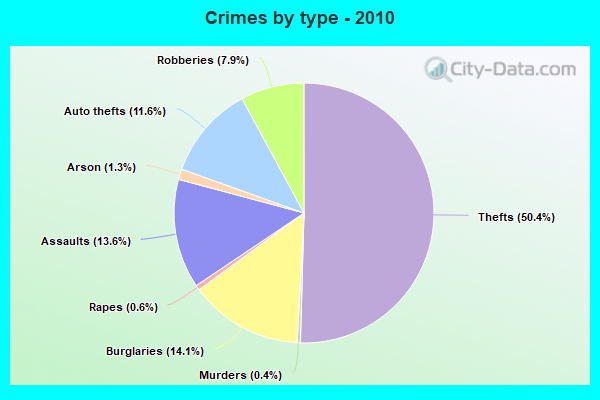
Violent crime rate in 2010
| Hartford: | 700.5 |
| U.S. Average: | 195.7 |
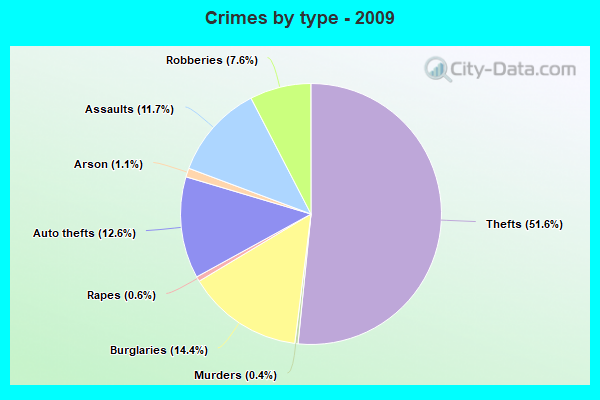
Violent crime rate in 2009
| Hartford: | 705.8 |
| U.S. Average: | 208.9 |
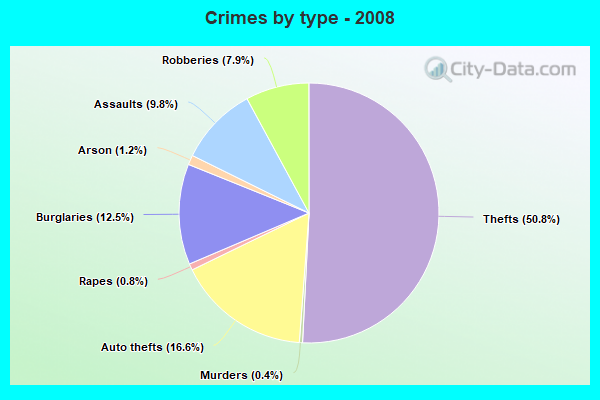
Violent crime rate in 2008
| Hartford: | 664.9 |
| U.S. Average: | 222.5 |
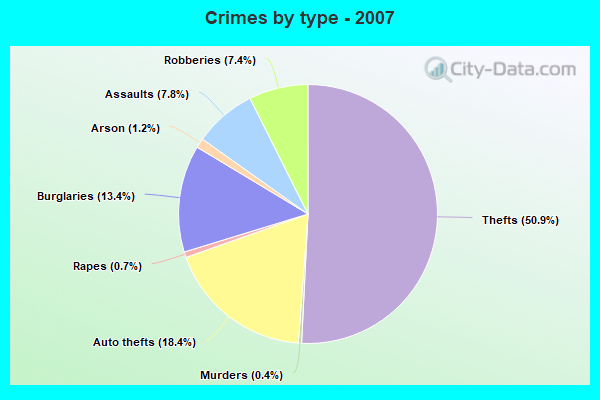
Violent crime rate in 2007
| Hartford: | 463.4 |
| U.S. Average: | 229.1 |
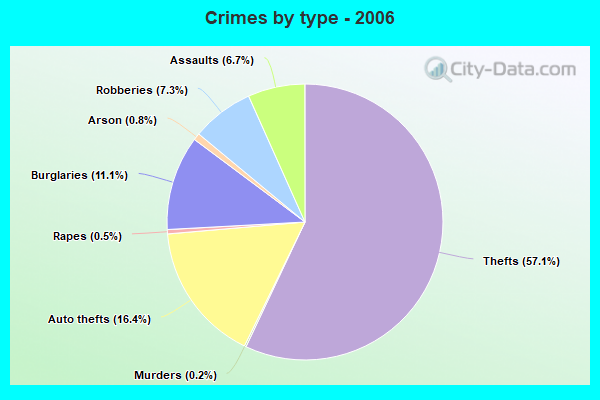
Violent crime rate in 2006
| Hartford: | 490.6 |
| U.S. Average: | 232.6 |
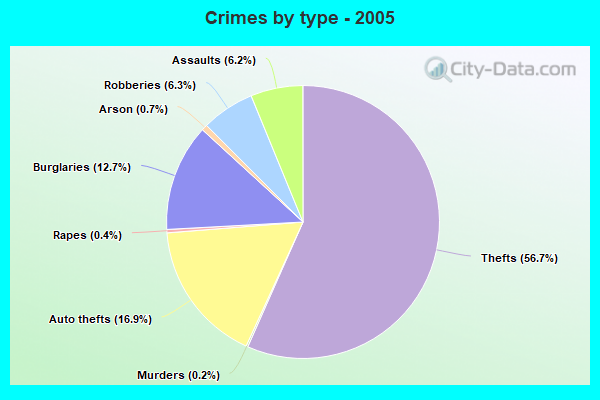
Violent crime rate in 2005
| Hartford: | 461.8 |
| U.S. Average: | 227.0 |
Property crime rate in 2022
| Hartford: | 218.8 |
| U.S. Average: | 166.5 |
Property crime rate in 2021
| Hartford: | 235.3 |
| U.S. Average: | 157.8 |
Property crime rate in 2020
| Hartford: | 261.8 |
| U.S. Average: | 169.6 |
Property crime rate in 2019
| Hartford: | 236.0 |
| U.S. Average: | 179.7 |
Property crime rate in 2018
| Hartford: | 314.0 |
| U.S. Average: | 190.2 |
Property crime rate in 2017
| Hartford: | 345.0 |
| U.S. Average: | 206.4 |
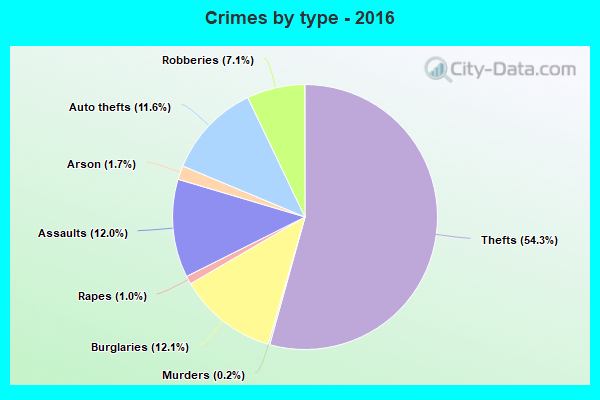
Property crime rate in 2016
| Hartford: | 370.4 |
| U.S. Average: | 216.6 |
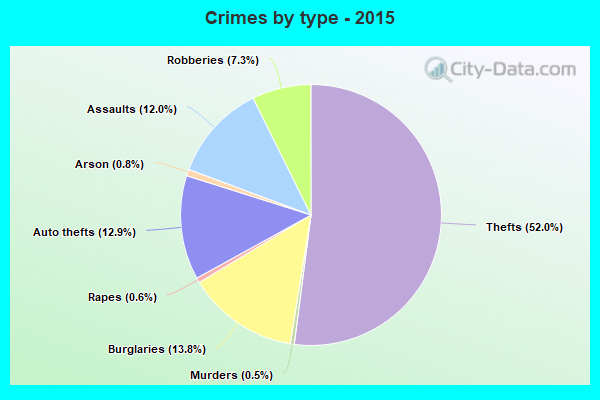
Property crime rate in 2015
| Hartford: | 406.9 |
| U.S. Average: | 221.5 |
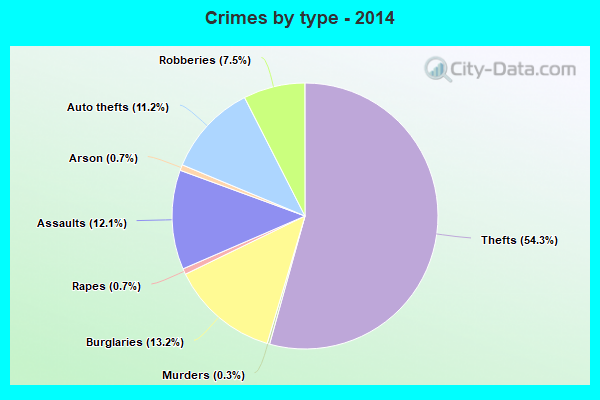
Property crime rate in 2014
| Hartford: | 377.9 |
| U.S. Average: | 230.8 |
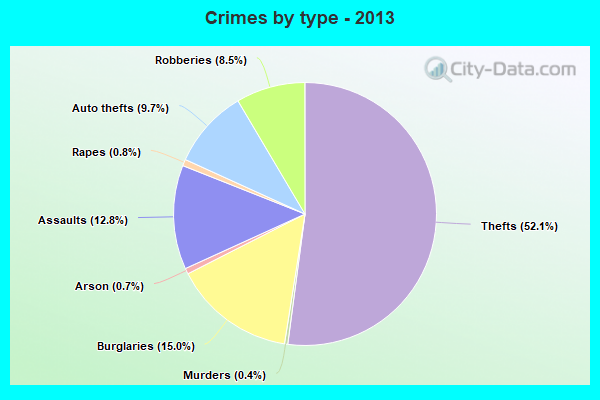
Property crime rate in 2013
| Hartford: | 370.5 |
| U.S. Average: | 250.4 |
Property crime rate in 2012
| Hartford: | 402.3 |
| U.S. Average: | 267.3 |
Property crime rate in 2011
| Hartford: | 441.3 |
| U.S. Average: | 273.5 |
Property crime rate in 2010
| Hartford: | 409.8 |
| U.S. Average: | 276.4 |
Property crime rate in 2009
| Hartford: | 466.8 |
| U.S. Average: | 285.6 |
Property crime rate in 2008
| Hartford: | 482.5 |
| U.S. Average: | 302.2 |
Property crime rate in 2007
| Hartford: | 412.8 |
| U.S. Average: | 309.2 |
Property crime rate in 2006
| Hartford: | 467.6 |
| U.S. Average: | 317.3 |
Property crime rate in 2005
| Hartford: | 514.9 |
| U.S. Average: | 322.3 |
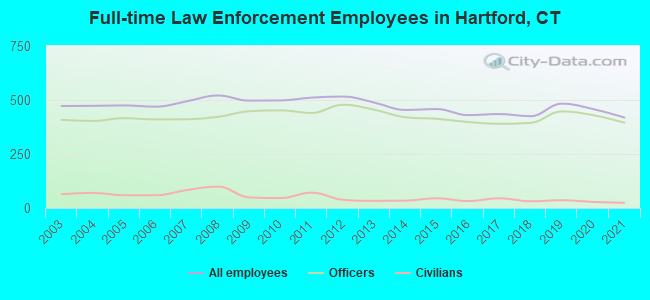
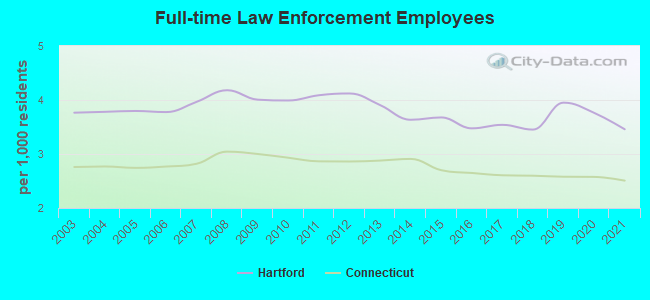
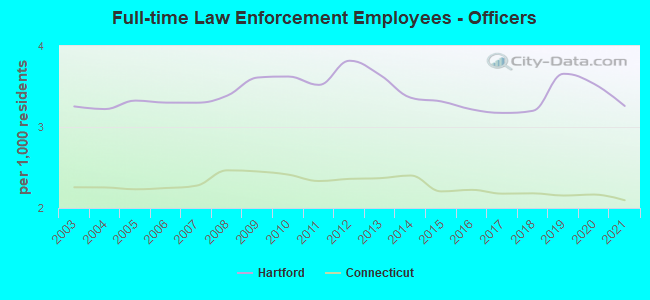
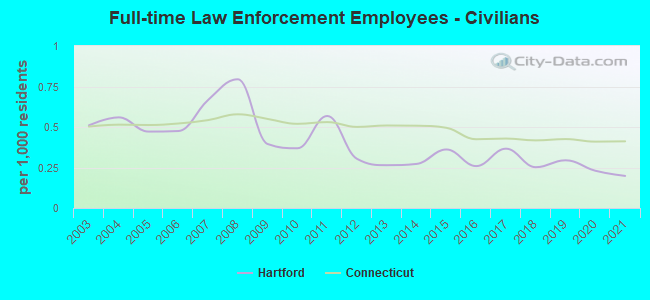
Full-time law enforcement employees in 2021, including police officers: 419 (395 officers - 339 male; 56 female).
| Officers per 1,000 residents here: | 3.26 |
| Connecticut average: | 2.10 |
Full-time law enforcement employees in 2020, including police officers: 458 (430 officers - 365 male; 65 female).
| Officers per 1,000 residents here: | 3.53 |
| Connecticut average: | 2.17 |
Full-time law enforcement employees in 2019, including police officers: 483 (447 officers - 374 male; 73 female).
| Officers per 1,000 residents here: | 3.66 |
| Connecticut average: | 2.15 |
Full-time law enforcement employees in 2018, including police officers: 425 (394 officers - 346 male; 48 female).
| Officers per 1,000 residents here: | 3.20 |
| Connecticut average: | 2.18 |
Full-time law enforcement employees in 2017, including police officers: 435 (390 officers - 345 male; 45 female).
| Officers per 1,000 residents here: | 3.17 |
| Connecticut average: | 2.18 |
Full-time law enforcement employees in 2016, including police officers: 430 (398 officers - 356 male; 42 female).
| Officers per 1,000 residents here: | 3.22 |
| Connecticut average: | 2.22 |
Full-time law enforcement employees in 2015, including police officers: 458 (413 officers - 368 male; 45 female).
| Officers per 1,000 residents here: | 3.32 |
| Connecticut average: | 2.21 |
Full-time law enforcement employees in 2014, including police officers: 454 (420 officers - 374 male; 46 female).
| Officers per 1,000 residents here: | 3.36 |
| Connecticut average: | 2.40 |
Full-time law enforcement employees in 2013, including police officers: 488 (455 officers - 405 male; 50 female).
| Officers per 1,000 residents here: | 3.64 |
| Connecticut average: | 2.37 |
Full-time law enforcement employees in 2012, including police officers: 516 (478 officers - 427 male; 51 female).
| Officers per 1,000 residents here: | 3.82 |
| Connecticut average: | 2.36 |
Full-time law enforcement employees in 2011, including police officers: 511 (440 officers - 393 male; 47 female).
| Officers per 1,000 residents here: | 3.52 |
| Connecticut average: | 2.33 |
Full-time law enforcement employees in 2010, including police officers: 498 (452 officers - 405 male; 47 female).
| Officers per 1,000 residents here: | 3.62 |
| Connecticut average: | 2.41 |
Full-time law enforcement employees in 2009, including police officers: 497 (448 officers - 400 male; 48 female).
| Officers per 1,000 residents here: | 3.61 |
| Connecticut average: | 2.45 |
Full-time law enforcement employees in 2008, including police officers: 521 (422 officers - 378 male; 44 female).
| Officers per 1,000 residents here: | 3.39 |
| Connecticut average: | 2.47 |
Full-time law enforcement employees in 2007, including police officers: 494 (411 officers - 369 male; 42 female).
| Officers per 1,000 residents here: | 3.30 |
| Connecticut average: | 2.28 |
Full-time law enforcement employees in 2006, including police officers: 469 (410 officers - 365 male; 45 female).
| Officers per 1,000 residents here: | 3.30 |
| Connecticut average: | 2.25 |
Full-time law enforcement employees in 2005, including police officers: 475 (416 officers - 371 male; 45 female).
| Officers per 1,000 residents here: | 3.33 |
| Connecticut average: | 2.23 |
Full-time law enforcement employees in 2004, including police officers: 473 (403 officers - 359 male; 44 female).
| Officers per 1,000 residents here: | 3.22 |
| Connecticut average: | 2.25 |
Full-time law enforcement employees in 2003, including police officers: 472 (408 officers - 361 male; 47 female).
| Officers per 1,000 residents here: | 3.25 |
| Connecticut average: | 2.26 |
Zip codes: 06095, 06103, 06105, 06106, 06110, 06112, 06114, 06117, 06120, 06160.