Crime rate in Irvington, New Jersey (NJ): murders, rapes, robberies, assaults, burglaries, thefts, auto thefts, arson, law enforcement employees, police officers, crime map
Crime rate in Irvington, NJ
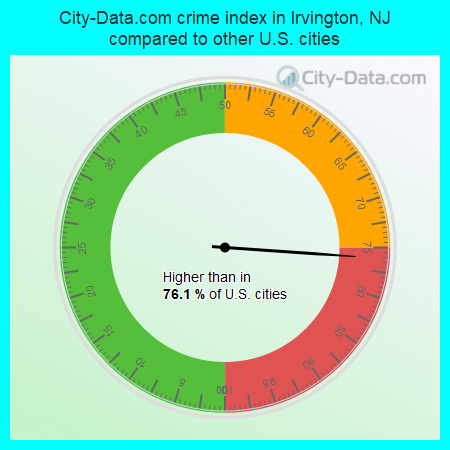
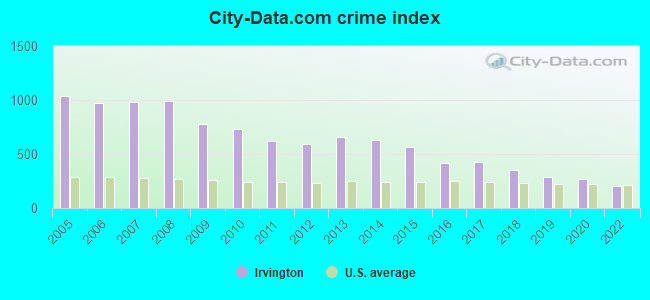
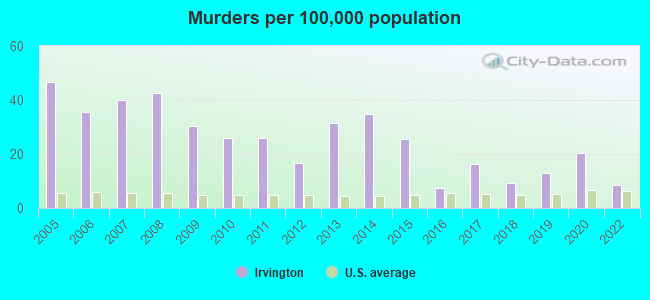
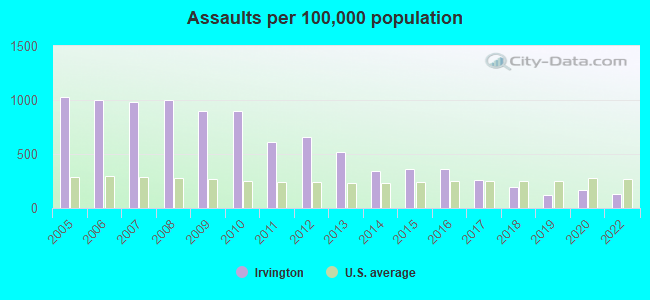
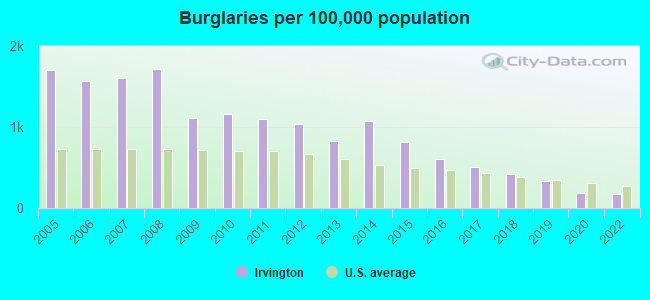
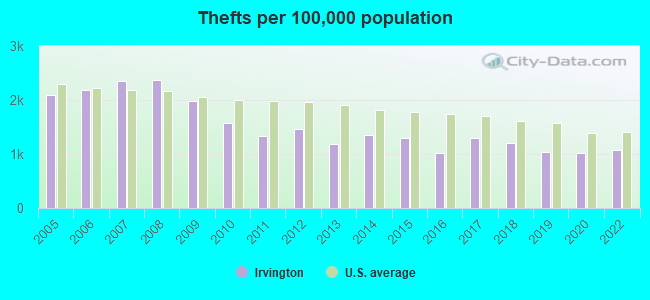
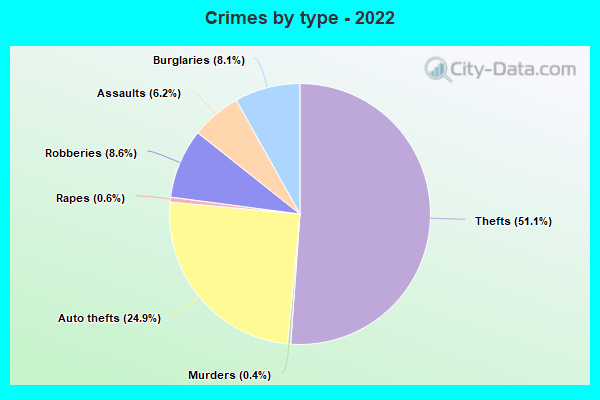
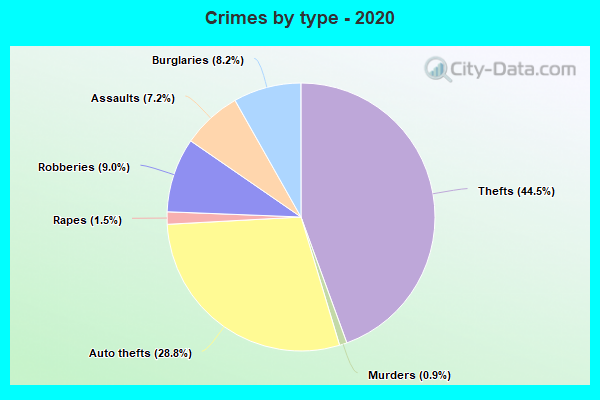
The 2022 crime rate in Irvington, NJ is 204 (City-Data.com crime index), which is 1.2 times smaller than the U.S. average. It was higher than in 76.1% U.S. cities. The 2022 Irvington crime rate fell by 24% compared to 2020. The number of homicides stood at 5 - a decrease of 6 compared to 2020. In the last 5 years Irvington has seen decreasing violent crime and decline of property crime.See how dangerous Irvington, NJ is compared to the nearest cities:
(Note: Higher means more crime)
(Note: Higher means more crime)
| Irvington: | 204.0 |
| Maplewood: | 104.0 |
| South Orange: | 67.1 |
| Hillside: | 214.7 |
| Newark: | 273.8 |
| Union: | 81.6 |
| Orange: | 209.4 |
| East Orange: | 88.2 |
| East Newark: | 71.3 |
The City-Data.com crime index weighs serious crimes and violent crimes more heavily. Higher means more crime, U.S. average is 246.1. It adjusts for the number of visitors and daily workers commuting into cities.
- means the value is smaller than the state average.- means the value is about the same as the state average.
- means the value is bigger than the state average.
- means the value is much bigger than the state average.
According to our research of New Jersey and other state lists, there were 113 registered sex offenders living in Irvington, New Jersey as of May 21, 2024.
The ratio of all residents to sex offenders in Irvington is 521 to 1.
Violent crime rate in 2022
| Irvington: | 185.8 |
| U.S. Average: | 219.8 |
Violent crime rate in 2020
| Irvington: | 258.7 |
| U.S. Average: | 228.2 |
Violent crime rate in 2019
| Irvington: | 294.3 |
| U.S. Average: | 219.9 |
Violent crime rate in 2018
| Irvington: | 362.4 |
| U.S. Average: | 221.2 |
Violent crime rate in 2017
| Irvington: | 461.4 |
| U.S. Average: | 226.2 |
Violent crime rate in 2016
| Irvington: | 501.6 |
| U.S. Average: | 227.3 |
Violent crime rate in 2015
| Irvington: | 639.7 |
| U.S. Average: | 219.3 |
Violent crime rate in 2014
| Irvington: | 700.7 |
| U.S. Average: | 211.1 |
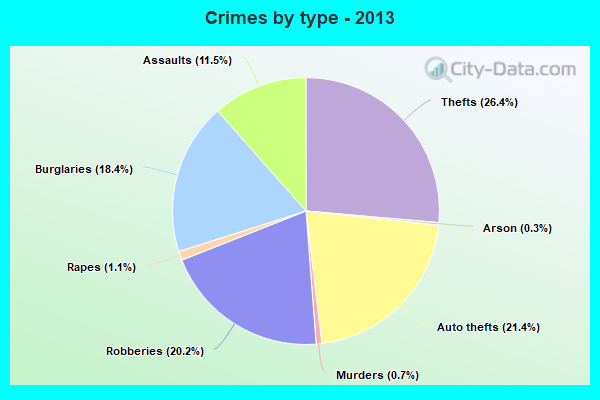
Violent crime rate in 2013
| Irvington: | 823.1 |
| U.S. Average: | 214.2 |
Violent crime rate in 2012
| Irvington: | 695.5 |
| U.S. Average: | 187.4 |
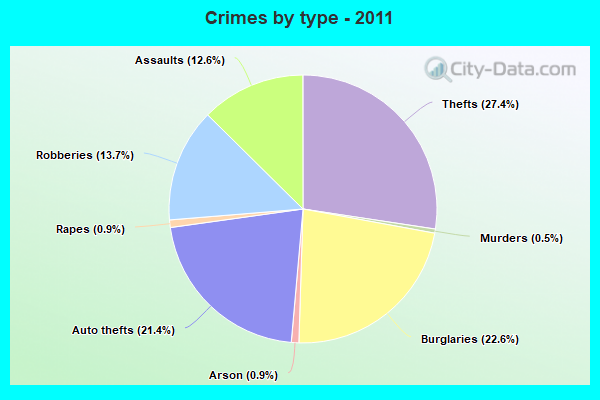
Violent crime rate in 2011
| Irvington: | 733.8 |
| U.S. Average: | 187.1 |
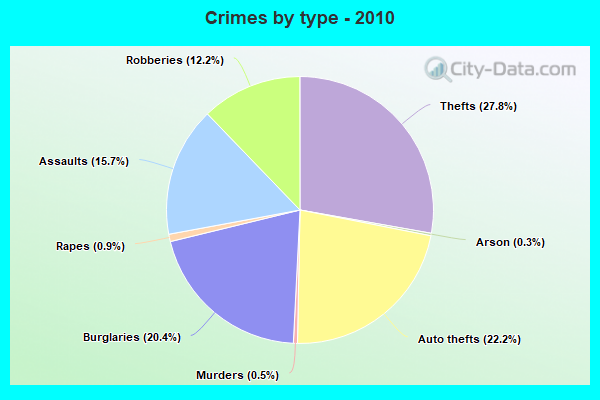
Violent crime rate in 2010
| Irvington: | 900.3 |
| U.S. Average: | 195.7 |
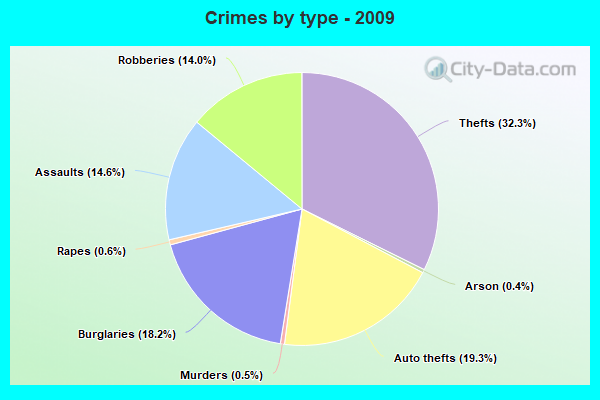
Violent crime rate in 2009
| Irvington: | 974.2 |
| U.S. Average: | 208.9 |
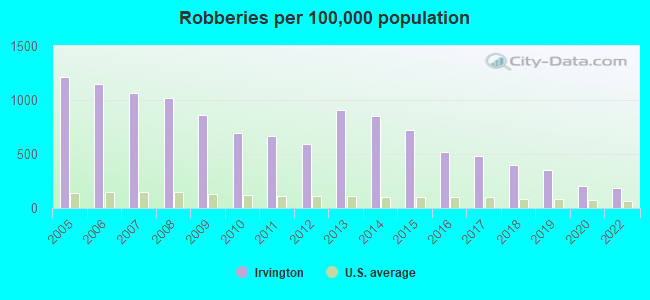
Violent crime rate in 2008
| Irvington: | 1,167.4 |
| U.S. Average: | 222.5 |
Violent crime rate in 2007
| Irvington: | 1,155.3 |
| U.S. Average: | 229.1 |
Violent crime rate in 2006
| Irvington: | 1,186.1 |
| U.S. Average: | 232.6 |
Violent crime rate in 2005
| Irvington: | 1,254.5 |
| U.S. Average: | 227.0 |
Property crime rate in 2022
| Irvington: | 165.3 |
| U.S. Average: | 166.5 |
Property crime rate in 2020
| Irvington: | 186.3 |
| U.S. Average: | 169.6 |
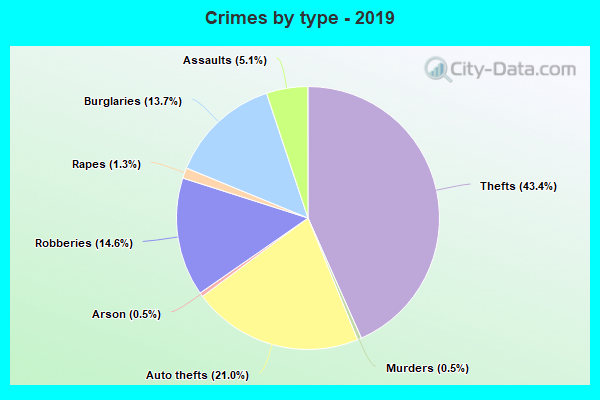
Property crime rate in 2019
| Irvington: | 194.0 |
| U.S. Average: | 179.7 |
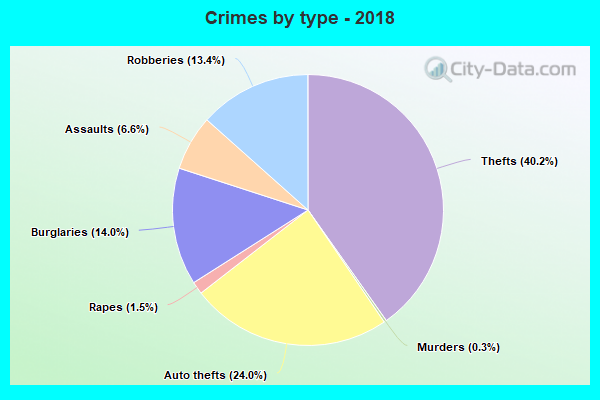
Property crime rate in 2018
| Irvington: | 253.4 |
| U.S. Average: | 190.2 |
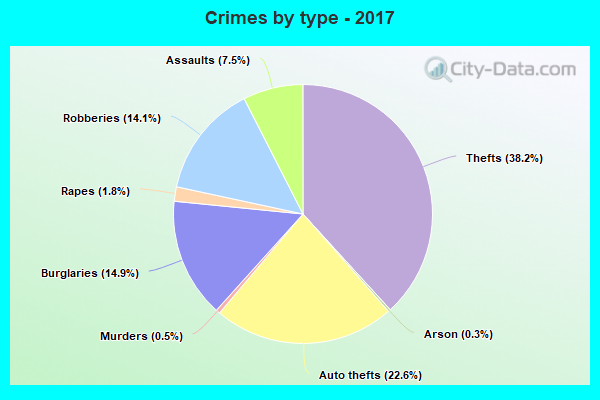
Property crime rate in 2017
| Irvington: | 281.8 |
| U.S. Average: | 206.4 |
Property crime rate in 2016
| Irvington: | 274.5 |
| U.S. Average: | 216.6 |
Property crime rate in 2015
| Irvington: | 379.0 |
| U.S. Average: | 221.5 |
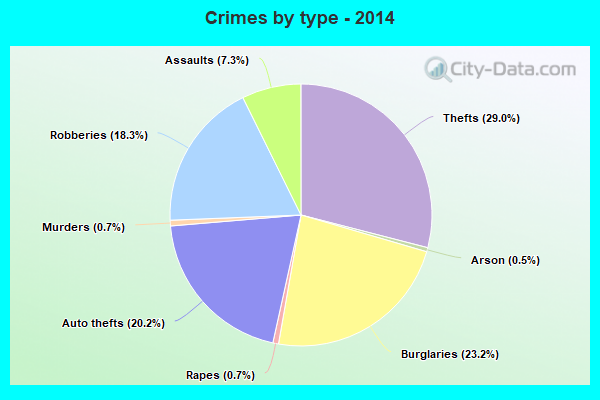
Property crime rate in 2014
| Irvington: | 425.1 |
| U.S. Average: | 230.8 |
Property crime rate in 2013
| Irvington: | 368.8 |
| U.S. Average: | 250.4 |
Property crime rate in 2012
| Irvington: | 448.6 |
| U.S. Average: | 267.3 |
Property crime rate in 2011
| Irvington: | 442.3 |
| U.S. Average: | 273.5 |
Property crime rate in 2010
| Irvington: | 500.5 |
| U.S. Average: | 276.4 |
Property crime rate in 2009
| Irvington: | 498.4 |
| U.S. Average: | 285.6 |
Property crime rate in 2008
| Irvington: | 695.3 |
| U.S. Average: | 302.2 |
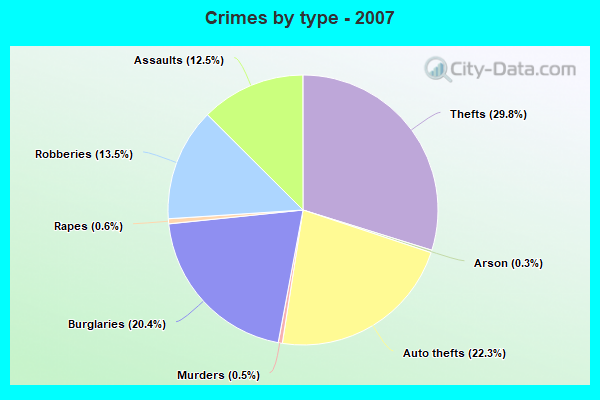
Property crime rate in 2007
| Irvington: | 702.7 |
| U.S. Average: | 309.2 |
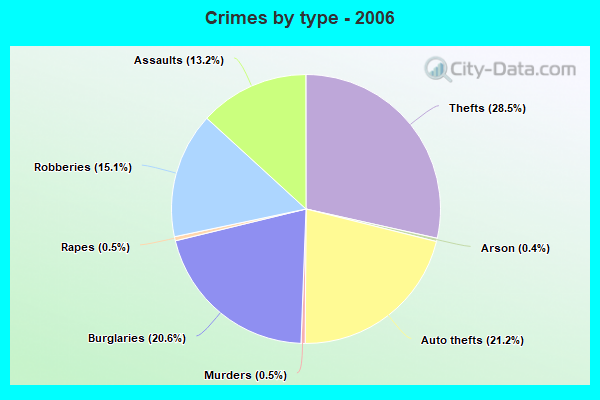
Property crime rate in 2006
| Irvington: | 665.7 |
| U.S. Average: | 317.3 |
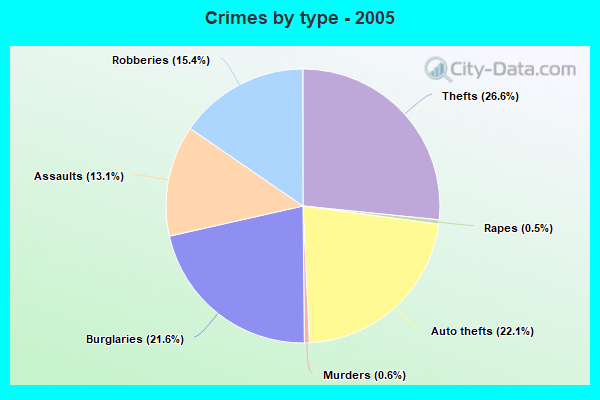
Property crime rate in 2005
| Irvington: | 705.9 |
| U.S. Average: | 322.3 |
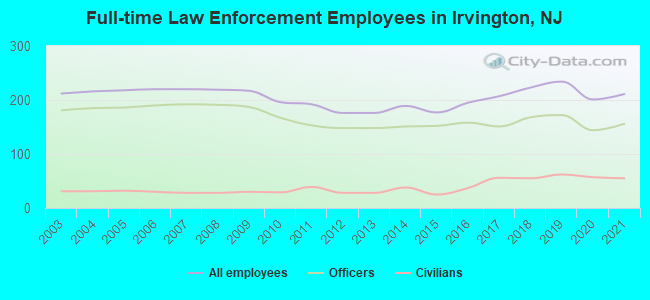
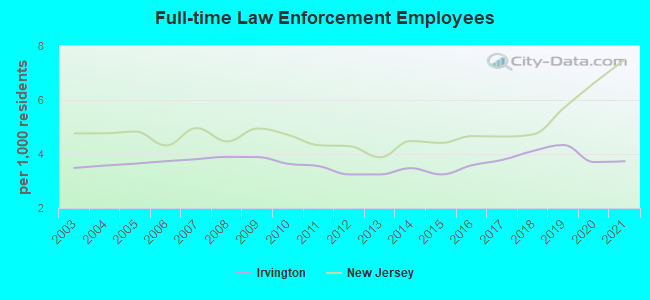
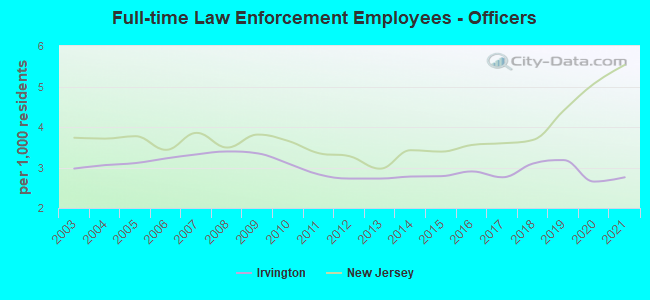
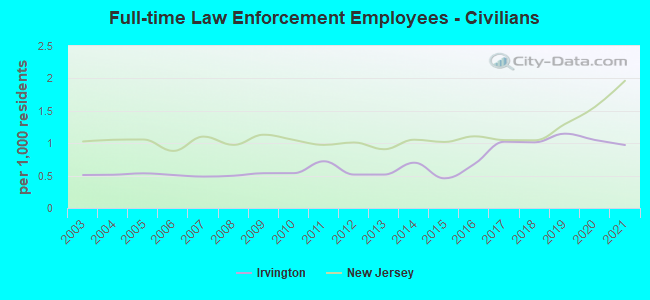
Full-time law enforcement employees in 2021, including police officers: 211 (156 officers - 111 male; 45 female).
| Officers per 1,000 residents here: | 2.76 |
| New Jersey average: | 5.53 |
Full-time law enforcement employees in 2020, including police officers: 201 (144 officers - 103 male; 41 female).
| Officers per 1,000 residents here: | 2.65 |
| New Jersey average: | 5.07 |
Full-time law enforcement employees in 2019, including police officers: 234 (172 officers - 124 male; 48 female).
| Officers per 1,000 residents here: | 3.18 |
| New Jersey average: | 4.40 |
Full-time law enforcement employees in 2018, including police officers: 223 (168 officers - 125 male; 43 female).
| Officers per 1,000 residents here: | 3.10 |
| New Jersey average: | 3.68 |
Full-time law enforcement employees in 2017, including police officers: 207 (151 officers - 112 male; 39 female).
| Officers per 1,000 residents here: | 2.76 |
| New Jersey average: | 3.60 |
Full-time law enforcement employees in 2016, including police officers: 195 (158 officers - 119 male; 39 female).
| Officers per 1,000 residents here: | 2.90 |
| New Jersey average: | 3.56 |
Full-time law enforcement employees in 2015, including police officers: 177 (152 officers - 117 male; 35 female).
| Officers per 1,000 residents here: | 2.79 |
| New Jersey average: | 3.39 |
Full-time law enforcement employees in 2014, including police officers: 189 (151 officers - 116 male; 35 female).
| Officers per 1,000 residents here: | 2.78 |
| New Jersey average: | 3.43 |
Full-time law enforcement employees in 2012, including police officers: 176 (148 officers - 118 male; 30 female).
| Officers per 1,000 residents here: | 2.73 |
| New Jersey average: | 3.28 |
Full-time law enforcement employees in 2011, including police officers: 192 (153 officers - 122 male; 31 female).
| Officers per 1,000 residents here: | 2.83 |
| New Jersey average: | 3.35 |
Full-time law enforcement employees in 2010, including police officers: 196 (167 officers - 135 male; 32 female).
| Officers per 1,000 residents here: | 3.10 |
| New Jersey average: | 3.66 |
Full-time law enforcement employees in 2009, including police officers: 217 (187 officers - 148 male; 39 female).
| Officers per 1,000 residents here: | 3.35 |
| New Jersey average: | 3.81 |
Full-time law enforcement employees in 2008, including police officers: 219 (191 officers - 153 male; 38 female).
| Officers per 1,000 residents here: | 3.40 |
| New Jersey average: | 3.49 |
Full-time law enforcement employees in 2007, including police officers: 220 (192 officers - 157 male; 35 female).
| Officers per 1,000 residents here: | 3.32 |
| New Jersey average: | 3.86 |
Full-time law enforcement employees in 2006, including police officers: 220 (190 officers - 156 male; 34 female).
| Officers per 1,000 residents here: | 3.22 |
| New Jersey average: | 3.44 |
Full-time law enforcement employees in 2005, including police officers: 218 (186 officers - 158 male; 28 female).
| Officers per 1,000 residents here: | 3.11 |
| New Jersey average: | 3.77 |
Full-time law enforcement employees in 2004, including police officers: 216 (185 officers - 159 male; 26 female).
| Officers per 1,000 residents here: | 3.06 |
| New Jersey average: | 3.71 |
Full-time law enforcement employees in 2003, including police officers: 212 (181 officers - 155 male; 26 female).
| Officers per 1,000 residents here: | 2.97 |
| New Jersey average: | 3.74 |


Zip codes: 07111.