Crime rate in Joliet, Illinois (IL): murders, rapes, robberies, assaults, burglaries, thefts, auto thefts, arson, law enforcement employees, police officers, crime map
Crime rate in Joliet, IL
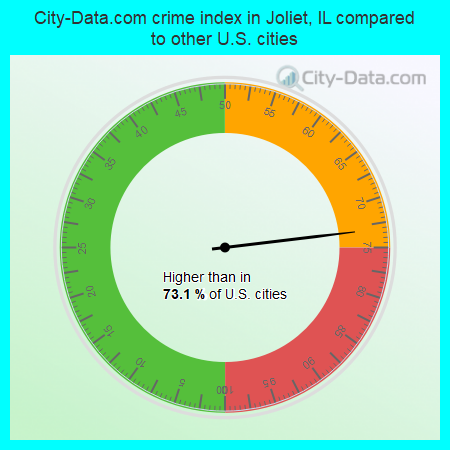
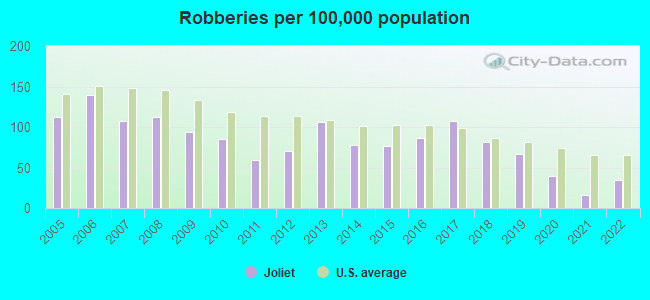
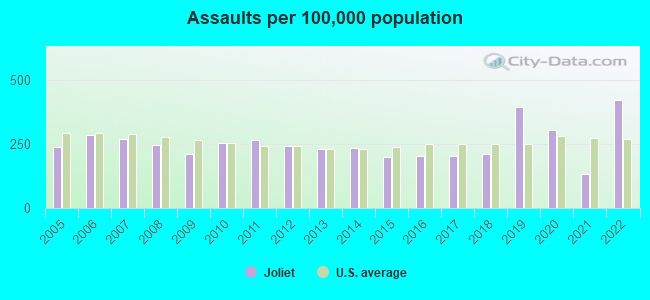
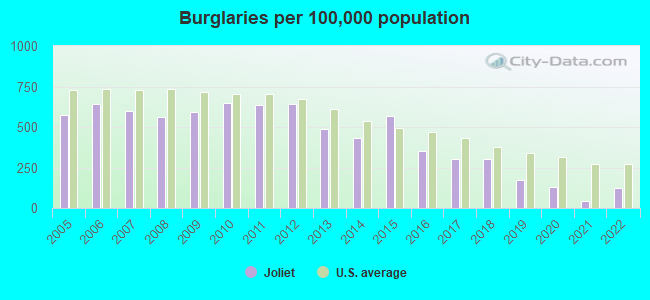
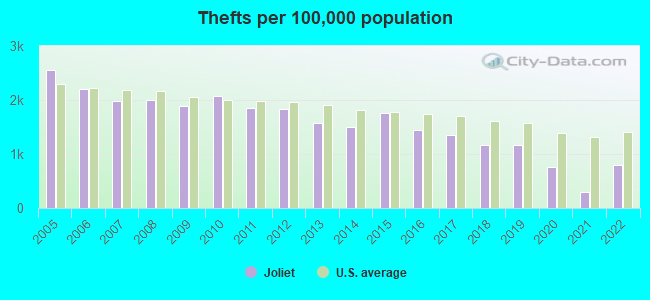
The 2022 crime rate in Joliet, IL is 189 (City-Data.com crime index), which is 1.3 times smaller than the U.S. average. It was higher than in 73.1% U.S. cities. The 2022 Joliet crime rate rose by 169% compared to 2021. The number of homicides stood at 2 - an increase of 1 compared to 2021. In the last 5 years Joliet has seen increasing violent crime and decreasing property crime.See how dangerous Joliet, IL is compared to the nearest cities:
(Note: Higher means more crime)
(Note: Higher means more crime)
| Joliet: | 188.9 |
| Crest Hill: | 164.7 |
| Fairmont: | 193.1 |
| Lockport: | 56.1 |
| Shorewood: | 57.2 |
| New Lenox: | 83.4 |
| Romeoville: | 89.8 |
| Plainfield: | 85.2 |
| Elwood: | 112.3 |

The City-Data.com crime index weighs serious crimes and violent crimes more heavily. Higher means more crime, U.S. average is 246.1. It adjusts for the number of visitors and daily workers commuting into cities.
- means the value is smaller than the state average.- means the value is about the same as the state average.
- means the value is bigger than the state average.
- means the value is much bigger than the state average.
According to our research of Illinois and other state lists, there were 261 registered sex offenders living in Joliet, Illinois as of May 18, 2024.
The ratio of all residents to sex offenders in Joliet is 561 to 1.
Violent crime rate in 2022
| Joliet: | 284.6 |
| U.S. Average: | 219.8 |
Violent crime rate in 2021
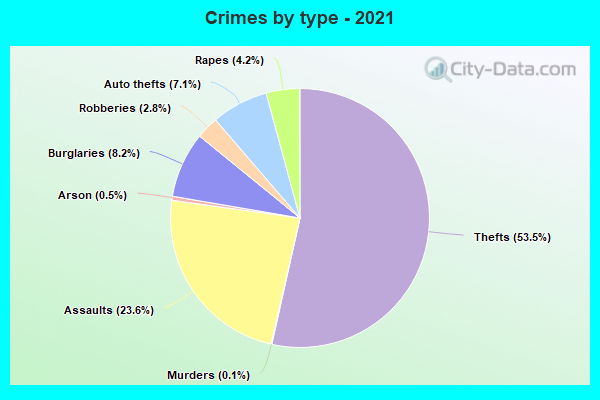
| Joliet: | 99.6 |
| U.S. Average: | 224.8 |
Violent crime rate in 2020
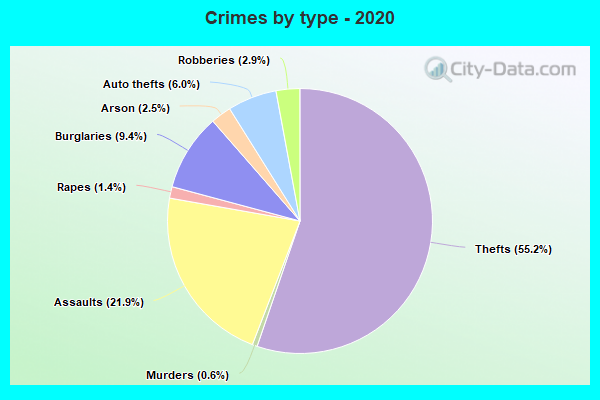
| Joliet: | 208.4 |
| U.S. Average: | 228.2 |
Violent crime rate in 2019
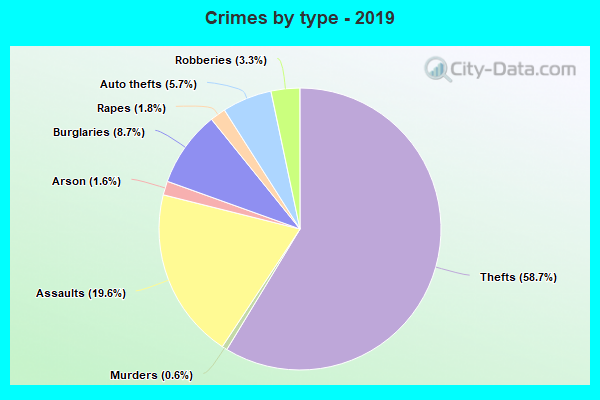
| Joliet: | 288.2 |
| U.S. Average: | 219.9 |
Violent crime rate in 2018
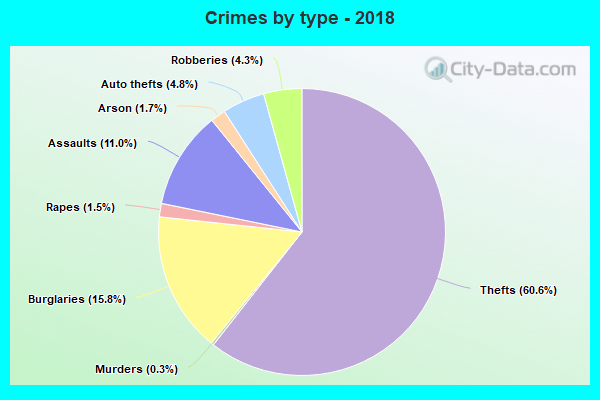
| Joliet: | 186.5 |
| U.S. Average: | 221.2 |
Violent crime rate in 2017
| Joliet: | 219.8 |
| U.S. Average: | 226.2 |
Violent crime rate in 2016
| Joliet: | 192.4 |
| U.S. Average: | 227.3 |
Violent crime rate in 2015
| Joliet: | 180.8 |
| U.S. Average: | 219.3 |
Violent crime rate in 2014
| Joliet: | 183.6 |
| U.S. Average: | 211.1 |
Violent crime rate in 2013
| Joliet: | 214.2 |
| U.S. Average: | 214.2 |
Violent crime rate in 2012
| Joliet: | 191.6 |
| U.S. Average: | 187.4 |
Violent crime rate in 2011
| Joliet: | 193.1 |
| U.S. Average: | 187.1 |
Violent crime rate in 2010
| Joliet: | 205.9 |
| U.S. Average: | 195.7 |
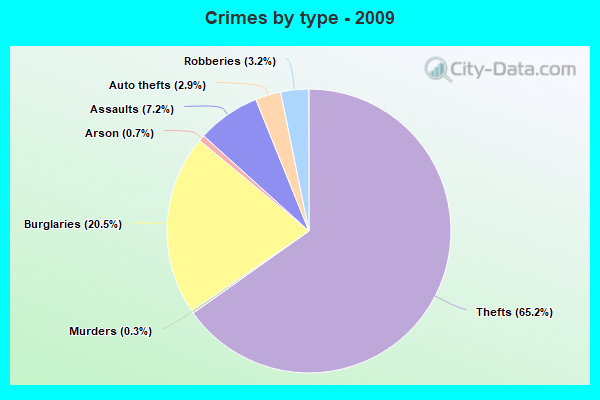
Violent crime rate in 2009
| Joliet: | 167.4 |
| U.S. Average: | 208.9 |
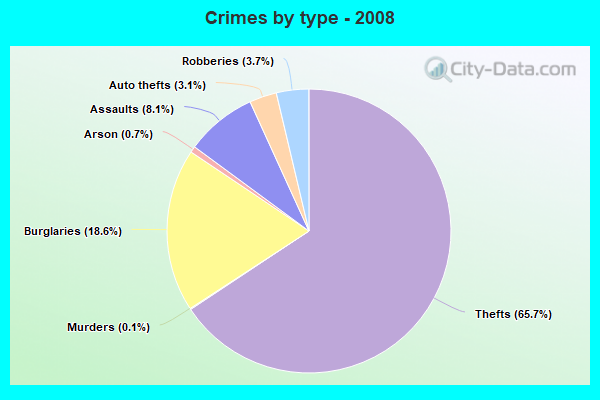
Violent crime rate in 2008
| Joliet: | 185.5 |
| U.S. Average: | 222.5 |
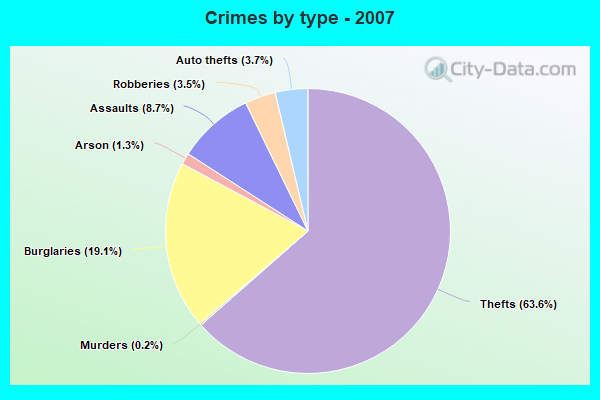
Violent crime rate in 2007
| Joliet: | 176.8 |
| U.S. Average: | 229.1 |
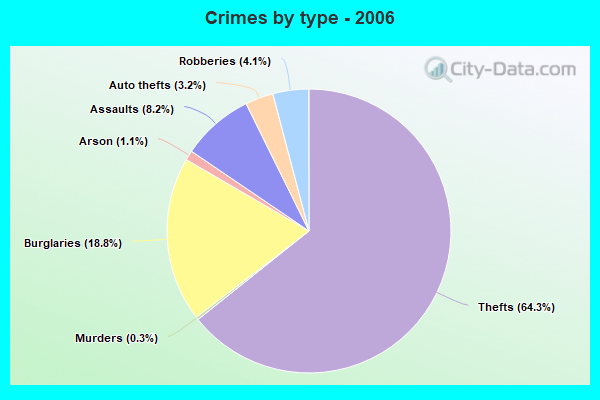
Violent crime rate in 2006
| Joliet: | 203.5 |
| U.S. Average: | 232.6 |
Violent crime rate in 2005
| Joliet: | 168.4 |
| U.S. Average: | 227.0 |
Property crime rate in 2022
| Joliet: | 79.2 |
| U.S. Average: | 166.5 |
Property crime rate in 2021
| Joliet: | 30.4 |
| U.S. Average: | 157.8 |
Property crime rate in 2020
| Joliet: | 76.6 |
| U.S. Average: | 169.6 |
Property crime rate in 2019
| Joliet: | 110.2 |
| U.S. Average: | 179.7 |
Property crime rate in 2018
| Joliet: | 132.4 |
| U.S. Average: | 190.2 |
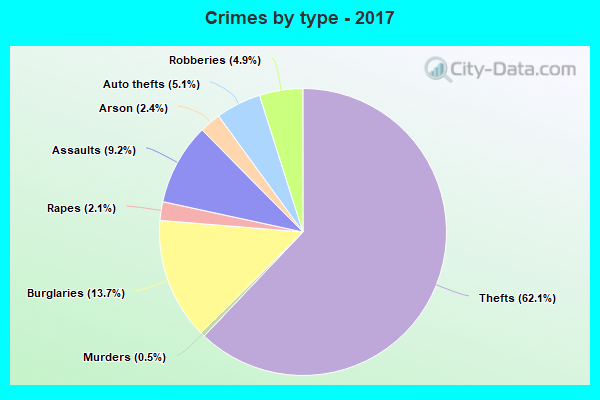
Property crime rate in 2017
| Joliet: | 144.7 |
| U.S. Average: | 206.4 |
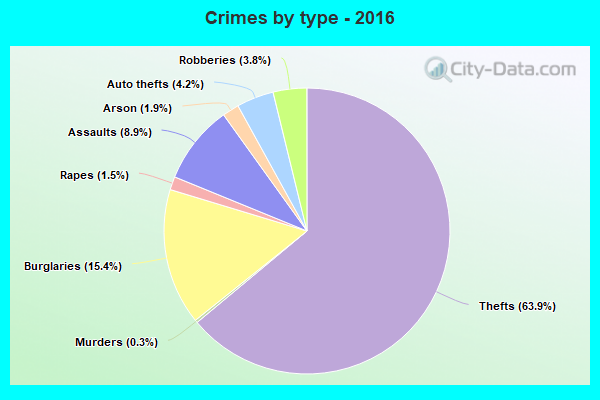
Property crime rate in 2016
| Joliet: | 156.7 |
| U.S. Average: | 216.6 |
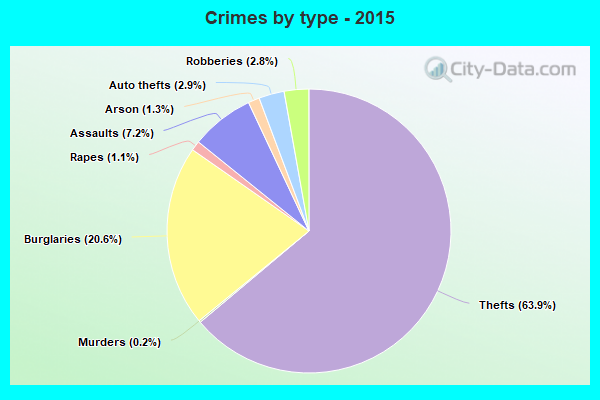
Property crime rate in 2015
| Joliet: | 213.0 |
| U.S. Average: | 221.5 |
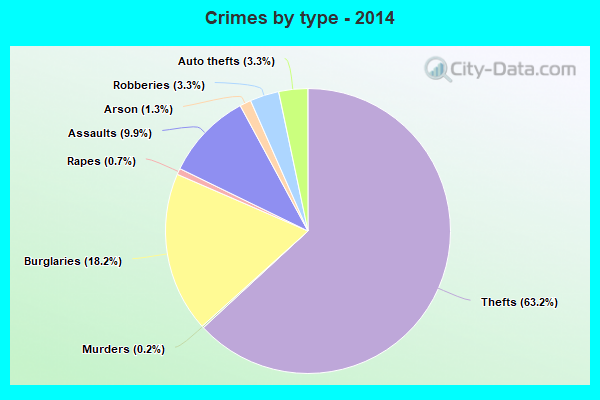
Property crime rate in 2014
| Joliet: | 174.0 |
| U.S. Average: | 230.8 |
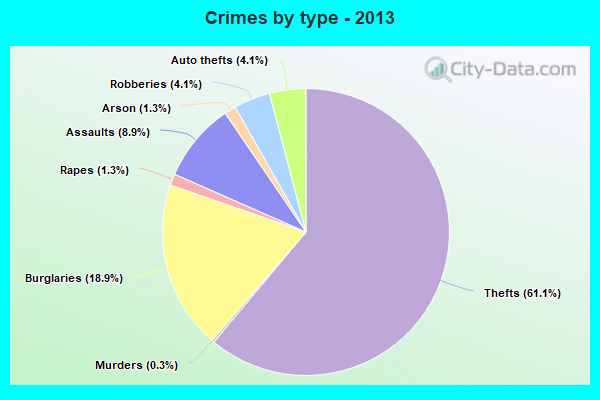
Property crime rate in 2013
| Joliet: | 192.0 |
| U.S. Average: | 250.4 |
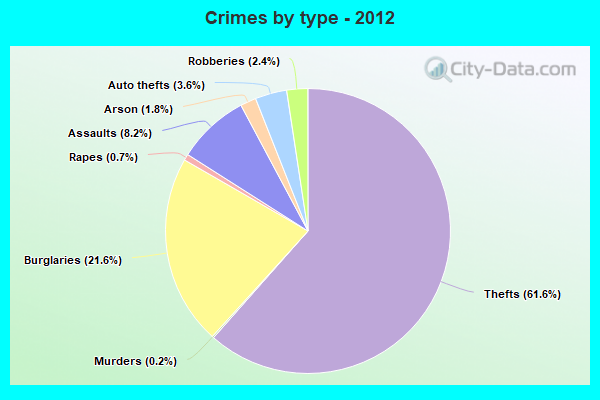
Property crime rate in 2012
| Joliet: | 236.2 |
| U.S. Average: | 267.3 |
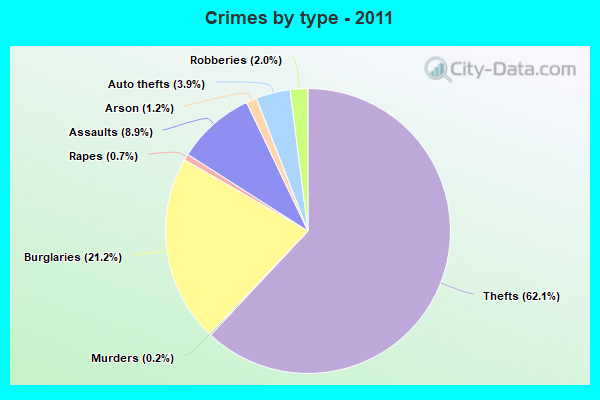
Property crime rate in 2011
| Joliet: | 237.4 |
| U.S. Average: | 273.5 |
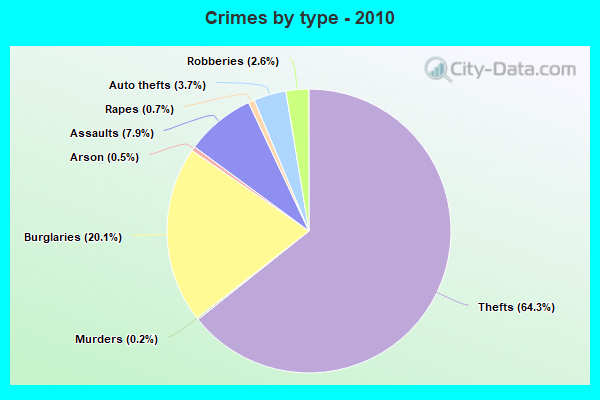
Property crime rate in 2010
| Joliet: | 251.3 |
| U.S. Average: | 276.4 |
Property crime rate in 2009
| Joliet: | 225.9 |
| U.S. Average: | 285.6 |
Property crime rate in 2008
| Joliet: | 226.8 |
| U.S. Average: | 302.2 |
Property crime rate in 2007
| Joliet: | 207.0 |
| U.S. Average: | 309.2 |
Property crime rate in 2006
| Joliet: | 224.6 |
| U.S. Average: | 317.3 |
Property crime rate in 2005
| Joliet: | 230.1 |
| U.S. Average: | 322.3 |
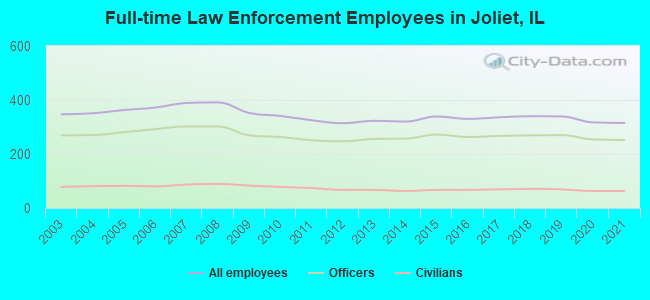
Full-time law enforcement employees in 2021, including police officers: 315 (252 officers - 220 male; 32 female).
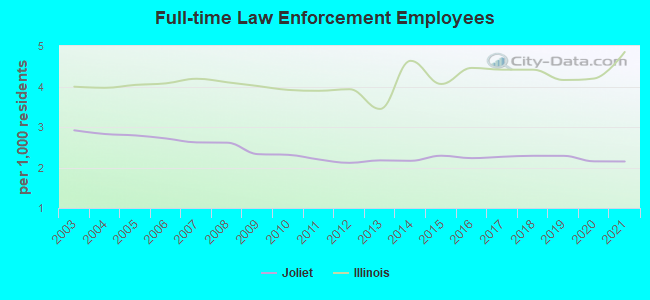
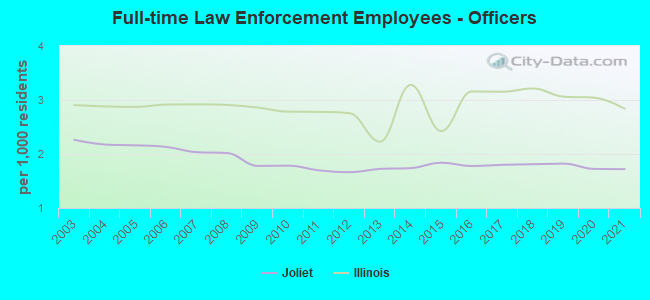
| Officers per 1,000 residents here: | 1.72 |
| Illinois average: | 2.84 |
Full-time law enforcement employees in 2020, including police officers: 317 (254 officers - 226 male; 28 female).
| Officers per 1,000 residents here: | 1.72 |
| Illinois average: | 3.04 |
Full-time law enforcement employees in 2019, including police officers: 339 (270 officers - 243 male; 27 female).
| Officers per 1,000 residents here: | 1.82 |
| Illinois average: | 3.06 |
Full-time law enforcement employees in 2018, including police officers: 340 (269 officers - 243 male; 26 female).
| Officers per 1,000 residents here: | 1.81 |
| Illinois average: | 3.21 |
Full-time law enforcement employees in 2017, including police officers: 336 (267 officers - 244 male; 23 female).
| Officers per 1,000 residents here: | 1.80 |
| Illinois average: | 3.15 |
Full-time law enforcement employees in 2016, including police officers: 330 (263 officers - 240 male; 23 female).
| Officers per 1,000 residents here: | 1.78 |
| Illinois average: | 3.16 |
Full-time law enforcement employees in 2015, including police officers: 339 (272 officers - 249 male; 23 female).
| Officers per 1,000 residents here: | 1.84 |
| Illinois average: | 2.42 |
Full-time law enforcement employees in 2014, including police officers: 320 (257 officers - 236 male; 21 female).
| Officers per 1,000 residents here: | 1.74 |
| Illinois average: | 3.28 |
Full-time law enforcement employees in 2013, including police officers: 323 (256 officers - 236 male; 20 female).
| Officers per 1,000 residents here: | 1.72 |
| Illinois average: | 2.23 |
Full-time law enforcement employees in 2012, including police officers: 314 (247 officers - 229 male; 18 female).
| Officers per 1,000 residents here: | 1.66 |
| Illinois average: | 2.76 |
Full-time law enforcement employees in 2011, including police officers: 325 (251 officers - 233 male; 18 female).
| Officers per 1,000 residents here: | 1.70 |
| Illinois average: | 2.78 |
Full-time law enforcement employees in 2010, including police officers: 341 (263 officers - 245 male; 18 female).
| Officers per 1,000 residents here: | 1.78 |
| Illinois average: | 2.78 |
Full-time law enforcement employees in 2009, including police officers: 352 (269 officers - 251 male; 18 female).
| Officers per 1,000 residents here: | 1.78 |
| Illinois average: | 2.86 |
Full-time law enforcement employees in 2008, including police officers: 391 (302 officers - 281 male; 21 female).
| Officers per 1,000 residents here: | 2.02 |
| Illinois average: | 2.91 |
Full-time law enforcement employees in 2007, including police officers: 389 (302 officers - 281 male; 21 female).
| Officers per 1,000 residents here: | 2.03 |
| Illinois average: | 2.92 |
Full-time law enforcement employees in 2006, including police officers: 372 (292 officers - 272 male; 20 female).
| Officers per 1,000 residents here: | 2.13 |
| Illinois average: | 2.92 |
Full-time law enforcement employees in 2005, including police officers: 363 (281 officers - 261 male; 20 female).
| Officers per 1,000 residents here: | 2.16 |
| Illinois average: | 2.87 |
Full-time law enforcement employees in 2004, including police officers: 351 (270 officers - 256 male; 14 female).
| Officers per 1,000 residents here: | 2.17 |
| Illinois average: | 2.88 |
Full-time law enforcement employees in 2003, including police officers: 347 (269 officers - 258 male; 11 female).
| Officers per 1,000 residents here: | 2.26 |
| Illinois average: | 2.90 |