Crime rate in Killeen, Texas (TX): murders, rapes, robberies, assaults, burglaries, thefts, auto thefts, arson, law enforcement employees, police officers, crime map
Crime rate in Killeen, TX
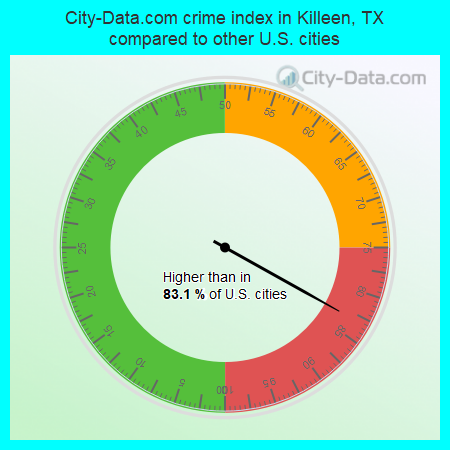
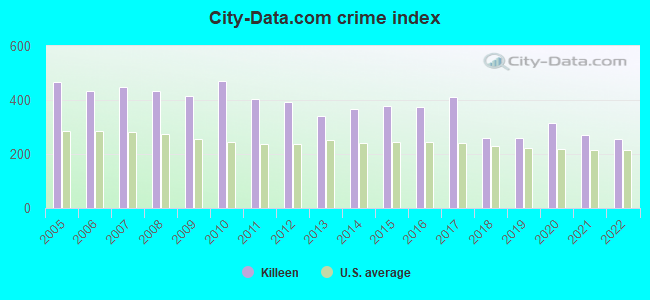
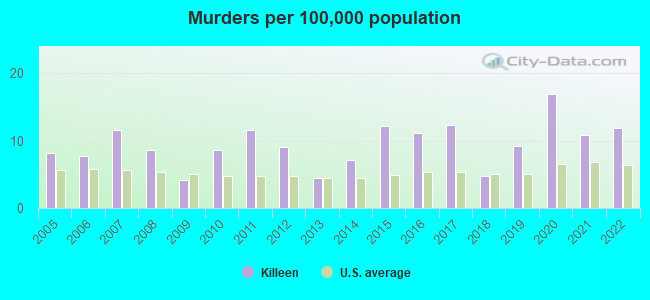
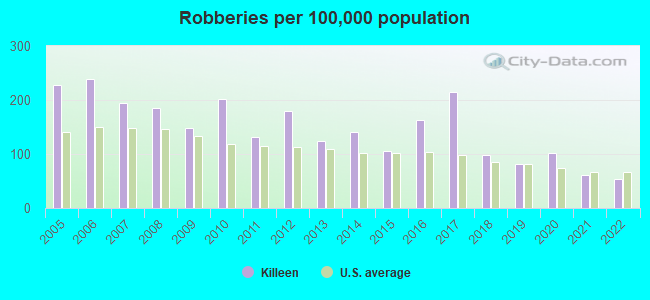
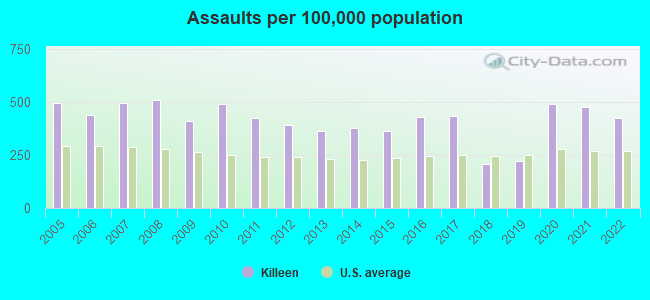
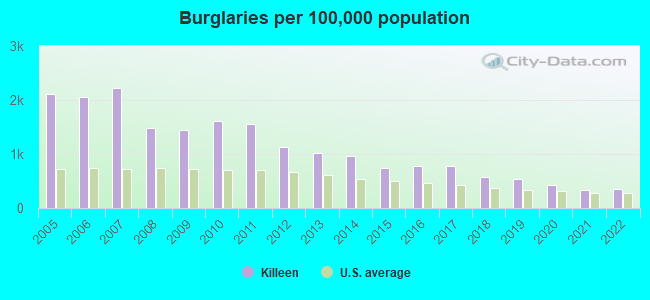
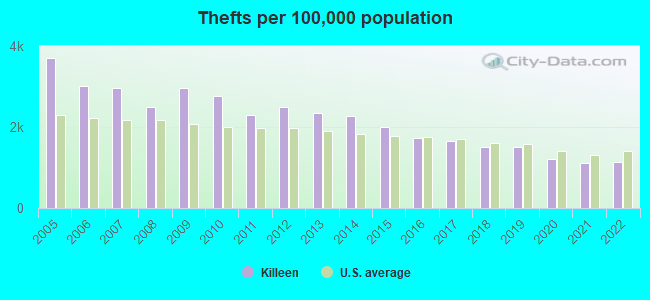
The 2022 crime rate in Killeen, TX is 256 (City-Data.com crime index), which is comparable to the U.S. average. It was higher than in 83.1% U.S. cities. The 2022 Killeen crime rate fell by 6% compared to 2021. The number of homicides stood at 19 - an increase of 2 compared to 2021. In the last 5 years Killeen has seen increasing violent crime and decreasing property crime.See how dangerous Killeen, TX is compared to the nearest cities:
(Note: Higher means more crime)
(Note: Higher means more crime)
| Killeen: | 255.7 |
| Harker Heights: | 162.8 |
| Nolanville: | 109.1 |
| Copperas Cove: | 213.0 |
| Salado: | 74.3 |
| Belton: | 183.8 |
| Morgan's Point Resort: | 41.8 |
| Florence: | 44.3 |
| Temple: | 222.2 |
The City-Data.com crime index weighs serious crimes and violent crimes more heavily. Higher means more crime, U.S. average is 246.1. It adjusts for the number of visitors and daily workers commuting into cities.
- means the value is smaller than the state average.- means the value is about the same as the state average.
- means the value is bigger than the state average.
- means the value is much bigger than the state average.
According to our research of Texas and other state lists, there were 363 registered sex offenders living in Killeen, Texas as of May 17, 2024.
The ratio of all residents to sex offenders in Killeen is 395 to 1.
The ratio of registered sex offenders to all residents in this city is near the state average.
Violent crime rate in 2022
| Killeen: | 313.4 |
| U.S. Average: | 219.8 |
Violent crime rate in 2021
| Killeen: | 349.3 |
| U.S. Average: | 224.8 |
Violent crime rate in 2020
| Killeen: | 393.4 |
| U.S. Average: | 228.2 |
Violent crime rate in 2019
| Killeen: | 240.4 |
| U.S. Average: | 219.9 |
Violent crime rate in 2018
| Killeen: | 241.5 |
| U.S. Average: | 221.2 |
Violent crime rate in 2017
| Killeen: | 453.4 |
| U.S. Average: | 226.2 |
Violent crime rate in 2016
| Killeen: | 409.4 |
| U.S. Average: | 227.3 |
Violent crime rate in 2015
| Killeen: | 394.7 |
| U.S. Average: | 219.3 |
Violent crime rate in 2014
| Killeen: | 355.6 |
| U.S. Average: | 211.1 |
Violent crime rate in 2013
| Killeen: | 310.9 |
| U.S. Average: | 214.2 |
Violent crime rate in 2012
| Killeen: | 367.1 |
| U.S. Average: | 187.4 |
Violent crime rate in 2011
| Killeen: | 355.6 |
| U.S. Average: | 187.1 |
Violent crime rate in 2010
| Killeen: | 436.6 |
| U.S. Average: | 195.7 |
Violent crime rate in 2009
| Killeen: | 345.6 |
| U.S. Average: | 208.9 |
Violent crime rate in 2008
| Killeen: | 423.2 |
| U.S. Average: | 222.5 |
Violent crime rate in 2007
| Killeen: | 371.9 |
| U.S. Average: | 229.1 |
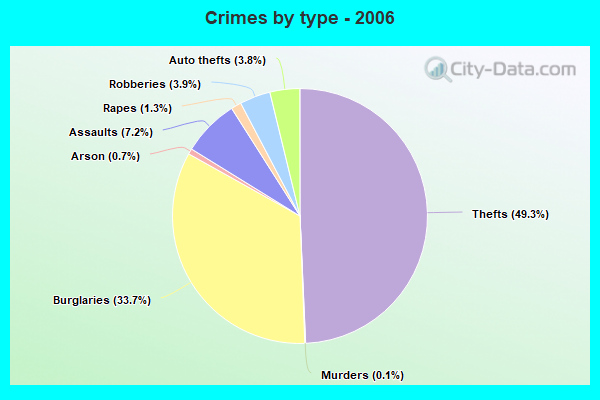
Violent crime rate in 2006
| Killeen: | 359.4 |
| U.S. Average: | 232.6 |
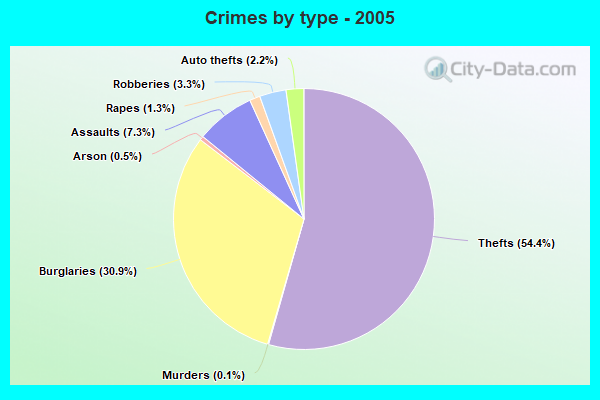
Violent crime rate in 2005
| Killeen: | 385.6 |
| U.S. Average: | 227.0 |
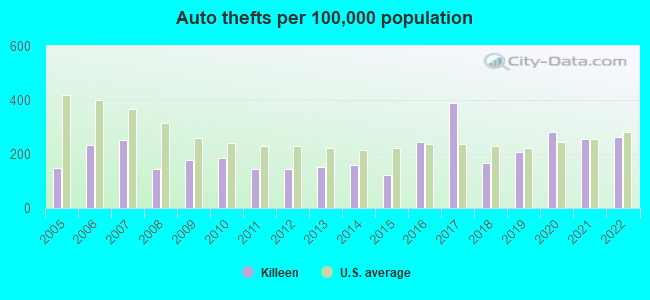
Property crime rate in 2022
| Killeen: | 166.3 |
| U.S. Average: | 166.5 |
Property crime rate in 2021
| Killeen: | 162.2 |
| U.S. Average: | 157.8 |
Property crime rate in 2020
| Killeen: | 187.9 |
| U.S. Average: | 169.6 |
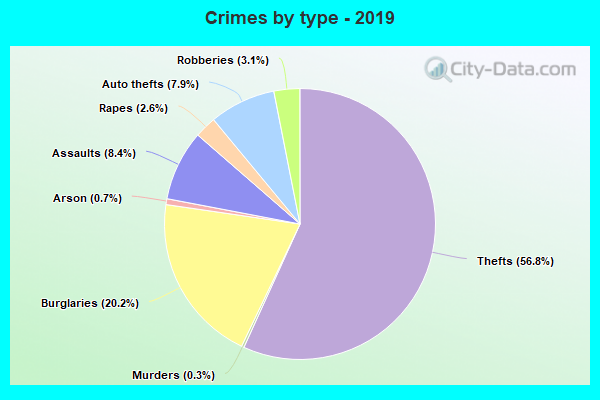
Property crime rate in 2019
| Killeen: | 214.8 |
| U.S. Average: | 179.7 |
Property crime rate in 2018
| Killeen: | 216.1 |
| U.S. Average: | 190.2 |
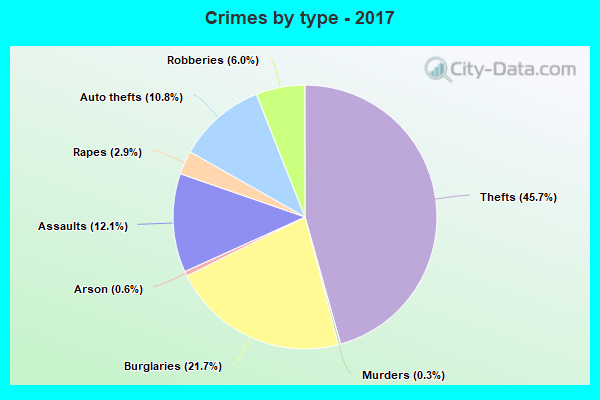
Property crime rate in 2017
| Killeen: | 296.8 |
| U.S. Average: | 206.4 |
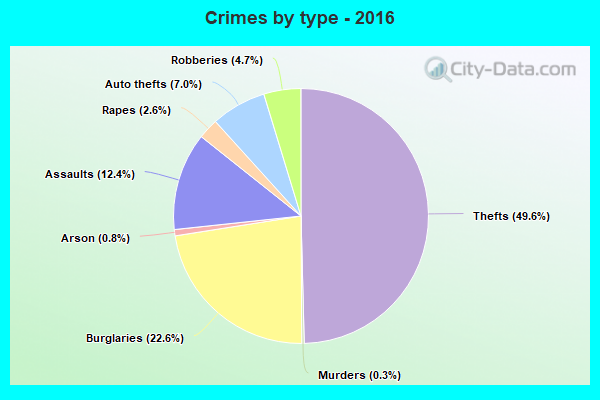
Property crime rate in 2016
| Killeen: | 279.9 |
| U.S. Average: | 216.6 |
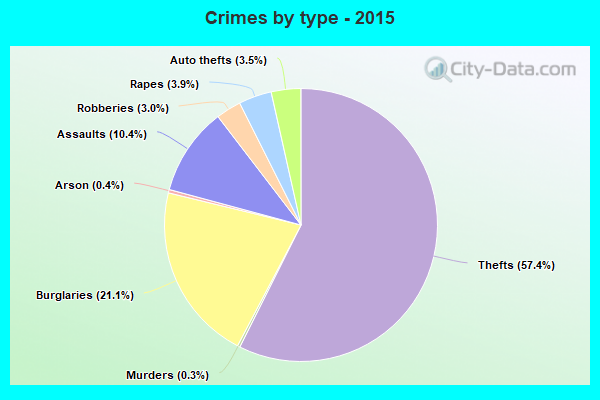
Property crime rate in 2015
| Killeen: | 266.9 |
| U.S. Average: | 221.5 |
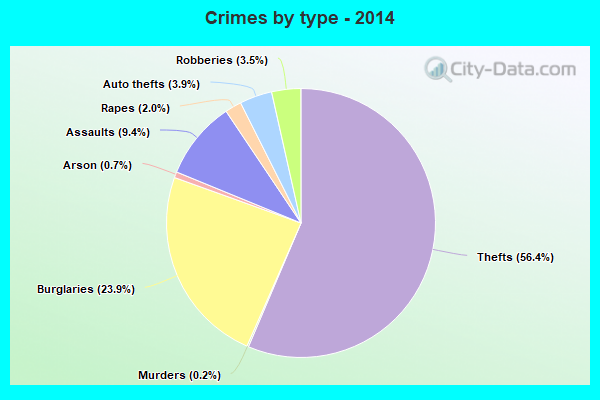
Property crime rate in 2014
| Killeen: | 328.5 |
| U.S. Average: | 230.8 |
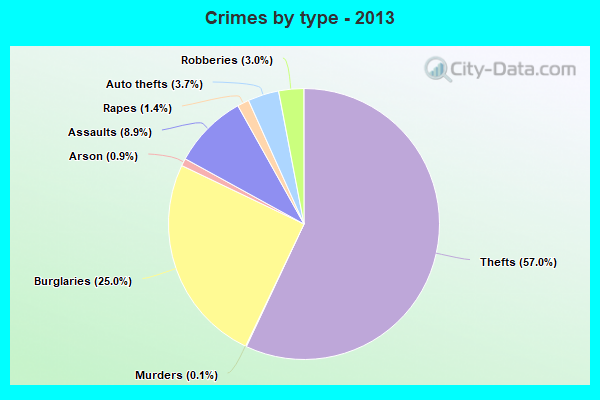
Property crime rate in 2013
| Killeen: | 343.9 |
| U.S. Average: | 250.4 |
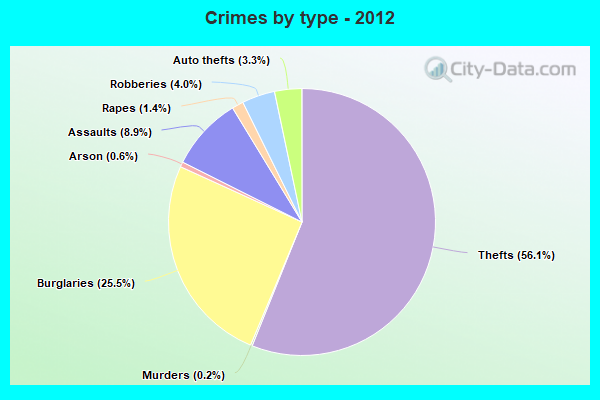
Property crime rate in 2012
| Killeen: | 373.7 |
| U.S. Average: | 267.3 |
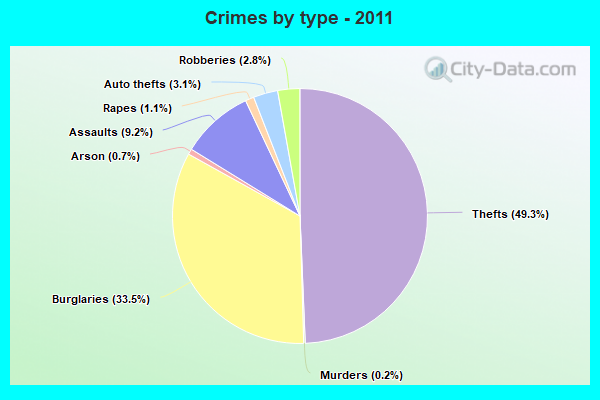
Property crime rate in 2011
| Killeen: | 447.4 |
| U.S. Average: | 273.5 |
Property crime rate in 2010
| Killeen: | 488.6 |
| U.S. Average: | 276.4 |
Property crime rate in 2009
| Killeen: | 461.7 |
| U.S. Average: | 285.6 |
Property crime rate in 2008
| Killeen: | 441.2 |
| U.S. Average: | 302.2 |
Property crime rate in 2007
| Killeen: | 524.7 |
| U.S. Average: | 309.2 |
Property crime rate in 2006
| Killeen: | 496.3 |
| U.S. Average: | 317.3 |
Property crime rate in 2005
| Killeen: | 521.3 |
| U.S. Average: | 322.3 |

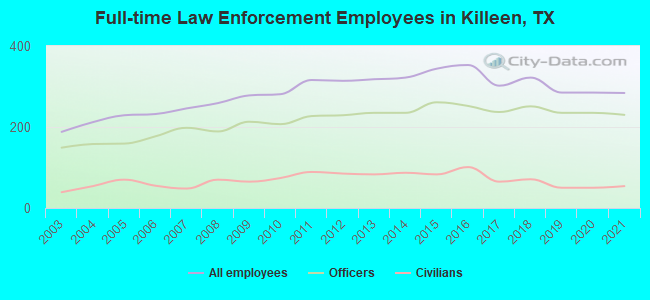
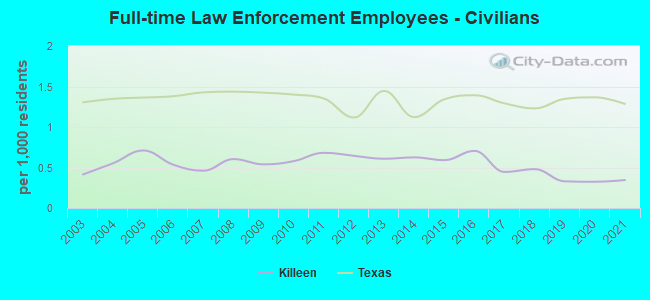
Full-time law enforcement employees in 2021, including police officers: 284 (230 officers - 194 male; 36 female).
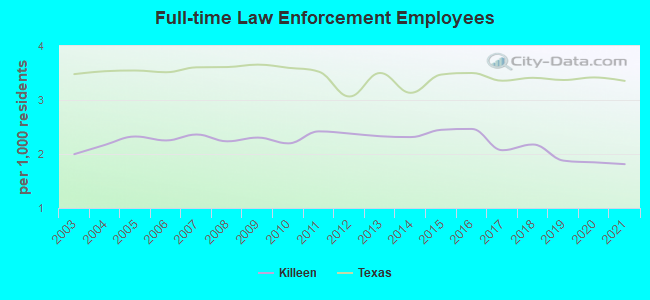
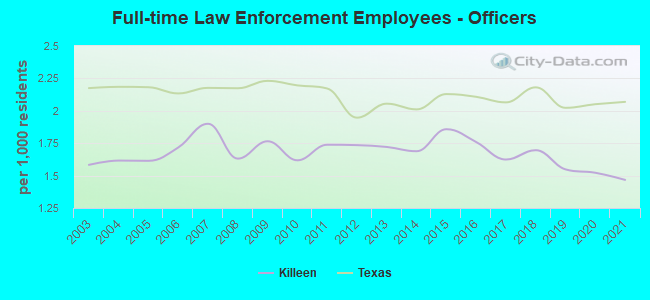
| Officers per 1,000 residents here: | 1.47 |
| Texas average: | 2.07 |
Full-time law enforcement employees in 2020, including police officers: 285 (235 officers - 196 male; 39 female).
| Officers per 1,000 residents here: | 1.52 |
| Texas average: | 2.05 |
Full-time law enforcement employees in 2019, including police officers: 285 (235 officers - 196 male; 39 female).
| Officers per 1,000 residents here: | 1.55 |
| Texas average: | 2.02 |
Full-time law enforcement employees in 2018, including police officers: 322 (251 officers - 210 male; 41 female).
| Officers per 1,000 residents here: | 1.70 |
| Texas average: | 2.18 |
Full-time law enforcement employees in 2017, including police officers: 302 (237 officers - 196 male; 41 female).
| Officers per 1,000 residents here: | 1.62 |
| Texas average: | 2.06 |
Full-time law enforcement employees in 2016, including police officers: 353 (252 officers - 209 male; 43 female).
| Officers per 1,000 residents here: | 1.76 |
| Texas average: | 2.11 |
Full-time law enforcement employees in 2015, including police officers: 344 (261 officers - 219 male; 42 female).
| Officers per 1,000 residents here: | 1.86 |
| Texas average: | 2.13 |
Full-time law enforcement employees in 2014, including police officers: 322 (235 officers - 194 male; 41 female).
| Officers per 1,000 residents here: | 1.69 |
| Texas average: | 2.01 |
Full-time law enforcement employees in 2013, including police officers: 318 (235 officers - 198 male; 37 female).
| Officers per 1,000 residents here: | 1.72 |
| Texas average: | 2.05 |
Full-time law enforcement employees in 2012, including police officers: 314 (229 officers - 192 male; 37 female).
| Officers per 1,000 residents here: | 1.74 |
| Texas average: | 1.95 |
Full-time law enforcement employees in 2011, including police officers: 316 (227 officers - 189 male; 38 female).
| Officers per 1,000 residents here: | 1.74 |
| Texas average: | 2.17 |
Full-time law enforcement employees in 2010, including police officers: 281 (207 officers - 176 male; 31 female).
| Officers per 1,000 residents here: | 1.62 |
| Texas average: | 2.20 |
Full-time law enforcement employees in 2009, including police officers: 278 (213 officers - 184 male; 29 female).
| Officers per 1,000 residents here: | 1.77 |
| Texas average: | 2.23 |
Full-time law enforcement employees in 2008, including police officers: 259 (189 officers - 156 male; 33 female).
| Officers per 1,000 residents here: | 1.63 |
| Texas average: | 2.17 |
Full-time law enforcement employees in 2007, including police officers: 246 (198 officers - 165 male; 33 female).
| Officers per 1,000 residents here: | 1.90 |
| Texas average: | 2.18 |
Full-time law enforcement employees in 2006, including police officers: 232 (177 officers - 148 male; 29 female).
| Officers per 1,000 residents here: | 1.72 |
| Texas average: | 2.13 |
Full-time law enforcement employees in 2005, including police officers: 229 (159 officers - 136 male; 23 female).
| Officers per 1,000 residents here: | 1.61 |
| Texas average: | 2.18 |
Full-time law enforcement employees in 2004, including police officers: 212 (158 officers - 135 male; 23 female).
| Officers per 1,000 residents here: | 1.62 |
| Texas average: | 2.19 |
Full-time law enforcement employees in 2003, including police officers: 188 (149 officers - 122 male; 27 female).
| Officers per 1,000 residents here: | 1.58 |
| Texas average: | 2.17 |

Zip codes: 76541.