Crime rate in Lafayette, Louisiana (LA): murders, rapes, robberies, assaults, burglaries, thefts, auto thefts, arson, law enforcement employees, police officers, crime map
Crime rate in Lafayette, LA
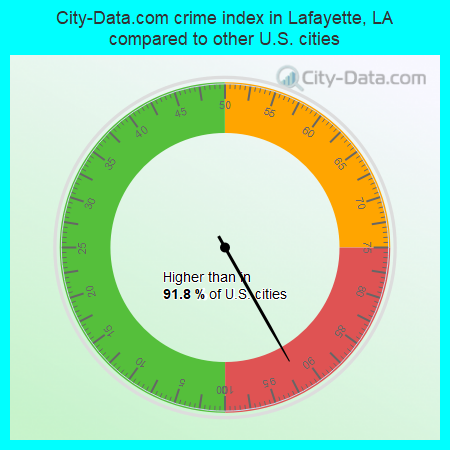
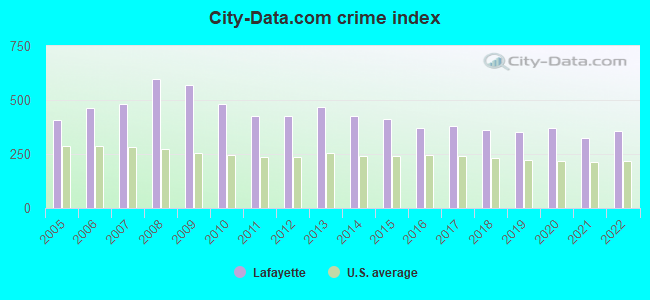
The 2022 crime rate in Lafayette, LA is 355 (City-Data.com crime index), which is 1.4 times higher than the U.S. average. It was higher than in 91.8% U.S. cities. The 2022 Lafayette crime rate rose by 9% compared to 2021. The number of homicides stood at 22 - a decrease of 1 compared to 2021. In the last 5 years Lafayette has seen decreasing violent crime and decreasing property crime.See how dangerous Lafayette, LA is compared to the nearest cities:
(Note: Higher means more crime)
(Note: Higher means more crime)
| Lafayette: | 355.1 |
| Scott: | 167.7 |
| Broussard: | 204.0 |
| Carencro: | 139.6 |
| Youngsville: | 123.0 |
| Breaux Bridge: | 404.1 |
| St. Martinville: | 88.9 |
| Arnaudville: | 78.1 |
| Rayne: | 47.2 |
The City-Data.com crime index weighs serious crimes and violent crimes more heavily. Higher means more crime, U.S. average is 246.1. It adjusts for the number of visitors and daily workers commuting into cities.
- means the value is smaller than the state average.- means the value is about the same as the state average.
- means the value is bigger than the state average.
- means the value is much bigger than the state average.
According to our research of Louisiana and other state lists, there were 193 registered sex offenders living in Lafayette, Louisiana as of May 22, 2024.
The ratio of all residents to sex offenders in Lafayette is 657 to 1.
The ratio of registered sex offenders to all residents in this city is lower than the state average.
Violent crime rate in 2022
| Lafayette: | 274.0 |
| U.S. Average: | 219.8 |
Violent crime rate in 2021
| Lafayette: | 276.7 |
| U.S. Average: | 224.8 |
Violent crime rate in 2020
| Lafayette: | 304.3 |
| U.S. Average: | 228.2 |
Violent crime rate in 2019
| Lafayette: | 284.9 |
| U.S. Average: | 219.9 |
Violent crime rate in 2018
| Lafayette: | 285.7 |
| U.S. Average: | 221.2 |
Violent crime rate in 2017
| Lafayette: | 313.9 |
| U.S. Average: | 226.2 |
Violent crime rate in 2016
| Lafayette: | 268.8 |
| U.S. Average: | 227.3 |
Violent crime rate in 2015
| Lafayette: | 309.6 |
| U.S. Average: | 219.3 |
Violent crime rate in 2014
| Lafayette: | 337.7 |
| U.S. Average: | 211.1 |
Violent crime rate in 2013
| Lafayette: | 368.3 |
| U.S. Average: | 214.2 |
Violent crime rate in 2012
| Lafayette: | 335.0 |
| U.S. Average: | 187.4 |
Violent crime rate in 2011
| Lafayette: | 359.8 |
| U.S. Average: | 187.1 |
Violent crime rate in 2010
| Lafayette: | 412.9 |
| U.S. Average: | 195.7 |
Violent crime rate in 2009
| Lafayette: | 519.0 |
| U.S. Average: | 208.9 |
Violent crime rate in 2008
| Lafayette: | 606.0 |
| U.S. Average: | 222.5 |
Violent crime rate in 2007
| Lafayette: | 478.8 |
| U.S. Average: | 229.1 |
Violent crime rate in 2006
| Lafayette: | 456.0 |
| U.S. Average: | 232.6 |
Violent crime rate in 2005
| Lafayette: | 383.5 |
| U.S. Average: | 227.0 |
Property crime rate in 2022
| Lafayette: | 353.8 |
| U.S. Average: | 166.5 |
Property crime rate in 2021
| Lafayette: | 324.4 |
| U.S. Average: | 157.8 |
Property crime rate in 2020
| Lafayette: | 384.8 |
| U.S. Average: | 169.6 |
Property crime rate in 2019
| Lafayette: | 362.8 |
| U.S. Average: | 179.7 |
Property crime rate in 2018
| Lafayette: | 379.9 |
| U.S. Average: | 190.2 |
Property crime rate in 2017
| Lafayette: | 368.7 |
| U.S. Average: | 206.4 |
Property crime rate in 2016
| Lafayette: | 397.5 |
| U.S. Average: | 216.6 |
Property crime rate in 2015
| Lafayette: | 416.5 |
| U.S. Average: | 221.5 |
Property crime rate in 2014
| Lafayette: | 446.4 |
| U.S. Average: | 230.8 |
Property crime rate in 2013
| Lafayette: | 485.8 |
| U.S. Average: | 250.4 |
Property crime rate in 2012
| Lafayette: | 459.4 |
| U.S. Average: | 267.3 |
Property crime rate in 2011
| Lafayette: | 437.3 |
| U.S. Average: | 273.5 |
Property crime rate in 2010
| Lafayette: | 491.8 |
| U.S. Average: | 276.4 |
Property crime rate in 2009
| Lafayette: | 550.5 |
| U.S. Average: | 285.6 |
Property crime rate in 2008
| Lafayette: | 529.2 |
| U.S. Average: | 302.2 |
Property crime rate in 2007
| Lafayette: | 424.3 |
| U.S. Average: | 309.2 |
Property crime rate in 2006
| Lafayette: | 415.4 |
| U.S. Average: | 317.3 |
Property crime rate in 2005
| Lafayette: | 377.1 |
| U.S. Average: | 322.3 |


Full-time law enforcement employees in 2020, including police officers: 327 (275 officers - 233 male; 42 female).
| Officers per 1,000 residents here: | 2.17 |
| Louisiana average: | 3.56 |
Full-time law enforcement employees in 2019, including police officers: 334 (280 officers - 239 male; 41 female).
| Officers per 1,000 residents here: | 2.21 |
| Louisiana average: | 3.51 |
Full-time law enforcement employees in 2018, including police officers: 332 (283 officers - 245 male; 38 female).
| Officers per 1,000 residents here: | 2.22 |
| Louisiana average: | 3.31 |
Full-time law enforcement employees in 2017, including police officers: 321 (264 officers - 235 male; 29 female).
| Officers per 1,000 residents here: | 2.05 |
| Louisiana average: | 3.46 |
Full-time law enforcement employees in 2016, including police officers: 315 (257 officers - 232 male; 25 female).
| Officers per 1,000 residents here: | 1.99 |
| Louisiana average: | 3.36 |
Full-time law enforcement employees in 2015, including police officers: 307 (251 officers - 225 male; 26 female).
| Officers per 1,000 residents here: | 1.97 |
| Louisiana average: | 3.50 |
Full-time law enforcement employees in 2014, including police officers: 307 (251 officers - 225 male; 26 female).
| Officers per 1,000 residents here: | 2.01 |
| Louisiana average: | 3.56 |
Full-time law enforcement employees in 2012, including police officers: 305 (245 officers - 227 male; 18 female).
| Officers per 1,000 residents here: | 1.99 |
| Louisiana average: | 3.98 |
Full-time law enforcement employees in 2011, including police officers: 313 (257 officers - 236 male; 21 female).
| Officers per 1,000 residents here: | 2.11 |
| Louisiana average: | 3.89 |
Full-time law enforcement employees in 2010, including police officers: 321 (259 officers - 238 male; 21 female).
| Officers per 1,000 residents here: | 2.15 |
| Louisiana average: | 4.05 |
Full-time law enforcement employees in 2009, including police officers: 308 (253 officers - 230 male; 23 female).
| Officers per 1,000 residents here: | 2.22 |
| Louisiana average: | 4.04 |
Full-time law enforcement employees in 2008, including police officers: 305 (246 officers - 224 male; 22 female).
| Officers per 1,000 residents here: | 2.16 |
| Louisiana average: | 4.05 |
Full-time law enforcement employees in 2007, including police officers: 291 (225 officers - 205 male; 20 female).
| Officers per 1,000 residents here: | 1.97 |
| Louisiana average: | 3.82 |
Full-time law enforcement employees in 2006, including police officers: 289 (228 officers - 207 male; 21 female).
| Officers per 1,000 residents here: | 2.15 |
| Louisiana average: | 3.97 |
Full-time law enforcement employees in 2005, including police officers: 300 (228 officers - 208 male; 20 female).
| Officers per 1,000 residents here: | 2.03 |
| Louisiana average: | 3.67 |
Full-time law enforcement employees in 2004, including police officers: 298 (243 officers - 227 male; 16 female).
| Officers per 1,000 residents here: | 2.17 |
| Louisiana average: | 3.87 |
Full-time law enforcement employees in 2003, including police officers: 297 (233 officers - 216 male; 17 female).
| Officers per 1,000 residents here: | 2.09 |
| Louisiana average: | 3.79 |


