Crime rate in Las Cruces, New Mexico (NM): murders, rapes, robberies, assaults, burglaries, thefts, auto thefts, arson, law enforcement employees, police officers, crime map
Crime rate in Las Cruces, NM
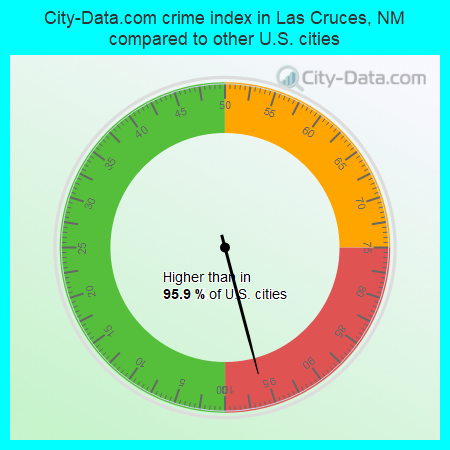
The 2022 crime rate in Las Cruces, NM is 462 (City-Data.com crime index), which is 1.9 times greater than the U.S. average. It was higher than in 95.9% U.S. cities. The 2022 Las Cruces crime rate rose by 12% compared to 2021. The number of homicides stood at 10 - an increase of 2 compared to 2021. In the last 5 years Las Cruces has seen increasing violent crime and increasing property crime.See how dangerous Las Cruces, NM is compared to the nearest cities:
(Note: Higher means more crime)
(Note: Higher means more crime)
| Las Cruces: | 462.3 |
| Mesilla: | 118.0 |
| Anthony: | 75.2 |
| Anthony: | 144.7 |
| Hatch: | 76.6 |
| Sunland Park: | 149.2 |
| El Paso: | 166.2 |
| Socorro: | 135.1 |
| Horizon City: | 80.2 |
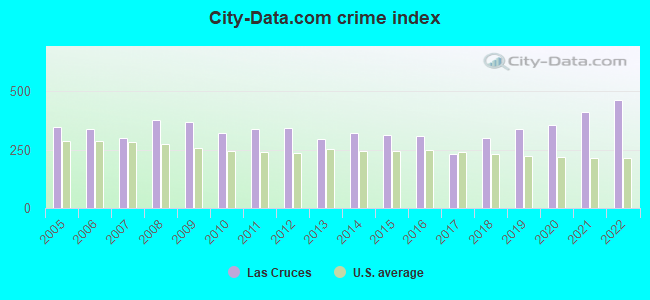
The City-Data.com crime index weighs serious crimes and violent crimes more heavily. Higher means more crime, U.S. average is 246.1. It adjusts for the number of visitors and daily workers commuting into cities.
- means the value is smaller than the state average.- means the value is about the same as the state average.
- means the value is bigger than the state average.
- means the value is much bigger than the state average.
According to our research of New Mexico and other state lists, there were 192 registered sex offenders living in Las Cruces, New Mexico as of May 29, 2024.
The ratio of all residents to sex offenders in Las Cruces is 530 to 1.
Violent crime rate in 2022
| Las Cruces: | 354.5 |
| U.S. Average: | 219.8 |
Violent crime rate in 2021
| Las Cruces: | 339.3 |
| U.S. Average: | 224.8 |
Violent crime rate in 2020
| Las Cruces: | 303.3 |
| U.S. Average: | 228.2 |
Violent crime rate in 2019
| Las Cruces: | 298.5 |
| U.S. Average: | 219.9 |
Violent crime rate in 2018
| Las Cruces: | 240.2 |
| U.S. Average: | 221.2 |
Violent crime rate in 2017
| Las Cruces: | 118.7 |
| U.S. Average: | 226.2 |
Violent crime rate in 2016
| Las Cruces: | 150.0 |
| U.S. Average: | 227.3 |
Violent crime rate in 2015
| Las Cruces: | 152.1 |
| U.S. Average: | 219.3 |
Violent crime rate in 2014
| Las Cruces: | 181.7 |
| U.S. Average: | 211.1 |
Violent crime rate in 2013
| Las Cruces: | 184.8 |
| U.S. Average: | 214.2 |
Violent crime rate in 2012
| Las Cruces: | 232.9 |
| U.S. Average: | 187.4 |
Violent crime rate in 2011
| Las Cruces: | 227.9 |
| U.S. Average: | 187.1 |
Violent crime rate in 2010
| Las Cruces: | 219.2 |
| U.S. Average: | 195.7 |
Violent crime rate in 2009
| Las Cruces: | 265.4 |
| U.S. Average: | 208.9 |
Violent crime rate in 2008
| Las Cruces: | 293.5 |
| U.S. Average: | 222.5 |
Violent crime rate in 2007
| Las Cruces: | 218.4 |
| U.S. Average: | 229.1 |
Violent crime rate in 2006
| Las Cruces: | 286.3 |
| U.S. Average: | 232.6 |
Violent crime rate in 2005
| Las Cruces: | 277.5 |
| U.S. Average: | 227.0 |
Property crime rate in 2022
| Las Cruces: | 512.5 |
| U.S. Average: | 166.5 |
Property crime rate in 2021
| Las Cruces: | 425.3 |
| U.S. Average: | 157.8 |
Property crime rate in 2020
| Las Cruces: | 354.6 |
| U.S. Average: | 169.6 |
Property crime rate in 2019
| Las Cruces: | 302.7 |
| U.S. Average: | 179.7 |
Property crime rate in 2018
| Las Cruces: | 282.9 |
| U.S. Average: | 190.2 |
Property crime rate in 2017
| Las Cruces: | 269.2 |
| U.S. Average: | 206.4 |
Property crime rate in 2016
| Las Cruces: | 381.0 |
| U.S. Average: | 216.6 |
Property crime rate in 2015
| Las Cruces: | 376.1 |
| U.S. Average: | 221.5 |
Property crime rate in 2014
| Las Cruces: | 369.4 |
| U.S. Average: | 230.8 |
Property crime rate in 2013
| Las Cruces: | 336.4 |
| U.S. Average: | 250.4 |
Property crime rate in 2012
| Las Cruces: | 391.7 |
| U.S. Average: | 267.3 |
Property crime rate in 2011
| Las Cruces: | 427.0 |
| U.S. Average: | 273.5 |
Property crime rate in 2010
| Las Cruces: | 411.6 |
| U.S. Average: | 276.4 |
Property crime rate in 2009
| Las Cruces: | 423.5 |
| U.S. Average: | 285.6 |
Property crime rate in 2008
| Las Cruces: | 407.8 |
| U.S. Average: | 302.2 |
Property crime rate in 2007
| Las Cruces: | 325.6 |
| U.S. Average: | 309.2 |
Property crime rate in 2006
| Las Cruces: | 312.7 |
| U.S. Average: | 317.3 |
Property crime rate in 2005
| Las Cruces: | 322.2 |
| U.S. Average: | 322.3 |


Full-time law enforcement employees in 2021, including police officers: 243 (172 officers - 158 male; 14 female).
| Officers per 1,000 residents here: | 1.63 |
| New Mexico average: | 1.93 |
Full-time law enforcement employees in 2019, including police officers: 259 (187 officers - 169 male; 18 female).
| Officers per 1,000 residents here: | 1.81 |
| New Mexico average: | 1.97 |
Full-time law enforcement employees in 2017, including police officers: 261 (187 officers - 171 male; 16 female).
| Officers per 1,000 residents here: | 1.83 |
| New Mexico average: | 2.87 |
Full-time law enforcement employees in 2016, including police officers: 256 (182 officers - 167 male; 15 female).
| Officers per 1,000 residents here: | 1.78 |
| New Mexico average: | 2.82 |
Full-time law enforcement employees in 2013, including police officers: 265 (176 officers - 161 male; 15 female).
| Officers per 1,000 residents here: | 1.73 |
| New Mexico average: | 1.99 |
Full-time law enforcement employees in 2012, including police officers: 266 (177 officers - 161 male; 16 female).
| Officers per 1,000 residents here: | 1.77 |
| New Mexico average: | 2.22 |
Full-time law enforcement employees in 2011, including police officers: 263 (183 officers - 166 male; 17 female).
| Officers per 1,000 residents here: | 1.85 |
| New Mexico average: | 2.24 |
Full-time law enforcement employees in 2010, including police officers: 251 (168 officers - 155 male; 13 female).
| Officers per 1,000 residents here: | 1.72 |
| New Mexico average: | 2.19 |
Full-time law enforcement employees in 2009, including police officers: 259 (176 officers - 162 male; 14 female).
| Officers per 1,000 residents here: | 1.87 |
| New Mexico average: | 2.28 |
Full-time law enforcement employees in 2008, including police officers: 244 (163 officers - 148 male; 15 female).
| Officers per 1,000 residents here: | 1.77 |
| New Mexico average: | 2.28 |
Full-time law enforcement employees in 2007, including police officers: 243 (168 officers - 152 male; 16 female).
| Officers per 1,000 residents here: | 1.91 |
| New Mexico average: | 2.21 |
Full-time law enforcement employees in 2006, including police officers: 242 (165 officers - 149 male; 16 female).
| Officers per 1,000 residents here: | 1.97 |
| New Mexico average: | 2.27 |
Full-time law enforcement employees in 2005, including police officers: 241 (166 officers - 150 male; 16 female).
| Officers per 1,000 residents here: | 2.06 |
| New Mexico average: | 2.23 |
Full-time law enforcement employees in 2004, including police officers: 231 (161 officers - 147 male; 14 female).
| Officers per 1,000 residents here: | 2.06 |
| New Mexico average: | 2.24 |


