Crime rate in Lee's Summit, Missouri (MO): murders, rapes, robberies, assaults, burglaries, thefts, auto thefts, arson, law enforcement employees, police officers, crime map
Crime rate in Lee's Summit, MO
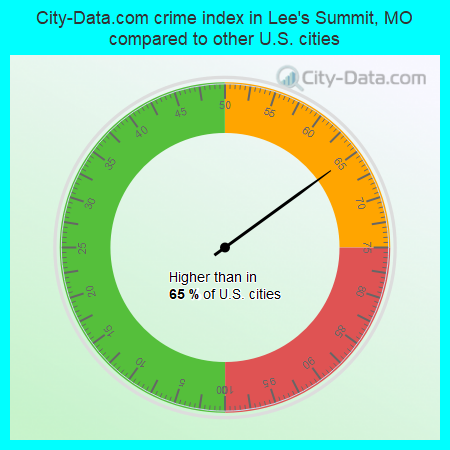
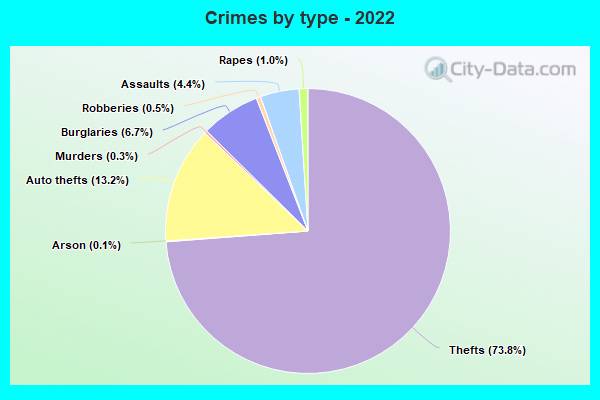
The 2022 crime rate in Lee's Summit, MO is 153 (City-Data.com crime index), which is 1.6 times lower than the U.S. average. It was higher than in 65.0% U.S. cities. The 2022 Lee's Summit crime rate rose by 12% compared to 2021. The number of homicides stood at 6 - an increase of 3 compared to 2021. In the last 5 years Lee's Summit has seen rise of violent crime and decline of property crime.See how dangerous Lee`s Summit, MO is compared to the nearest cities:
(Note: Higher means more crime)
(Note: Higher means more crime)
| Lee's Summit: | 153.2 |
| Greenwood: | 41.6 |
| Lake Winnebago: | 158.8 |
| Lake Lotawana: | 88.1 |
| Raytown: | 370.1 |
| Lake Tapawingo: | 10.2 |
| Grandview: | 422.9 |
| Blue Springs: | 178.9 |
| Raymore: | 100.2 |
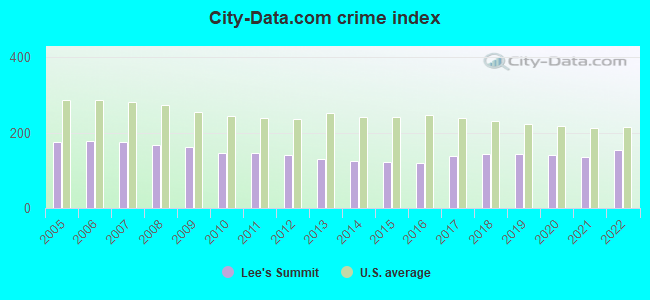
The City-Data.com crime index weighs serious crimes and violent crimes more heavily. Higher means more crime, U.S. average is 246.1. It adjusts for the number of visitors and daily workers commuting into cities.
- means the value is smaller than the state average.- means the value is about the same as the state average.
- means the value is bigger than the state average.
Violent crime rate in 2022
| Lee's Summit: | 89.4 |
| U.S. Average: | 219.8 |
Violent crime rate in 2021
| Lee's Summit: | 91.7 |
| U.S. Average: | 224.8 |
Violent crime rate in 2020
| Lee's Summit: | 78.3 |
| U.S. Average: | 228.2 |
Violent crime rate in 2019
| Lee's Summit: | 74.5 |
| U.S. Average: | 219.9 |
Violent crime rate in 2018
| Lee's Summit: | 75.4 |
| U.S. Average: | 221.2 |
Violent crime rate in 2017
| Lee's Summit: | 83.6 |
| U.S. Average: | 226.2 |
Violent crime rate in 2016
| Lee's Summit: | 68.4 |
| U.S. Average: | 227.3 |
Violent crime rate in 2015
| Lee's Summit: | 61.9 |
| U.S. Average: | 219.3 |
Violent crime rate in 2014
| Lee's Summit: | 57.2 |
| U.S. Average: | 211.1 |
Violent crime rate in 2013
| Lee's Summit: | 58.8 |
| U.S. Average: | 214.2 |
Violent crime rate in 2012
| Lee's Summit: | 66.4 |
| U.S. Average: | 187.4 |
Violent crime rate in 2011
| Lee's Summit: | 68.2 |
| U.S. Average: | 187.1 |
Violent crime rate in 2010
| Lee's Summit: | 65.7 |
| U.S. Average: | 195.7 |
Violent crime rate in 2009
| Lee's Summit: | 72.9 |
| U.S. Average: | 208.9 |
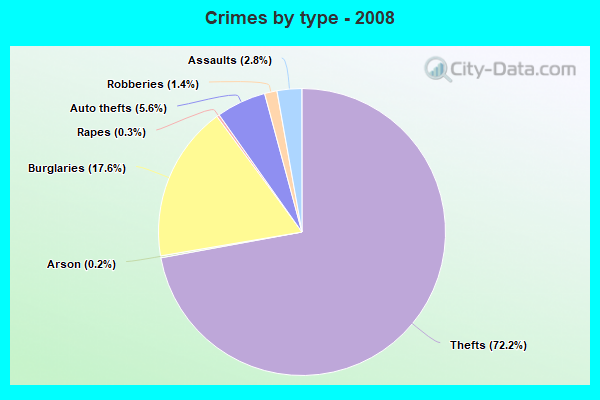
Violent crime rate in 2008
| Lee's Summit: | 71.1 |
| U.S. Average: | 222.5 |
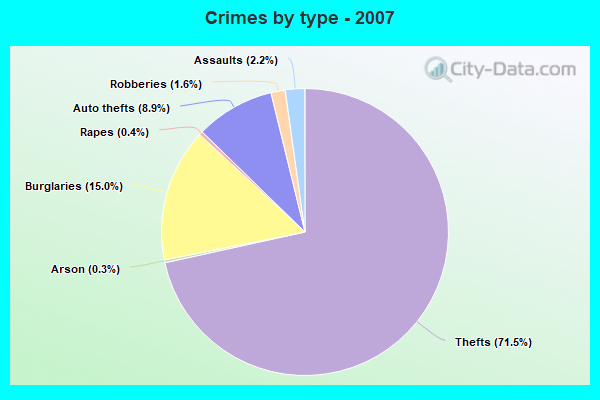
Violent crime rate in 2007
| Lee's Summit: | 68.9 |
| U.S. Average: | 229.1 |
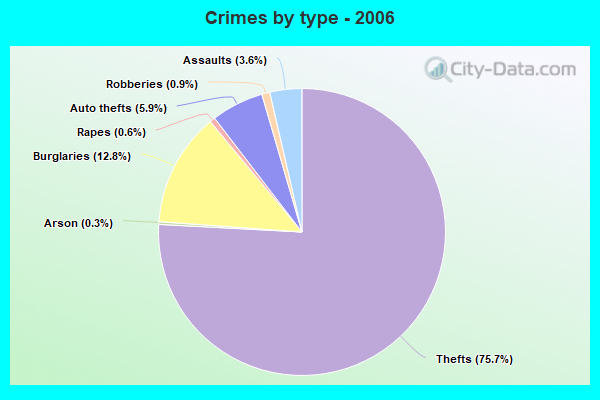
Violent crime rate in 2006
| Lee's Summit: | 89.6 |
| U.S. Average: | 232.6 |
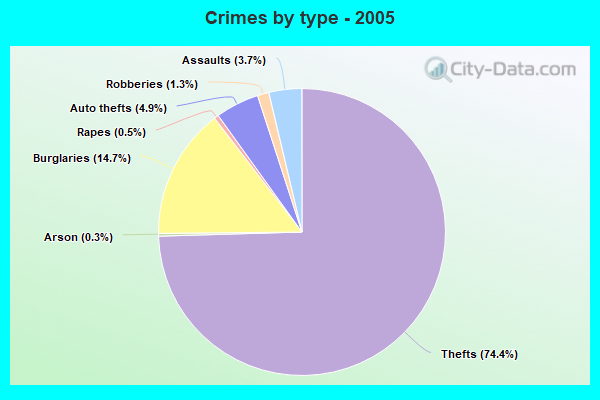
Violent crime rate in 2005
| Lee's Summit: | 90.9 |
| U.S. Average: | 227.0 |
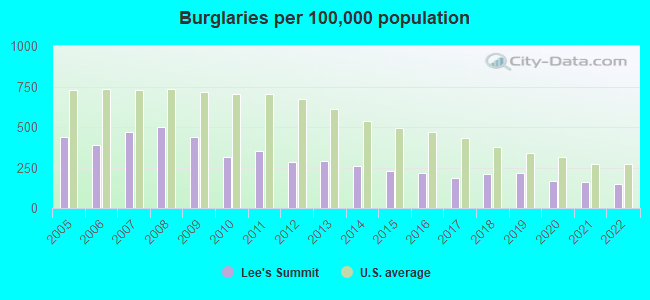
Property crime rate in 2022
| Lee's Summit: | 156.8 |
| U.S. Average: | 166.5 |
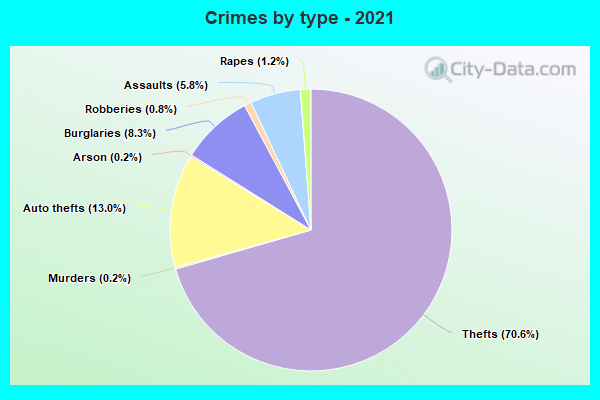
Property crime rate in 2021
| Lee's Summit: | 137.4 |
| U.S. Average: | 157.8 |
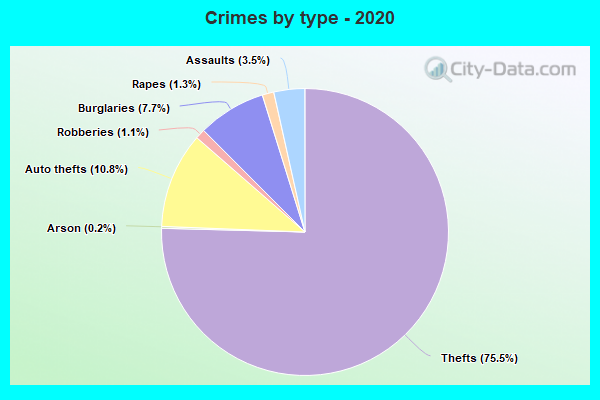
Property crime rate in 2020
| Lee's Summit: | 150.6 |
| U.S. Average: | 169.6 |
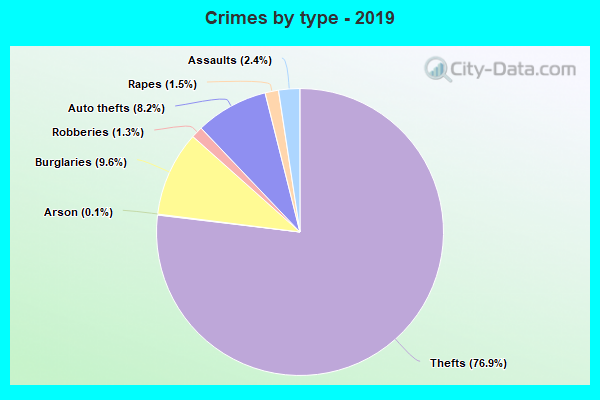
Property crime rate in 2019
| Lee's Summit: | 155.6 |
| U.S. Average: | 179.7 |
Property crime rate in 2018
| Lee's Summit: | 157.3 |
| U.S. Average: | 190.2 |
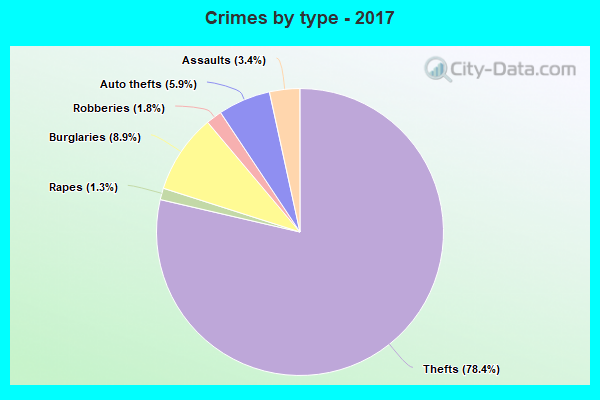
Property crime rate in 2017
| Lee's Summit: | 136.3 |
| U.S. Average: | 206.4 |
Property crime rate in 2016
| Lee's Summit: | 125.6 |
| U.S. Average: | 216.6 |
Property crime rate in 2015
| Lee's Summit: | 139.4 |
| U.S. Average: | 221.5 |
Property crime rate in 2014
| Lee's Summit: | 146.4 |
| U.S. Average: | 230.8 |
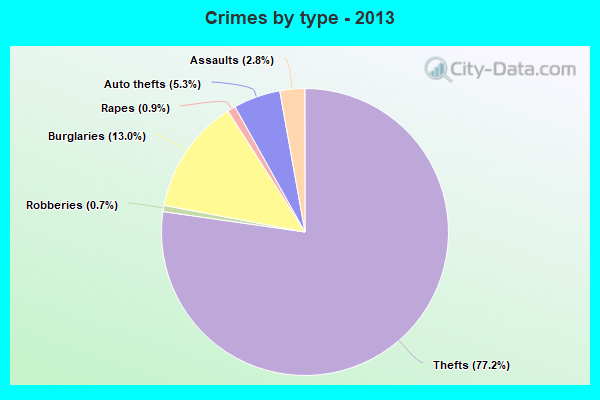
Property crime rate in 2013
| Lee's Summit: | 160.5 |
| U.S. Average: | 250.4 |
Property crime rate in 2012
| Lee's Summit: | 170.5 |
| U.S. Average: | 267.3 |
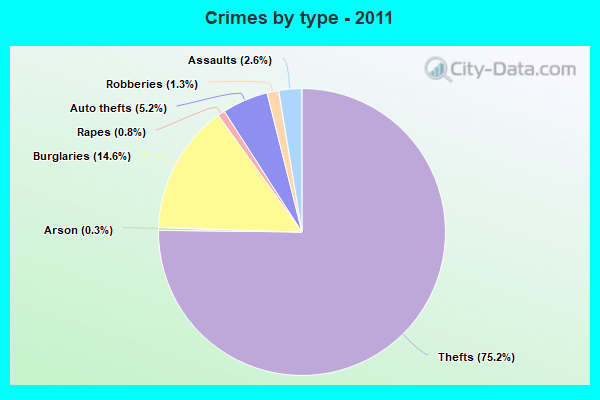
Property crime rate in 2011
| Lee's Summit: | 181.1 |
| U.S. Average: | 273.5 |
Property crime rate in 2010
| Lee's Summit: | 177.3 |
| U.S. Average: | 276.4 |
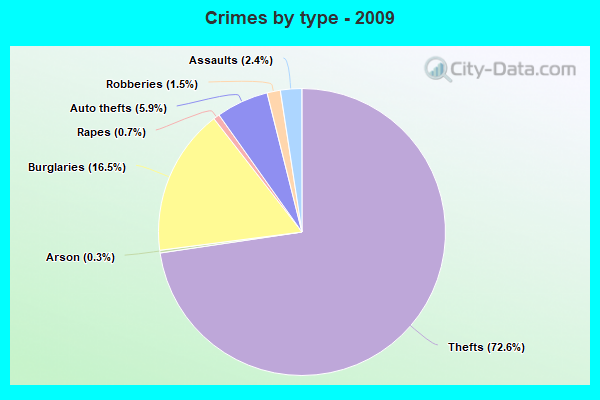
Property crime rate in 2009
| Lee's Summit: | 208.9 |
| U.S. Average: | 285.6 |
Property crime rate in 2008
| Lee's Summit: | 225.8 |
| U.S. Average: | 302.2 |
Property crime rate in 2007
| Lee's Summit: | 238.0 |
| U.S. Average: | 309.2 |
Property crime rate in 2006
| Lee's Summit: | 211.9 |
| U.S. Average: | 317.3 |
Property crime rate in 2005
| Lee's Summit: | 214.7 |
| U.S. Average: | 322.3 |


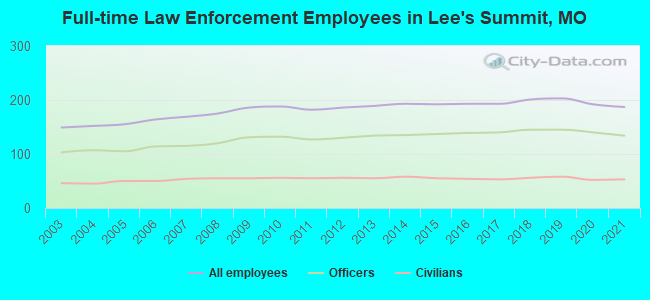
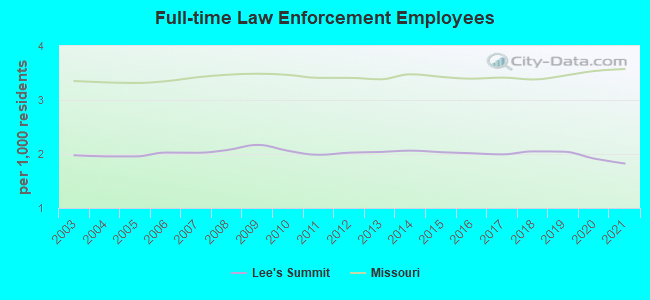
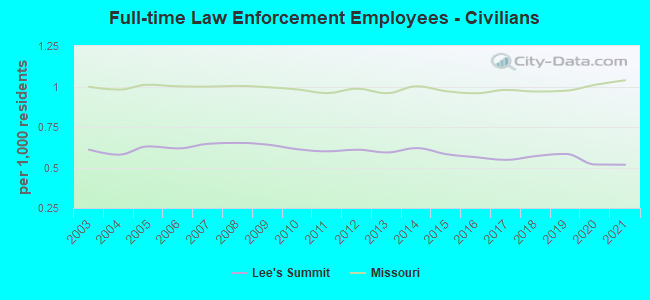
Full-time law enforcement employees in 2021, including police officers: 187 (134 officers - 115 male; 19 female).
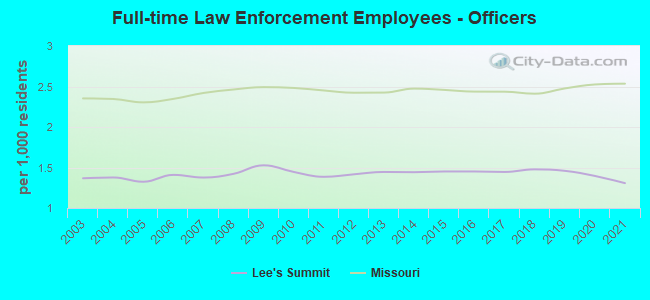
| Officers per 1,000 residents here: | 1.31 |
| Missouri average: | 2.54 |
Full-time law enforcement employees in 2020, including police officers: 192 (140 officers - 121 male; 19 female).
| Officers per 1,000 residents here: | 1.40 |
| Missouri average: | 2.53 |
Full-time law enforcement employees in 2019, including police officers: 203 (145 officers - 125 male; 20 female).
| Officers per 1,000 residents here: | 1.46 |
| Missouri average: | 2.48 |
Full-time law enforcement employees in 2018, including police officers: 201 (145 officers - 125 male; 20 female).
| Officers per 1,000 residents here: | 1.48 |
| Missouri average: | 2.41 |
Full-time law enforcement employees in 2017, including police officers: 193 (140 officers - 123 male; 17 female).
| Officers per 1,000 residents here: | 1.45 |
| Missouri average: | 2.44 |
Full-time law enforcement employees in 2016, including police officers: 193 (139 officers - 123 male; 16 female).
| Officers per 1,000 residents here: | 1.45 |
| Missouri average: | 2.44 |
Full-time law enforcement employees in 2015, including police officers: 192 (137 officers - 123 male; 14 female).
| Officers per 1,000 residents here: | 1.45 |
| Missouri average: | 2.46 |
Full-time law enforcement employees in 2014, including police officers: 193 (135 officers - 119 male; 16 female).
| Officers per 1,000 residents here: | 1.44 |
| Missouri average: | 2.47 |
Full-time law enforcement employees in 2013, including police officers: 189 (134 officers - 119 male; 15 female).
| Officers per 1,000 residents here: | 1.44 |
| Missouri average: | 2.42 |
Full-time law enforcement employees in 2012, including police officers: 186 (130 officers - 116 male; 14 female).
| Officers per 1,000 residents here: | 1.42 |
| Missouri average: | 2.42 |
Full-time law enforcement employees in 2011, including police officers: 182 (127 officers - 114 male; 13 female).
| Officers per 1,000 residents here: | 1.39 |
| Missouri average: | 2.45 |
Full-time law enforcement employees in 2010, including police officers: 188 (132 officers - 119 male; 13 female).
| Officers per 1,000 residents here: | 1.44 |
| Missouri average: | 2.48 |
Full-time law enforcement employees in 2009, including police officers: 186 (131 officers - 117 male; 14 female).
| Officers per 1,000 residents here: | 1.53 |
| Missouri average: | 2.49 |
Full-time law enforcement employees in 2008, including police officers: 175 (120 officers - 108 male; 12 female).
| Officers per 1,000 residents here: | 1.42 |
| Missouri average: | 2.46 |
Full-time law enforcement employees in 2007, including police officers: 169 (115 officers - 104 male; 11 female).
| Officers per 1,000 residents here: | 1.38 |
| Missouri average: | 2.42 |
Full-time law enforcement employees in 2006, including police officers: 164 (114 officers - 104 male; 10 female).
| Officers per 1,000 residents here: | 1.41 |
| Missouri average: | 2.35 |
Full-time law enforcement employees in 2005, including police officers: 155 (105 officers - 98 male; 7 female).
| Officers per 1,000 residents here: | 1.32 |
| Missouri average: | 2.30 |
Full-time law enforcement employees in 2004, including police officers: 152 (107 officers - 102 male; 5 female).
| Officers per 1,000 residents here: | 1.38 |
| Missouri average: | 2.35 |
Full-time law enforcement employees in 2003, including police officers: 149 (103 officers - 96 male; 7 female).
| Officers per 1,000 residents here: | 1.37 |
| Missouri average: | 2.35 |


Zip codes: 64083.