Crime rate in Manchester, New Hampshire (NH): murders, rapes, robberies, assaults, burglaries, thefts, auto thefts, arson, law enforcement employees, police officers, crime map
Crime rate in Manchester, NH
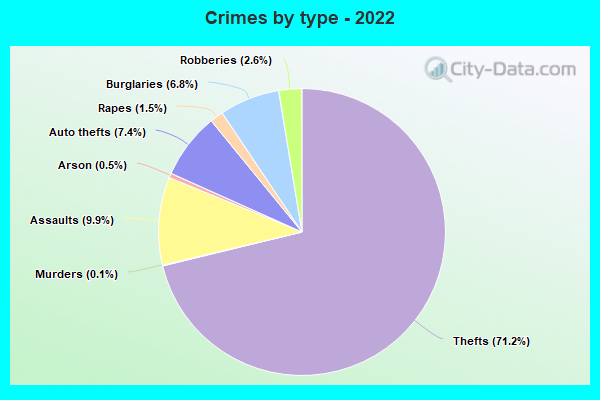
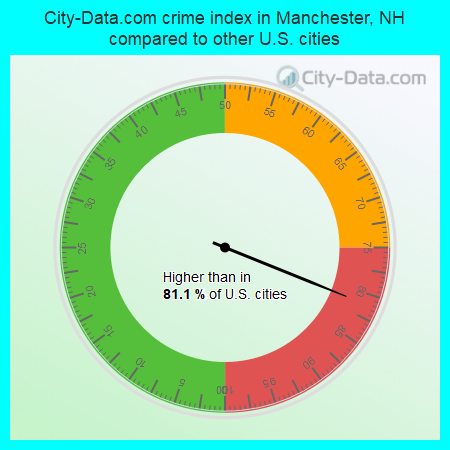
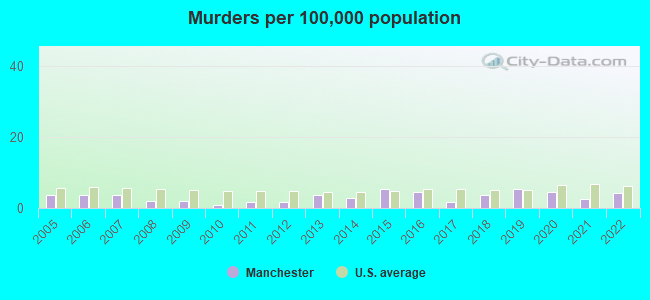
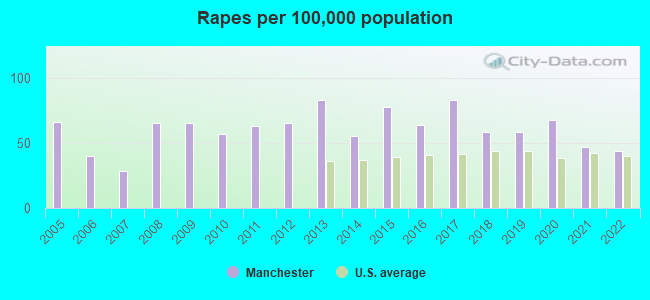
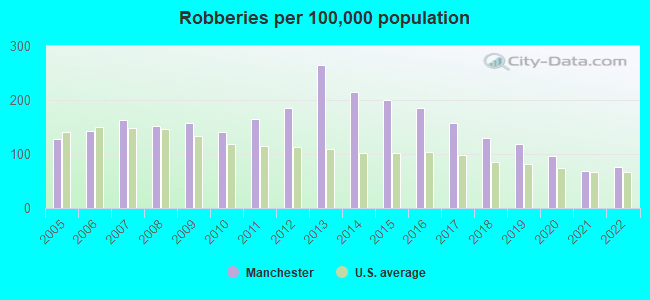
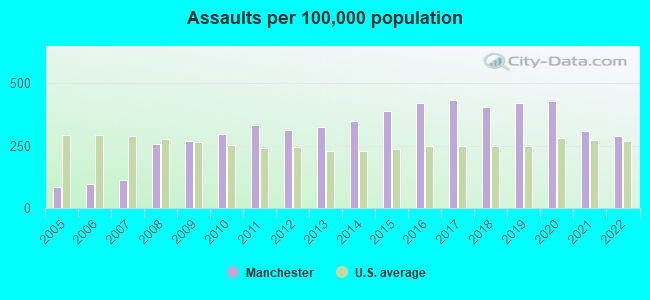
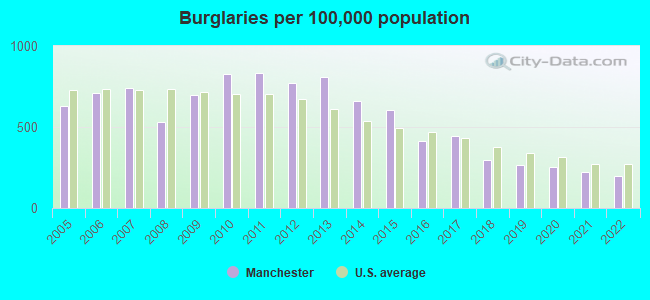
The 2022 crime rate in Manchester, NH is 238 (City-Data.com crime index), which is about the average for the U.S. cities. It was higher than in 81.1% U.S. cities. The 2022 Manchester crime rate rose by 3% compared to 2021. The number of homicides stood at 5 - an increase of 2 compared to 2021. In the last 5 years Manchester has seen decline of violent crime and decreasing property crime.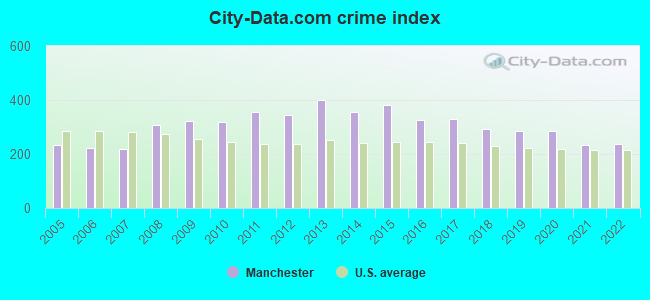
The City-Data.com crime index weighs serious crimes and violent crimes more heavily. Higher means more crime, U.S. average is 246.1. It adjusts for the number of visitors and daily workers commuting into cities.
- means the value is smaller than the state average.- means the value is about the same as the state average.
- means the value is bigger than the state average.
- means the value is much bigger than the state average.
According to our research of New Hampshire and other state lists, there were 517 registered sex offenders living in Manchester, New Hampshire as of May 17, 2024.
The ratio of all residents to sex offenders in Manchester is 214 to 1.
Violent crime rate in 2022
| Manchester: | 234.2 |
| U.S. Average: | 219.8 |
Violent crime rate in 2021
| Manchester: | 239.7 |
| U.S. Average: | 224.8 |
Violent crime rate in 2020
| Manchester: | 339.8 |
| U.S. Average: | 228.2 |
Violent crime rate in 2019
| Manchester: | 338.8 |
| U.S. Average: | 219.9 |
Violent crime rate in 2018
| Manchester: | 331.6 |
| U.S. Average: | 221.2 |
Violent crime rate in 2017
| Manchester: | 381.8 |
| U.S. Average: | 226.2 |
Violent crime rate in 2016
| Manchester: | 375.6 |
| U.S. Average: | 227.3 |
Violent crime rate in 2015
| Manchester: | 382.7 |
| U.S. Average: | 219.3 |
Violent crime rate in 2014
| Manchester: | 341.4 |
| U.S. Average: | 211.1 |
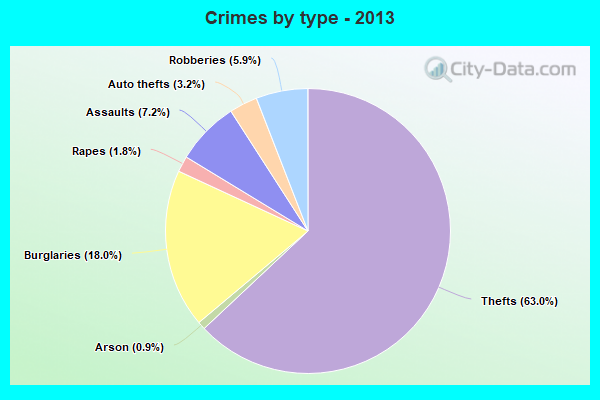
Violent crime rate in 2013
| Manchester: | 384.9 |
| U.S. Average: | 214.2 |
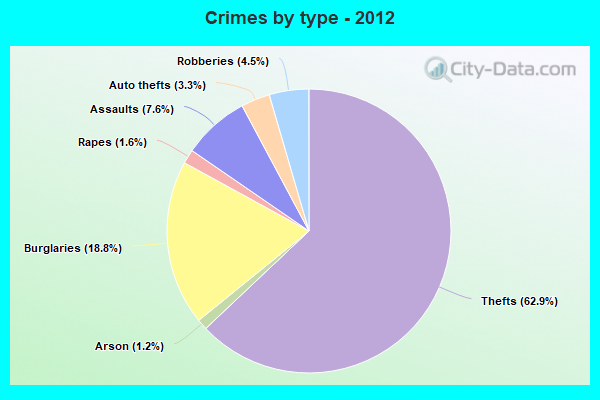
Violent crime rate in 2012
| Manchester: | 319.0 |
| U.S. Average: | 187.4 |
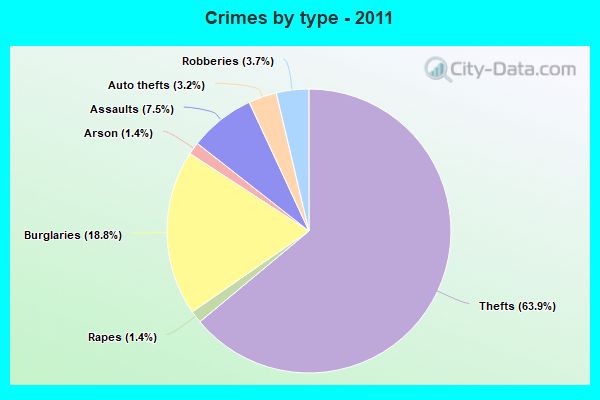
Violent crime rate in 2011
| Manchester: | 315.8 |
| U.S. Average: | 187.1 |
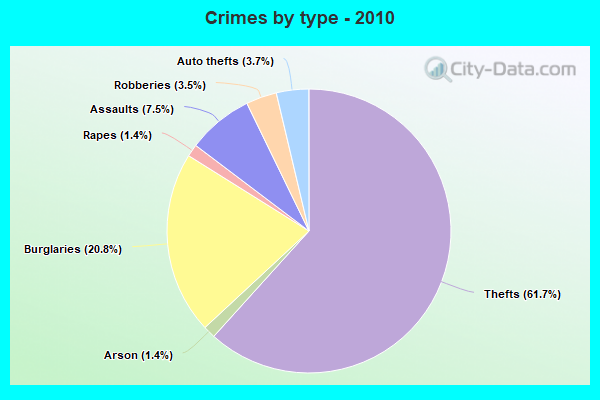
Violent crime rate in 2010
| Manchester: | 277.9 |
| U.S. Average: | 195.7 |
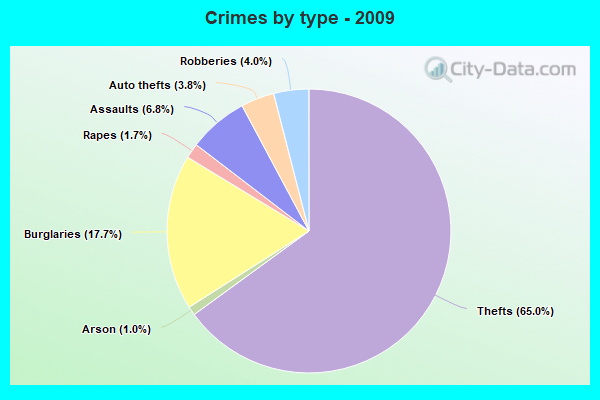
Violent crime rate in 2009
| Manchester: | 282.5 |
| U.S. Average: | 208.9 |
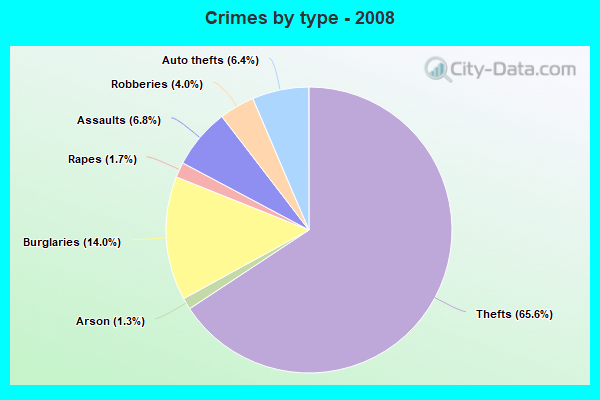
Violent crime rate in 2008
| Manchester: | 272.7 |
| U.S. Average: | 222.5 |
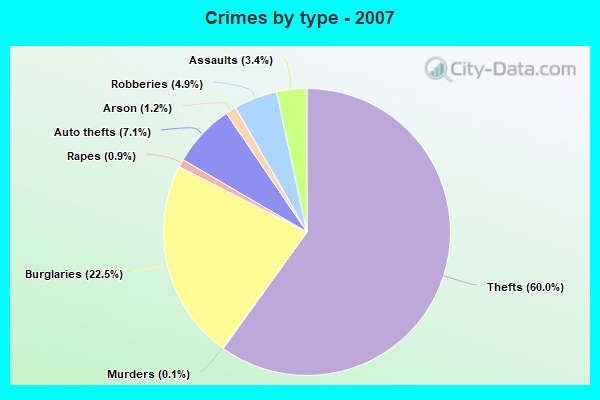
Violent crime rate in 2007
| Manchester: | 150.0 |
| U.S. Average: | 229.1 |
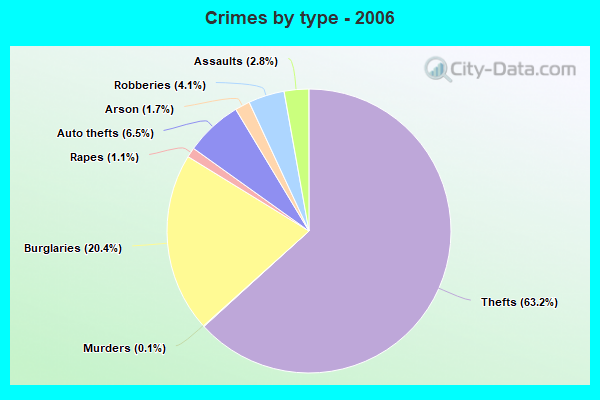
Violent crime rate in 2006
| Manchester: | 145.7 |
| U.S. Average: | 232.6 |
Violent crime rate in 2005
| Manchester: | 155.1 |
| U.S. Average: | 227.0 |
Property crime rate in 2022
| Manchester: | 175.6 |
| U.S. Average: | 166.5 |
Property crime rate in 2021
| Manchester: | 168.2 |
| U.S. Average: | 157.8 |
Property crime rate in 2020
| Manchester: | 169.9 |
| U.S. Average: | 169.6 |
Property crime rate in 2019
| Manchester: | 172.0 |
| U.S. Average: | 179.7 |
Property crime rate in 2018
| Manchester: | 188.5 |
| U.S. Average: | 190.2 |
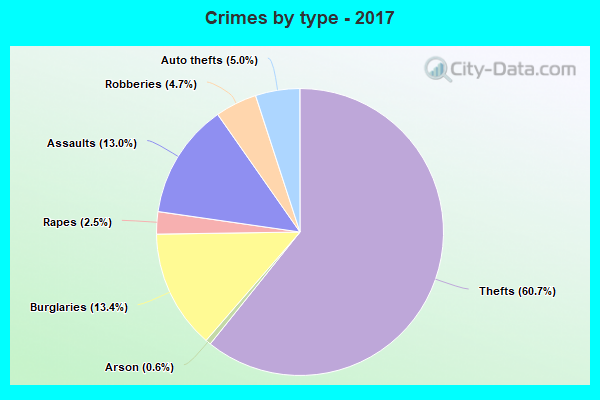
Property crime rate in 2017
| Manchester: | 214.5 |
| U.S. Average: | 206.4 |
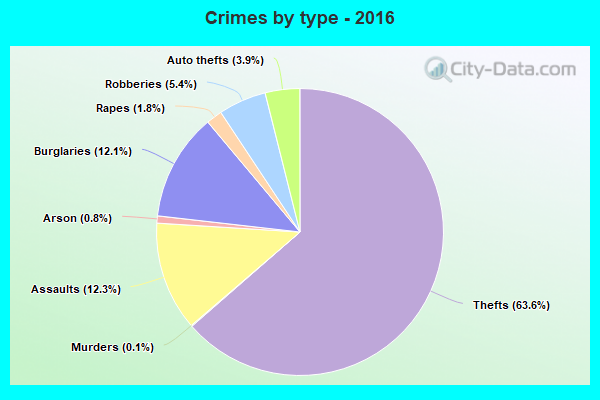
Property crime rate in 2016
| Manchester: | 211.8 |
| U.S. Average: | 216.6 |
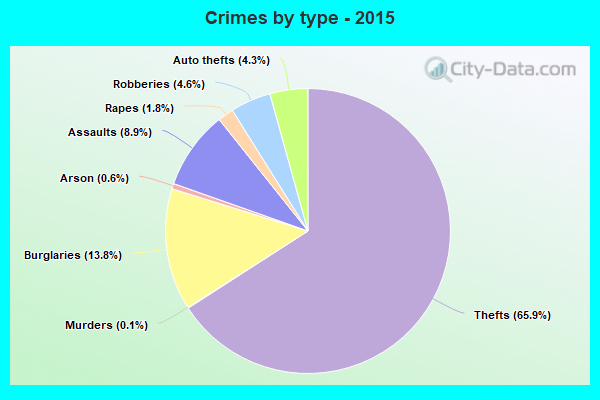
Property crime rate in 2015
| Manchester: | 293.6 |
| U.S. Average: | 221.5 |
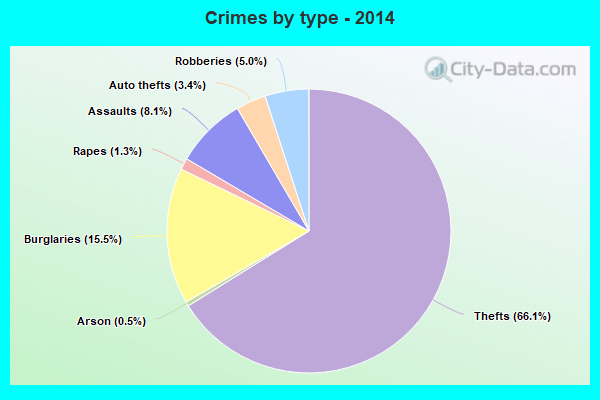
Property crime rate in 2014
| Manchester: | 294.7 |
| U.S. Average: | 230.8 |
Property crime rate in 2013
| Manchester: | 325.9 |
| U.S. Average: | 250.4 |
Property crime rate in 2012
| Manchester: | 304.3 |
| U.S. Average: | 267.3 |
Property crime rate in 2011
| Manchester: | 330.8 |
| U.S. Average: | 273.5 |
Property crime rate in 2010
| Manchester: | 310.1 |
| U.S. Average: | 276.4 |
Property crime rate in 2009
| Manchester: | 290.8 |
| U.S. Average: | 285.6 |
Property crime rate in 2008
| Manchester: | 265.8 |
| U.S. Average: | 302.2 |
Property crime rate in 2007
| Manchester: | 245.4 |
| U.S. Average: | 309.2 |
Property crime rate in 2006
| Manchester: | 248.7 |
| U.S. Average: | 317.3 |
Property crime rate in 2005
| Manchester: | 241.0 |
| U.S. Average: | 322.3 |
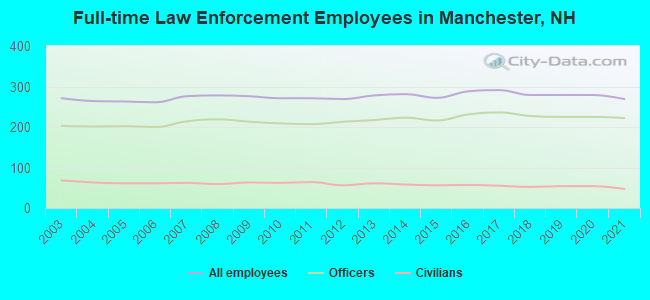
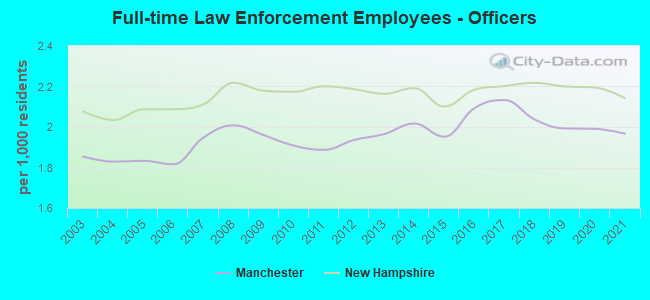
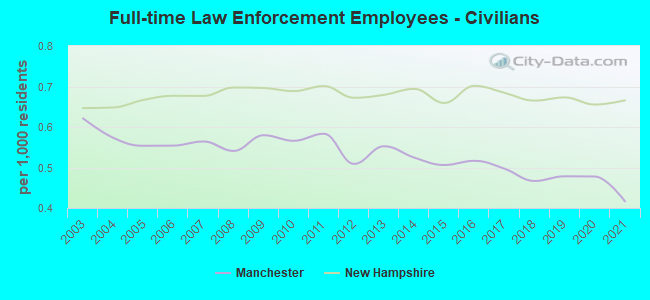
Full-time law enforcement employees in 2021, including police officers: 269 (222 officers - 202 male; 20 female).
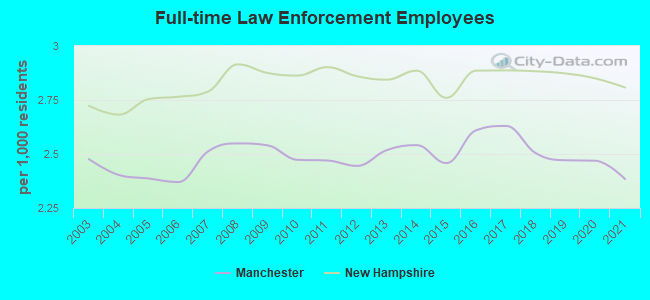
| Officers per 1,000 residents here: | 1.97 |
| New Hampshire average: | 2.14 |
Full-time law enforcement employees in 2020, including police officers: 279 (225 officers - 204 male; 21 female).
| Officers per 1,000 residents here: | 1.99 |
| New Hampshire average: | 2.19 |
Full-time law enforcement employees in 2019, including police officers: 279 (225 officers - 204 male; 21 female).
| Officers per 1,000 residents here: | 1.99 |
| New Hampshire average: | 2.20 |
Full-time law enforcement employees in 2018, including police officers: 279 (227 officers - 207 male; 20 female).
| Officers per 1,000 residents here: | 2.04 |
| New Hampshire average: | 2.22 |
Full-time law enforcement employees in 2017, including police officers: 291 (236 officers - 215 male; 21 female).
| Officers per 1,000 residents here: | 2.13 |
| New Hampshire average: | 2.20 |
Full-time law enforcement employees in 2016, including police officers: 288 (231 officers - 211 male; 20 female).
| Officers per 1,000 residents here: | 2.09 |
| New Hampshire average: | 2.18 |
Full-time law enforcement employees in 2015, including police officers: 272 (216 officers - 198 male; 18 female).
| Officers per 1,000 residents here: | 1.95 |
| New Hampshire average: | 2.10 |
Full-time law enforcement employees in 2014, including police officers: 281 (223 officers - 206 male; 17 female).
| Officers per 1,000 residents here: | 2.02 |
| New Hampshire average: | 2.19 |
Full-time law enforcement employees in 2013, including police officers: 278 (217 officers - 200 male; 17 female).
| Officers per 1,000 residents here: | 1.97 |
| New Hampshire average: | 2.16 |
Full-time law enforcement employees in 2012, including police officers: 269 (213 officers - 197 male; 16 female).
| Officers per 1,000 residents here: | 1.94 |
| New Hampshire average: | 2.19 |
Full-time law enforcement employees in 2011, including police officers: 271 (207 officers - 193 male; 14 female).
| Officers per 1,000 residents here: | 1.89 |
| New Hampshire average: | 2.20 |
Full-time law enforcement employees in 2010, including police officers: 271 (209 officers - 196 male; 13 female).
| Officers per 1,000 residents here: | 1.91 |
| New Hampshire average: | 2.17 |
Full-time law enforcement employees in 2009, including police officers: 276 (213 officers - 198 male; 15 female).
| Officers per 1,000 residents here: | 1.96 |
| New Hampshire average: | 2.18 |
Full-time law enforcement employees in 2008, including police officers: 278 (219 officers - 203 male; 16 female).
| Officers per 1,000 residents here: | 2.01 |
| New Hampshire average: | 2.22 |
Full-time law enforcement employees in 2007, including police officers: 276 (214 officers - 201 male; 13 female).
| Officers per 1,000 residents here: | 1.95 |
| New Hampshire average: | 2.11 |
Full-time law enforcement employees in 2006, including police officers: 261 (200 officers - 188 male; 12 female).
| Officers per 1,000 residents here: | 1.82 |
| New Hampshire average: | 2.09 |
Full-time law enforcement employees in 2005, including police officers: 263 (202 officers - 190 male; 12 female).
| Officers per 1,000 residents here: | 1.83 |
| New Hampshire average: | 2.09 |
Full-time law enforcement employees in 2004, including police officers: 264 (201 officers - 190 male; 11 female).
| Officers per 1,000 residents here: | 1.83 |
| New Hampshire average: | 2.03 |
Full-time law enforcement employees in 2003, including police officers: 271 (203 officers - 192 male; 11 female).
| Officers per 1,000 residents here: | 1.85 |
| New Hampshire average: | 2.08 |