Crime rate in Minneapolis, Minnesota (MN): murders, rapes, robberies, assaults, burglaries, thefts, auto thefts, arson, law enforcement employees, police officers, crime map
Crime rate in Minneapolis, MN
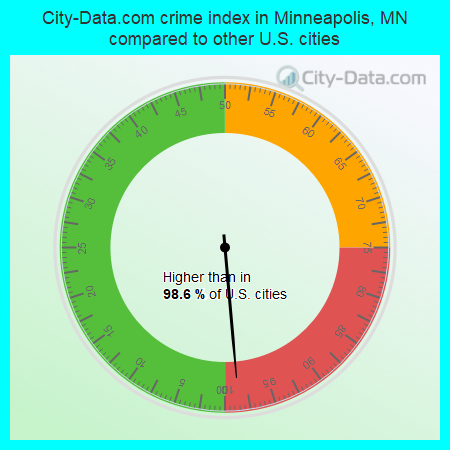
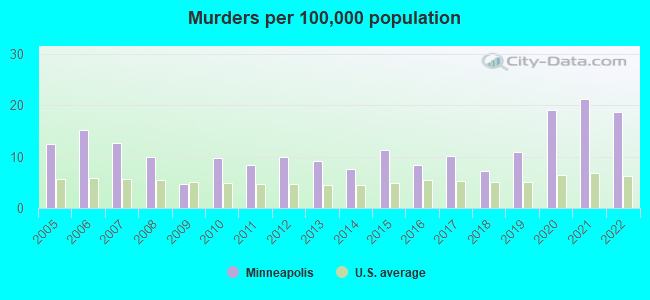
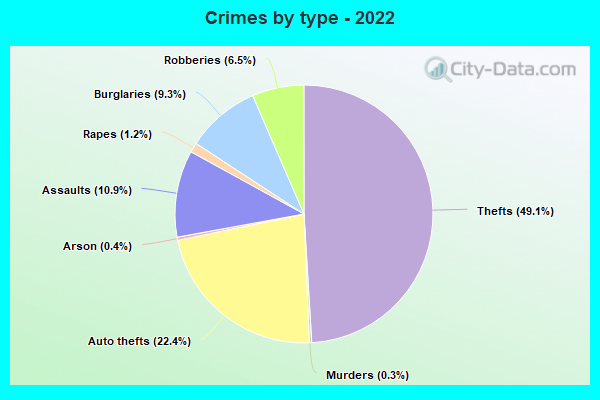
The 2022 crime rate in Minneapolis, MN is 655 (City-Data.com crime index), which is 2.7 times higher than the U.S. average. It was higher than in 98.6% U.S. cities. The 2022 Minneapolis crime rate rose by 5% compared to 2021. The number of homicides stood at 79 - a decrease of 14 compared to 2021. In the last 5 years Minneapolis has seen rise of violent crime and increasing property crime.See how dangerous Minneapolis, MN is compared to the nearest cities:
(Note: Higher means more crime)
(Note: Higher means more crime)
| Minneapolis: | 654.8 |
| St. Louis Park: | 222.0 |
| Golden Valley: | 158.3 |
| St. Anthony: | 228.9 |
| Robbinsdale: | 309.4 |
| Columbia Heights: | 225.5 |
| Richfield: | 232.9 |
| Edina: | 121.4 |
| Roseville: | 357.6 |

The City-Data.com crime index weighs serious crimes and violent crimes more heavily. Higher means more crime, U.S. average is 246.1. It adjusts for the number of visitors and daily workers commuting into cities.
- means the value is about the same as the state average.- means the value is bigger than the state average.
- means the value is much bigger than the state average.
According to our research of Minnesota and other state lists, there were 181 registered sex offenders living in Minneapolis, Minnesota as of May 15, 2024.
The ratio of all residents to sex offenders in Minneapolis is 2,285 to 1.
Violent crime rate in 2022
| Minneapolis: | 680.2 |
| U.S. Average: | 219.8 |
Violent crime rate in 2021
| Minneapolis: | 718.2 |
| U.S. Average: | 224.8 |
Violent crime rate in 2020
| Minneapolis: | 656.3 |
| U.S. Average: | 228.2 |
Violent crime rate in 2019
| Minneapolis: | 540.1 |
| U.S. Average: | 219.9 |
Violent crime rate in 2018
| Minneapolis: | 457.7 |
| U.S. Average: | 221.2 |
Violent crime rate in 2017
| Minneapolis: | 627.0 |
| U.S. Average: | 226.2 |
Violent crime rate in 2016
| Minneapolis: | 621.7 |
| U.S. Average: | 227.3 |
Violent crime rate in 2015
| Minneapolis: | 597.7 |
| U.S. Average: | 219.3 |
Violent crime rate in 2014
| Minneapolis: | 565.6 |
| U.S. Average: | 211.1 |
Violent crime rate in 2013
| Minneapolis: | 571.8 |
| U.S. Average: | 214.2 |
Violent crime rate in 2012
| Minneapolis: | 562.7 |
| U.S. Average: | 187.4 |
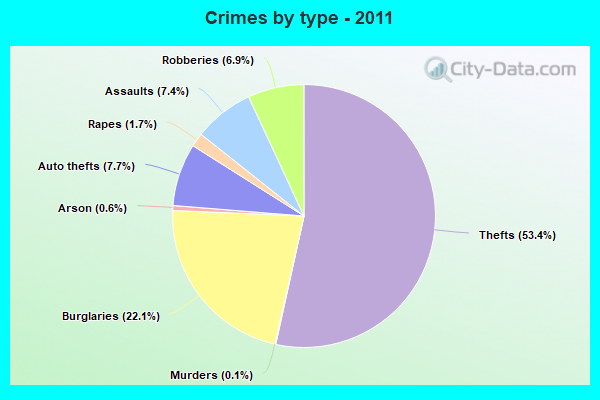
Violent crime rate in 2011
| Minneapolis: | 545.2 |
| U.S. Average: | 187.1 |
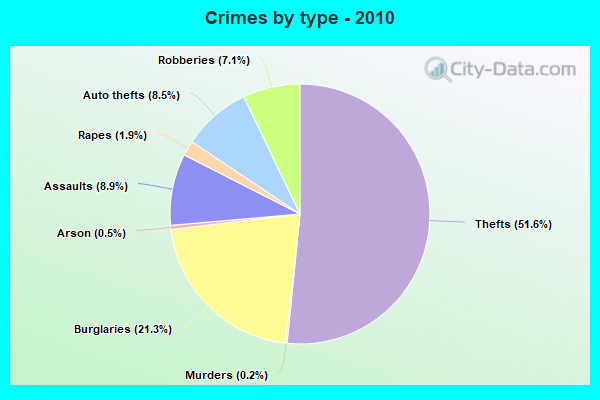
Violent crime rate in 2010
| Minneapolis: | 602.9 |
| U.S. Average: | 195.7 |
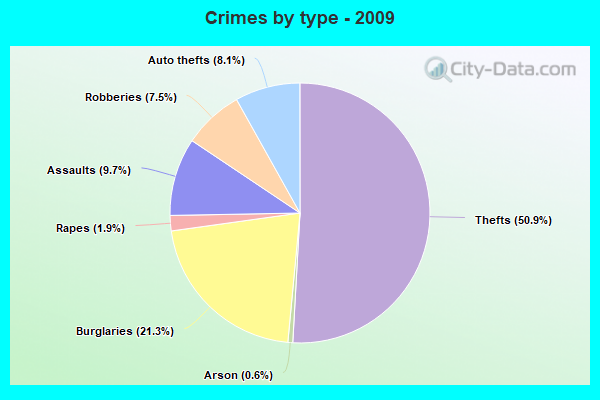
Violent crime rate in 2009
| Minneapolis: | 615.4 |
| U.S. Average: | 208.9 |
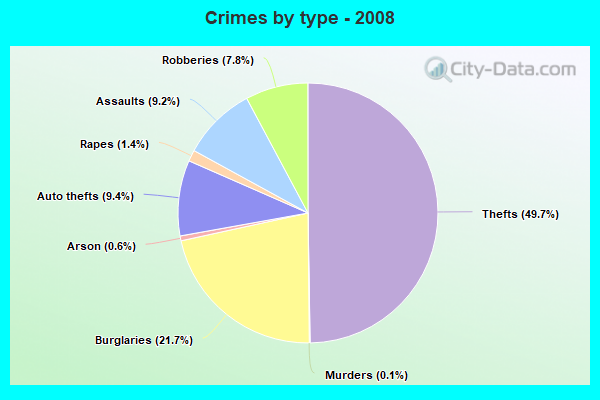
Violent crime rate in 2008
| Minneapolis: | 697.7 |
| U.S. Average: | 222.5 |
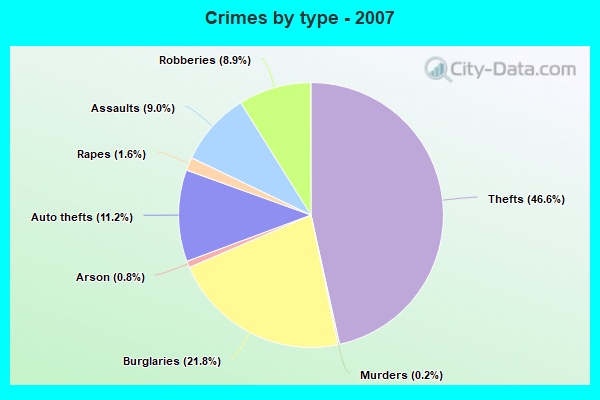
Violent crime rate in 2007
| Minneapolis: | 630.9 |
| U.S. Average: | 229.1 |
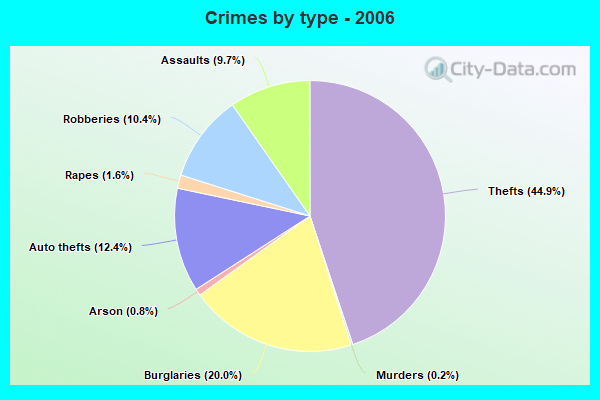
Violent crime rate in 2006
| Minneapolis: | 707.5 |
| U.S. Average: | 232.6 |
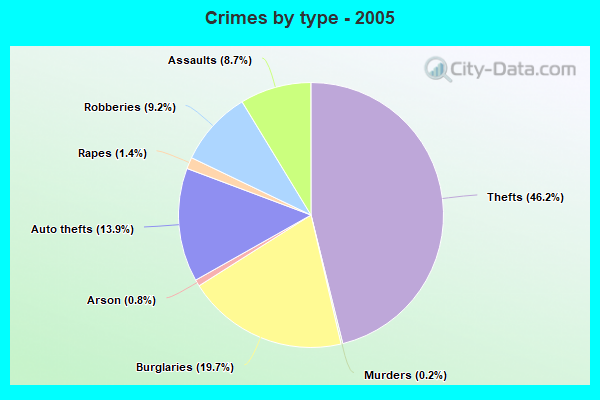
Violent crime rate in 2005
| Minneapolis: | 606.5 |
| U.S. Average: | 227.0 |
Property crime rate in 2022
| Minneapolis: | 499.5 |
| U.S. Average: | 166.5 |
Property crime rate in 2021
| Minneapolis: | 392.7 |
| U.S. Average: | 157.8 |
Property crime rate in 2020
| Minneapolis: | 456.1 |
| U.S. Average: | 169.6 |
Property crime rate in 2019
| Minneapolis: | 413.1 |
| U.S. Average: | 179.7 |
Property crime rate in 2018
| Minneapolis: | 354.9 |
| U.S. Average: | 190.2 |
Property crime rate in 2017
| Minneapolis: | 423.8 |
| U.S. Average: | 206.4 |
Property crime rate in 2016
| Minneapolis: | 382.0 |
| U.S. Average: | 216.6 |
Property crime rate in 2015
| Minneapolis: | 380.2 |
| U.S. Average: | 221.5 |
Property crime rate in 2014
| Minneapolis: | 426.8 |
| U.S. Average: | 230.8 |
Property crime rate in 2013
| Minneapolis: | 458.2 |
| U.S. Average: | 250.4 |
Property crime rate in 2012
| Minneapolis: | 478.4 |
| U.S. Average: | 267.3 |
Property crime rate in 2011
| Minneapolis: | 493.5 |
| U.S. Average: | 273.5 |
Property crime rate in 2010
| Minneapolis: | 476.6 |
| U.S. Average: | 276.4 |
Property crime rate in 2009
| Minneapolis: | 466.2 |
| U.S. Average: | 285.6 |
Property crime rate in 2008
| Minneapolis: | 562.3 |
| U.S. Average: | 302.2 |
Property crime rate in 2007
| Minneapolis: | 484.3 |
| U.S. Average: | 309.2 |
Property crime rate in 2006
| Minneapolis: | 478.1 |
| U.S. Average: | 317.3 |
Property crime rate in 2005
| Minneapolis: | 472.0 |
| U.S. Average: | 322.3 |

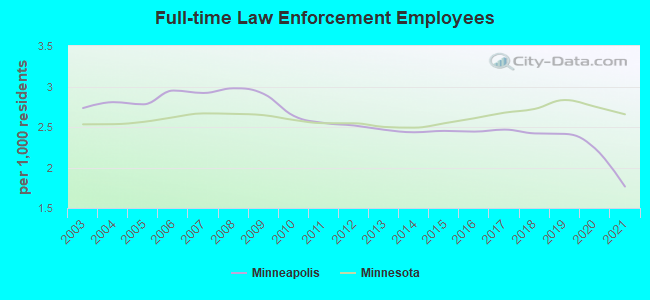
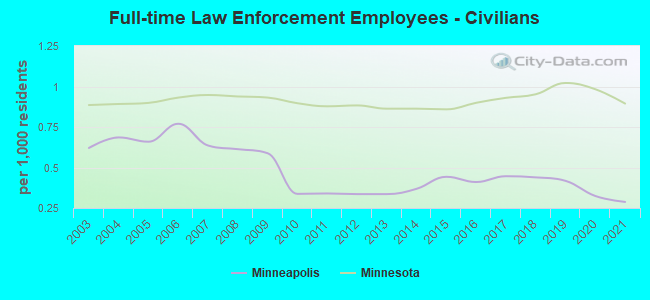
Full-time law enforcement employees in 2021, including police officers: 774 (648 officers - 546 male; 102 female).
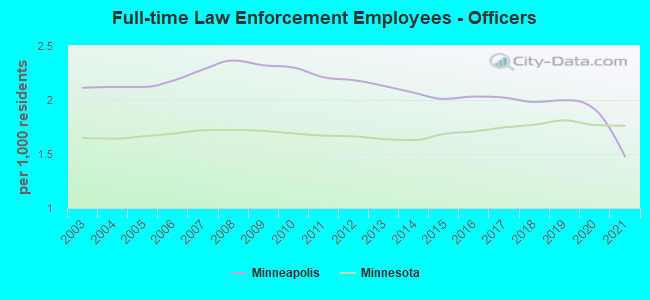
| Officers per 1,000 residents here: | 1.48 |
| Minnesota average: | 1.76 |
Full-time law enforcement employees in 2020, including police officers: 974 (833 officers - 710 male; 123 female).
| Officers per 1,000 residents here: | 1.91 |
| Minnesota average: | 1.77 |
Full-time law enforcement employees in 2019, including police officers: 1,041 (861 officers - 740 male; 121 female).
| Officers per 1,000 residents here: | 2.00 |
| Minnesota average: | 1.81 |
Full-time law enforcement employees in 2018, including police officers: 1,037 (849 officers - 731 male; 118 female).
| Officers per 1,000 residents here: | 1.98 |
| Minnesota average: | 1.77 |
Full-time law enforcement employees in 2017, including police officers: 1,034 (847 officers - 725 male; 122 female).
| Officers per 1,000 residents here: | 2.02 |
| Minnesota average: | 1.75 |
Full-time law enforcement employees in 2016, including police officers: 1,018 (847 officers - 723 male; 124 female).
| Officers per 1,000 residents here: | 2.03 |
| Minnesota average: | 1.71 |
Full-time law enforcement employees in 2015, including police officers: 1,014 (831 officers - 713 male; 118 female).
| Officers per 1,000 residents here: | 2.01 |
| Minnesota average: | 1.69 |
Full-time law enforcement employees in 2014, including police officers: 985 (836 officers - 719 male; 117 female).
| Officers per 1,000 residents here: | 2.07 |
| Minnesota average: | 1.63 |
Full-time law enforcement employees in 2013, including police officers: 977 (844 officers - 716 male; 128 female).
| Officers per 1,000 residents here: | 2.13 |
| Minnesota average: | 1.64 |
Full-time law enforcement employees in 2012, including police officers: 983 (852 officers - 715 male; 137 female).
| Officers per 1,000 residents here: | 2.18 |
| Minnesota average: | 1.66 |
Full-time law enforcement employees in 2011, including police officers: 983 (852 officers - 715 male; 137 female).
| Officers per 1,000 residents here: | 2.21 |
| Minnesota average: | 1.67 |
Full-time law enforcement employees in 2010, including police officers: 1,009 (880 officers - 741 male; 139 female).
| Officers per 1,000 residents here: | 2.30 |
| Minnesota average: | 1.69 |
Full-time law enforcement employees in 2009, including police officers: 1,113 (888 officers - 747 male; 141 female).
| Officers per 1,000 residents here: | 2.32 |
| Minnesota average: | 1.71 |
Full-time law enforcement employees in 2008, including police officers: 1,122 (891 officers - 750 male; 141 female).
| Officers per 1,000 residents here: | 2.36 |
| Minnesota average: | 1.72 |
Full-time law enforcement employees in 2007, including police officers: 1,084 (848 officers - 716 male; 132 female).
| Officers per 1,000 residents here: | 2.28 |
| Minnesota average: | 1.72 |
Full-time law enforcement employees in 2006, including police officers: 1,107 (818 officers - 689 male; 129 female).
| Officers per 1,000 residents here: | 2.18 |
| Minnesota average: | 1.69 |
Full-time law enforcement employees in 2005, including police officers: 1,046 (798 officers - 673 male; 125 female).
| Officers per 1,000 residents here: | 2.12 |
| Minnesota average: | 1.66 |
Full-time law enforcement employees in 2004, including police officers: 1,056 (798 officers - 668 male; 130 female).
| Officers per 1,000 residents here: | 2.12 |
| Minnesota average: | 1.64 |
Full-time law enforcement employees in 2003, including police officers: 1,035 (800 officers - 670 male; 130 female).
| Officers per 1,000 residents here: | 2.11 |
| Minnesota average: | 1.65 |


Zip codes: 55401, 55402, 55403, 55404, 55405, 55406, 55407, 55408, 55409, 55412, 55413, 55414, 55415, 55417, 55418, 55419, 55450, 55454, 55455.