Crime rate in Mobile, Alabama (AL): murders, rapes, robberies, assaults, burglaries, thefts, auto thefts, arson, law enforcement employees, police officers, crime map
Crime rate in Mobile, AL
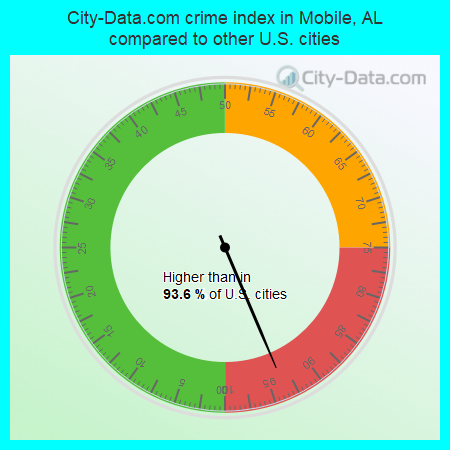
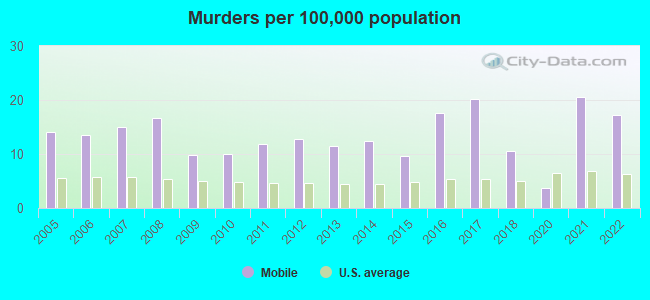
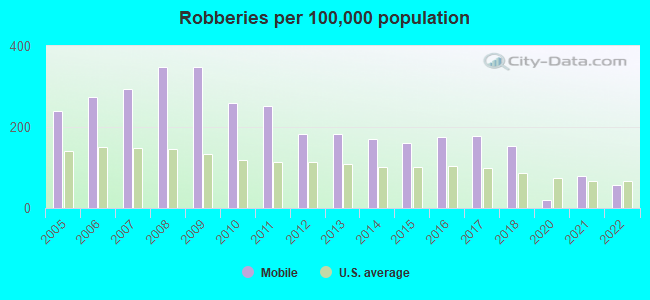
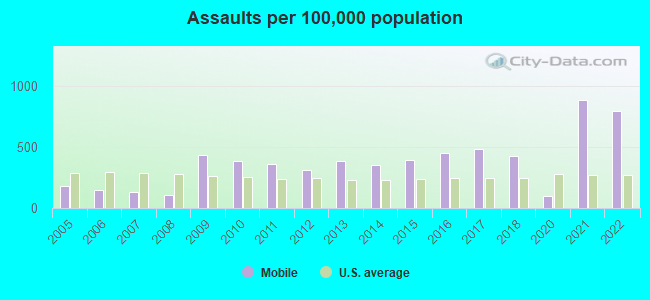
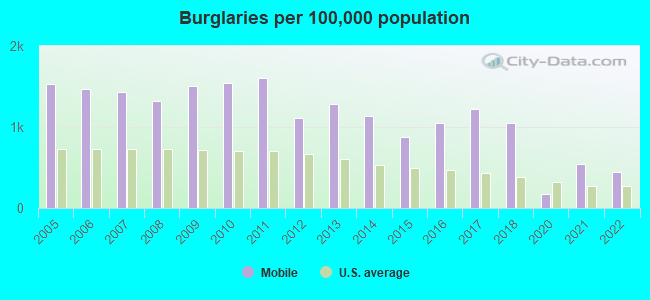
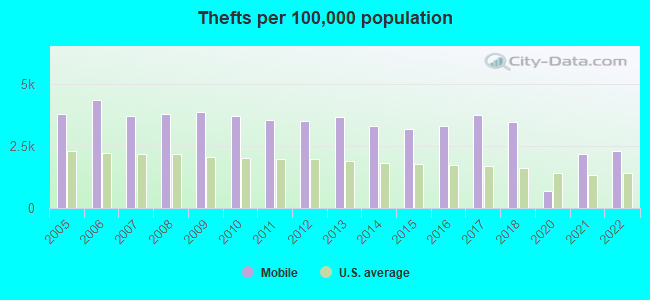
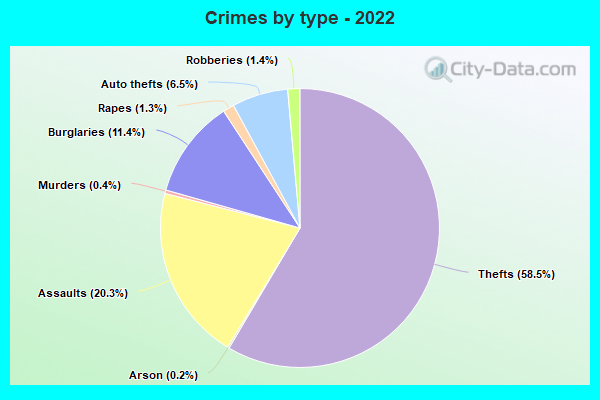
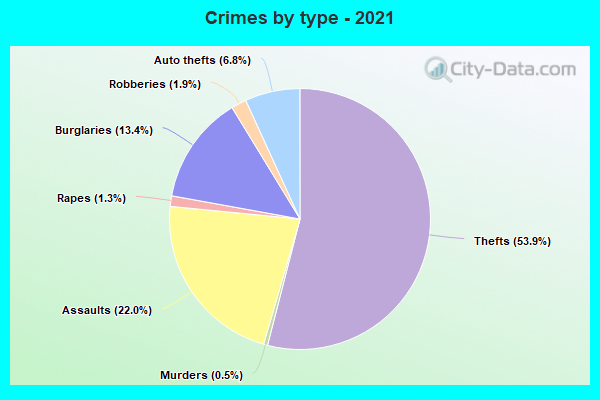
The 2022 crime rate in Mobile, AL is 397 (City-Data.com crime index), which is 1.6 times higher than the U.S. average. It was higher than in 93.6% U.S. cities. The 2022 Mobile crime rate fell by 8% compared to 2021. The number of homicides stood at 41 - a decrease of 9 compared to 2021. In the last 5 years Mobile has seen rise of violent crime and decline of property crime.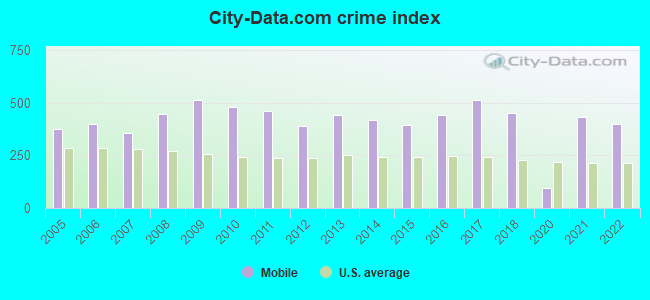
The City-Data.com crime index weighs serious crimes and violent crimes more heavily. Higher means more crime, U.S. average is 246.1. It adjusts for the number of visitors and daily workers commuting into cities.
- means the value is smaller than the state average.- means the value is about the same as the state average.
- means the value is bigger than the state average.
- means the value is much bigger than the state average.
According to our research of Alabama and other state lists, there were 463 registered sex offenders living in Mobile, Alabama as of May 22, 2024.
The ratio of all residents to sex offenders in Mobile is 419 to 1.
The ratio of registered sex offenders to all residents in this city is near the state average.
Violent crime rate in 2022
| Mobile: | 515.0 |
| U.S. Average: | 219.8 |
Violent crime rate in 2021
| Mobile: | 575.6 |
| U.S. Average: | 224.8 |
Violent crime rate in 2020
| Mobile: | 83.4 |
| U.S. Average: | 228.2 |
Violent crime rate in 2018
| Mobile: | 378.7 |
| U.S. Average: | 221.2 |
Violent crime rate in 2017
| Mobile: | 428.9 |
| U.S. Average: | 226.2 |
Violent crime rate in 2016
| Mobile: | 386.1 |
| U.S. Average: | 227.3 |
Violent crime rate in 2015
| Mobile: | 342.9 |
| U.S. Average: | 219.3 |
Violent crime rate in 2014
| Mobile: | 342.5 |
| U.S. Average: | 211.1 |
Violent crime rate in 2013
| Mobile: | 342.4 |
| U.S. Average: | 214.2 |
Violent crime rate in 2012
| Mobile: | 289.2 |
| U.S. Average: | 187.4 |
Violent crime rate in 2011
| Mobile: | 348.8 |
| U.S. Average: | 187.1 |
Violent crime rate in 2010
| Mobile: | 365.6 |
| U.S. Average: | 195.7 |
Violent crime rate in 2009
| Mobile: | 427.1 |
| U.S. Average: | 208.9 |
Violent crime rate in 2008
| Mobile: | 270.3 |
| U.S. Average: | 222.5 |
Violent crime rate in 2007
| Mobile: | 207.5 |
| U.S. Average: | 229.1 |
Violent crime rate in 2006
| Mobile: | 222.3 |
| U.S. Average: | 232.6 |
Violent crime rate in 2005
| Mobile: | 221.3 |
| U.S. Average: | 227.0 |
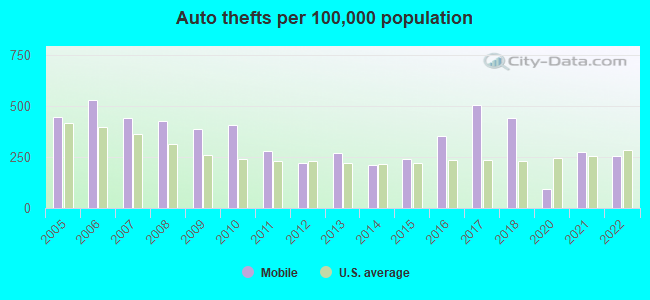
Property crime rate in 2022
| Mobile: | 243.8 |
| U.S. Average: | 166.5 |
Property crime rate in 2021
| Mobile: | 258.3 |
| U.S. Average: | 157.8 |
Property crime rate in 2020
| Mobile: | 81.3 |
| U.S. Average: | 169.6 |
Property crime rate in 2018
| Mobile: | 447.4 |
| U.S. Average: | 190.2 |
Property crime rate in 2017
| Mobile: | 505.9 |
| U.S. Average: | 206.4 |
Property crime rate in 2016
| Mobile: | 428.4 |
| U.S. Average: | 216.6 |
Property crime rate in 2015
| Mobile: | 372.2 |
| U.S. Average: | 221.5 |
Property crime rate in 2014
| Mobile: | 423.0 |
| U.S. Average: | 230.8 |
Property crime rate in 2013
| Mobile: | 478.8 |
| U.S. Average: | 250.4 |
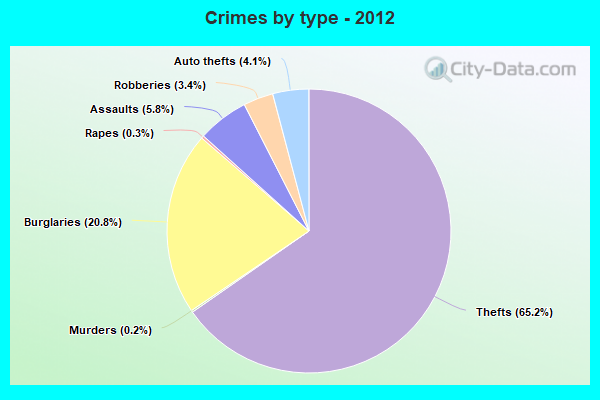
Property crime rate in 2012
| Mobile: | 429.3 |
| U.S. Average: | 267.3 |
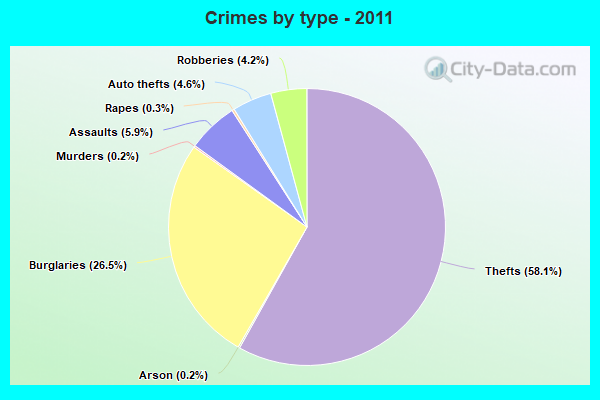
Property crime rate in 2011
| Mobile: | 540.5 |
| U.S. Average: | 273.5 |
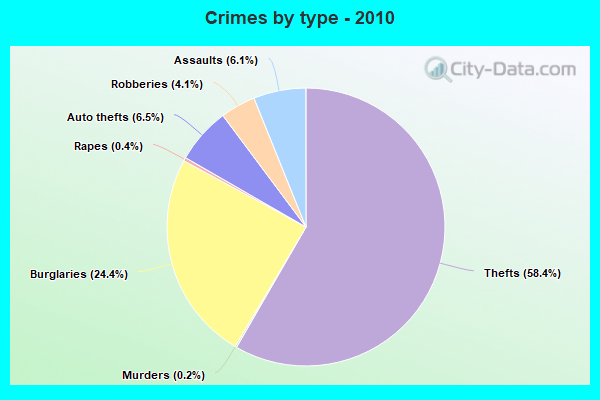
Property crime rate in 2010
| Mobile: | 554.6 |
| U.S. Average: | 276.4 |
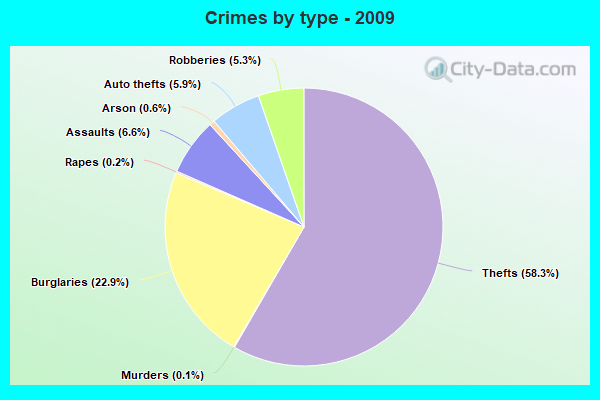
Property crime rate in 2009
| Mobile: | 551.9 |
| U.S. Average: | 285.6 |
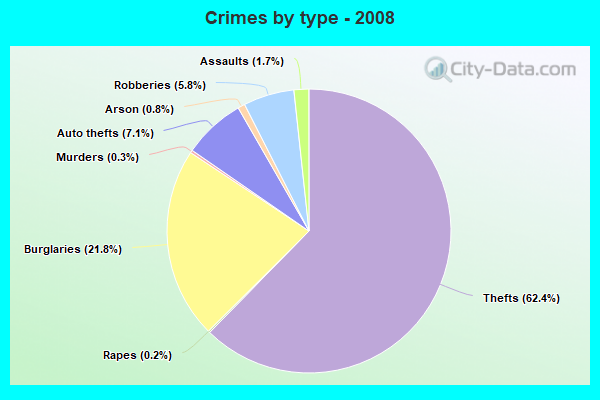
Property crime rate in 2008
| Mobile: | 515.9 |
| U.S. Average: | 302.2 |
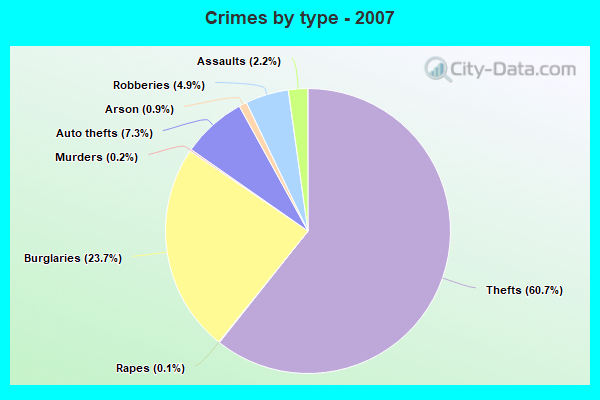
Property crime rate in 2007
| Mobile: | 442.9 |
| U.S. Average: | 309.2 |
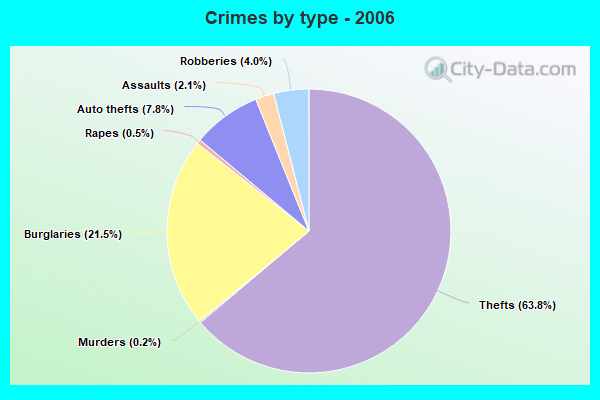
Property crime rate in 2006
| Mobile: | 484.9 |
| U.S. Average: | 317.3 |
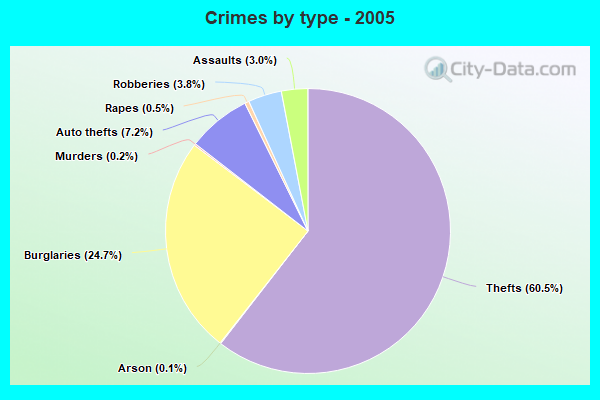
Property crime rate in 2005
| Mobile: | 462.4 |
| U.S. Average: | 322.3 |
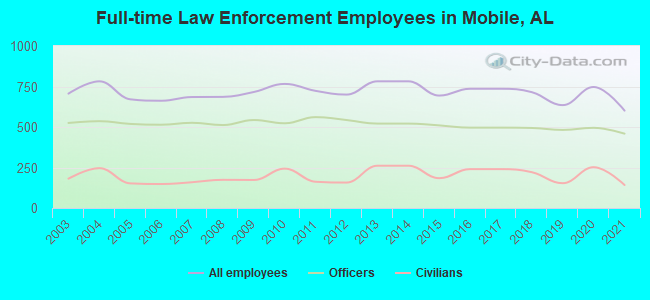
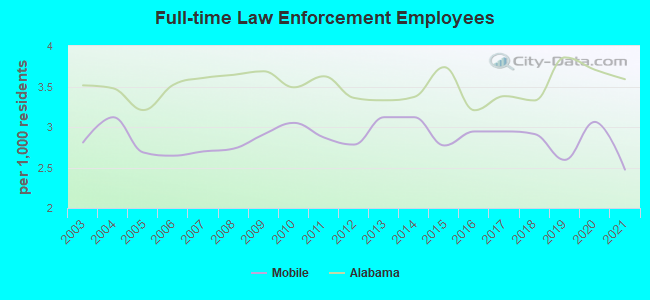
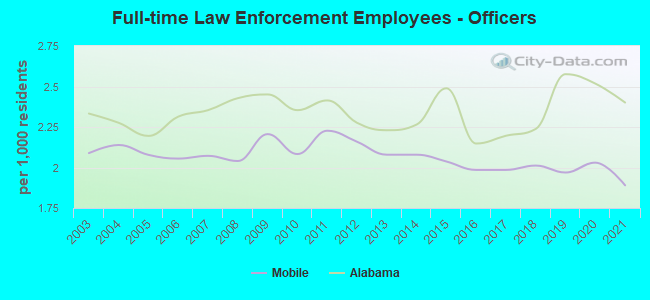
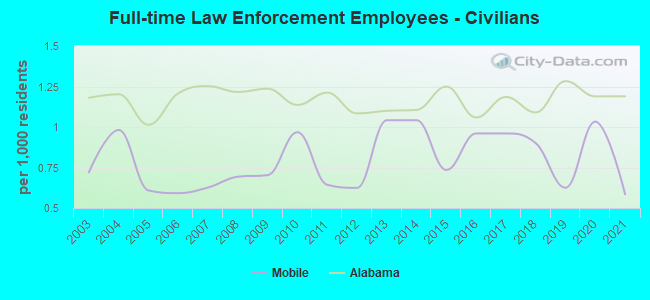
Full-time law enforcement employees in 2021, including police officers: 601 (459 officers - 412 male; 47 female).
| Officers per 1,000 residents here: | 1.89 |
| Alabama average: | 2.40 |
Full-time law enforcement employees in 2020, including police officers: 747 (495 officers - 440 male; 55 female).
| Officers per 1,000 residents here: | 2.03 |
| Alabama average: | 2.52 |
Full-time law enforcement employees in 2019, including police officers: 635 (482 officers - 431 male; 51 female).
| Officers per 1,000 residents here: | 1.97 |
| Alabama average: | 2.58 |
Full-time law enforcement employees in 2018, including police officers: 715 (494 officers - 447 male; 47 female).
| Officers per 1,000 residents here: | 2.01 |
| Alabama average: | 2.24 |
Full-time law enforcement employees in 2016, including police officers: 736 (496 officers - 447 male; 49 female).
| Officers per 1,000 residents here: | 1.98 |
| Alabama average: | 2.15 |
Full-time law enforcement employees in 2015, including police officers: 694 (510 officers - 458 male; 52 female).
| Officers per 1,000 residents here: | 2.04 |
| Alabama average: | 2.49 |
Full-time law enforcement employees in 2013, including police officers: 782 (521 officers - 468 male; 53 female).
| Officers per 1,000 residents here: | 2.08 |
| Alabama average: | 2.23 |
Full-time law enforcement employees in 2012, including police officers: 700 (543 officers - 488 male; 55 female).
| Officers per 1,000 residents here: | 2.16 |
| Alabama average: | 2.28 |
Full-time law enforcement employees in 2011, including police officers: 723 (561 officers - 505 male; 56 female).
| Officers per 1,000 residents here: | 2.23 |
| Alabama average: | 2.41 |
Full-time law enforcement employees in 2010, including police officers: 766 (523 officers - 469 male; 54 female).
| Officers per 1,000 residents here: | 2.08 |
| Alabama average: | 2.35 |
Full-time law enforcement employees in 2009, including police officers: 716 (543 officers - 488 male; 55 female).
| Officers per 1,000 residents here: | 2.21 |
| Alabama average: | 2.45 |
Full-time law enforcement employees in 2008, including police officers: 686 (512 officers - 466 male; 46 female).
| Officers per 1,000 residents here: | 2.04 |
| Alabama average: | 2.43 |
Full-time law enforcement employees in 2007, including police officers: 685 (526 officers - 480 male; 46 female).
| Officers per 1,000 residents here: | 2.07 |
| Alabama average: | 2.35 |
Full-time law enforcement employees in 2006, including police officers: 662 (514 officers - 470 male; 44 female).
| Officers per 1,000 residents here: | 2.05 |
| Alabama average: | 2.31 |
Full-time law enforcement employees in 2005, including police officers: 671 (519 officers - 477 male; 42 female).
| Officers per 1,000 residents here: | 2.08 |
| Alabama average: | 2.20 |
Full-time law enforcement employees in 2004, including police officers: 782 (536 officers - 491 male; 45 female).
| Officers per 1,000 residents here: | 2.14 |
| Alabama average: | 2.28 |
Full-time law enforcement employees in 2003, including police officers: 706 (525 officers - 473 male; 52 female).
| Officers per 1,000 residents here: | 2.09 |
| Alabama average: | 2.33 |


Zip codes: 36575, 36602, 36603, 36604, 36605, 36606, 36607, 36608, 36609, 36613, 36615, 36617, 36618, 36619, 36688, 36693, 36695.