Crime rate in New Bedford, Massachusetts (MA): murders, rapes, robberies, assaults, burglaries, thefts, auto thefts, arson, law enforcement employees, police officers, crime map
Crime rate in New Bedford, MA
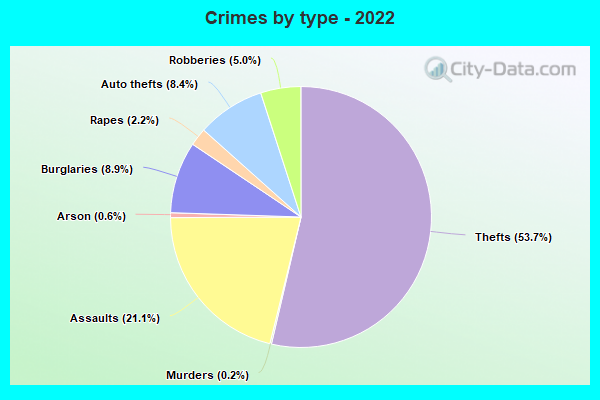
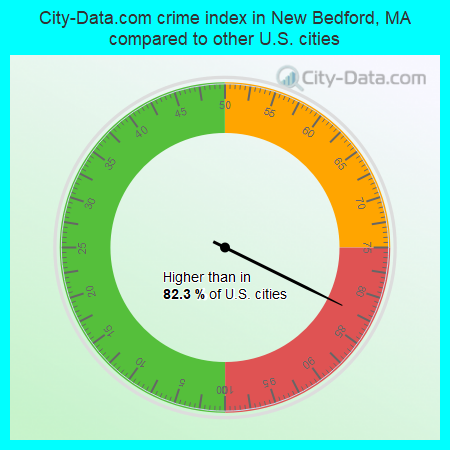
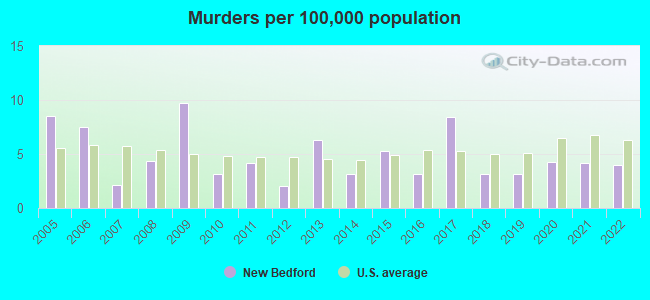
The 2022 crime rate in New Bedford, MA is 248 (City-Data.com crime index), which is about the average for the U.S. cities. It was higher than in 82.3% U.S. cities. The 2022 New Bedford crime rate fell by 5% compared to 2021. The number of homicides stood at 4. In the last 5 years New Bedford has seen decline of violent crime and decreasing property crime.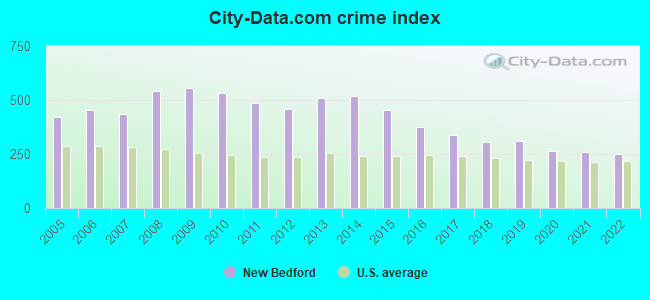
The City-Data.com crime index weighs serious crimes and violent crimes more heavily. Higher means more crime, U.S. average is 246.1. It adjusts for the number of visitors and daily workers commuting into cities.
- means the value is smaller than the state average.- means the value is about the same as the state average.
- means the value is bigger than the state average.
- means the value is much bigger than the state average.
According to our research of Massachusetts and other state lists, there were 139 registered sex offenders living in New Bedford, Massachusetts as of May 19, 2024.
The ratio of all residents to sex offenders in New Bedford is 684 to 1.
Violent crime rate in 2022
| New Bedford: | 343.2 |
| U.S. Average: | 219.8 |
Violent crime rate in 2021
| New Bedford: | 352.9 |
| U.S. Average: | 224.8 |
Violent crime rate in 2020
| New Bedford: | 346.7 |
| U.S. Average: | 228.2 |
Violent crime rate in 2019
| New Bedford: | 373.6 |
| U.S. Average: | 219.9 |
Violent crime rate in 2018
| New Bedford: | 345.9 |
| U.S. Average: | 221.2 |
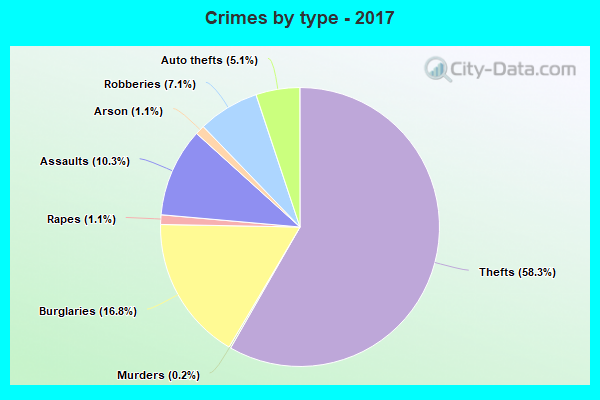
Violent crime rate in 2017
| New Bedford: | 364.9 |
| U.S. Average: | 226.2 |
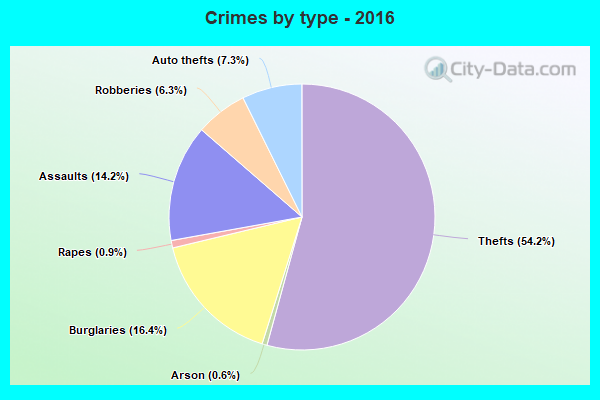
Violent crime rate in 2016
| New Bedford: | 449.1 |
| U.S. Average: | 227.3 |
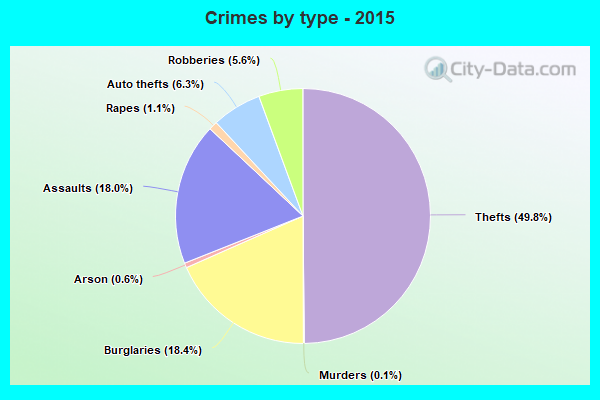
Violent crime rate in 2015
| New Bedford: | 585.8 |
| U.S. Average: | 219.3 |
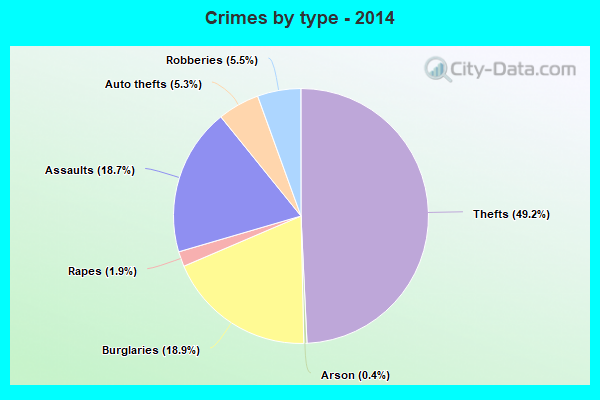
Violent crime rate in 2014
| New Bedford: | 679.0 |
| U.S. Average: | 211.1 |
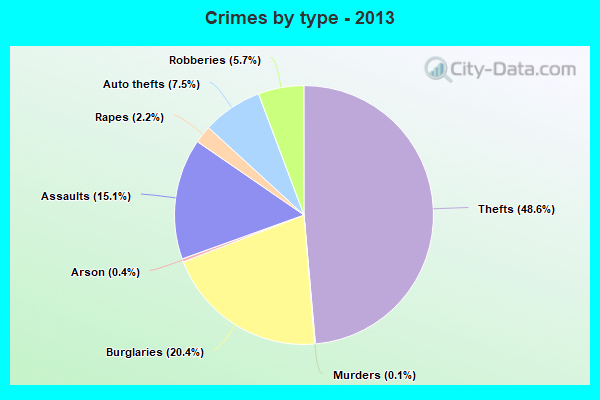
Violent crime rate in 2013
| New Bedford: | 608.5 |
| U.S. Average: | 214.2 |
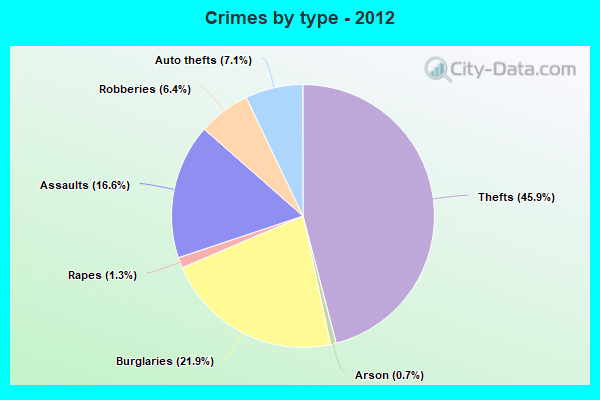
Violent crime rate in 2012
| New Bedford: | 570.6 |
| U.S. Average: | 187.4 |
Violent crime rate in 2011
| New Bedford: | 609.0 |
| U.S. Average: | 187.1 |
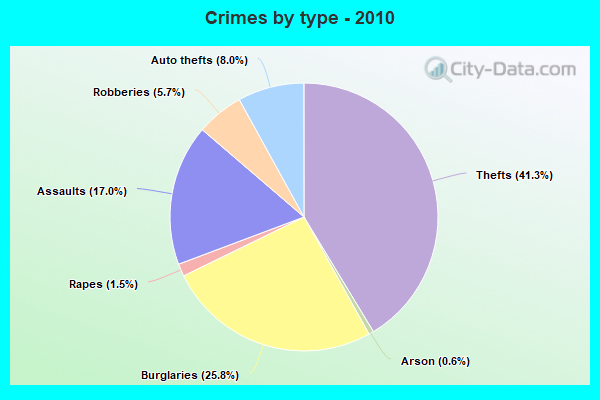
Violent crime rate in 2010
| New Bedford: | 653.7 |
| U.S. Average: | 195.7 |
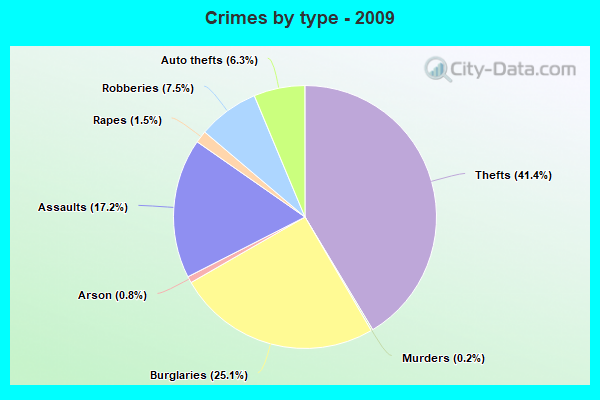
Violent crime rate in 2009
| New Bedford: | 707.2 |
| U.S. Average: | 208.9 |
Violent crime rate in 2008
| New Bedford: | 695.3 |
| U.S. Average: | 222.5 |
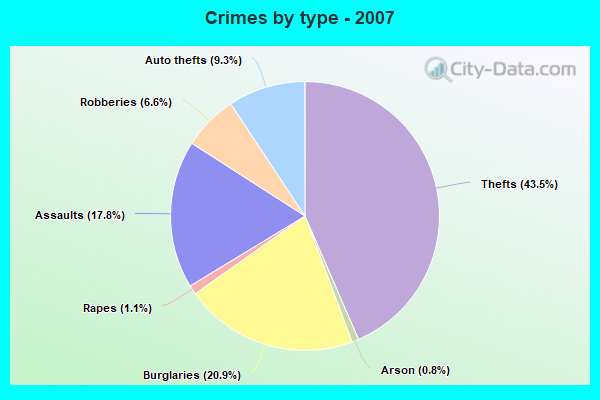
Violent crime rate in 2007
| New Bedford: | 556.1 |
| U.S. Average: | 229.1 |
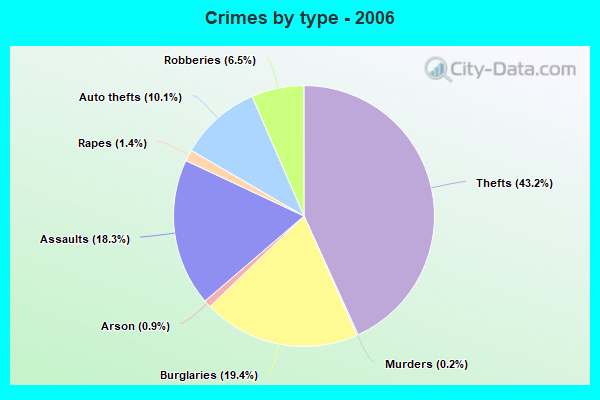
Violent crime rate in 2006
| New Bedford: | 586.8 |
| U.S. Average: | 232.6 |
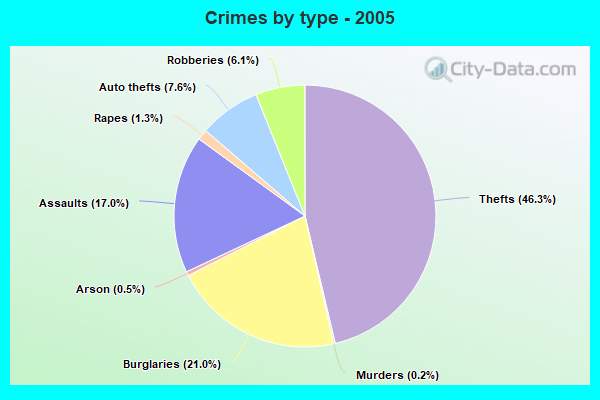
Violent crime rate in 2005
| New Bedford: | 525.9 |
| U.S. Average: | 227.0 |
Property crime rate in 2022
| New Bedford: | 125.7 |
| U.S. Average: | 166.5 |
Property crime rate in 2021
| New Bedford: | 142.7 |
| U.S. Average: | 157.8 |
Property crime rate in 2020
| New Bedford: | 152.0 |
| U.S. Average: | 169.6 |
Property crime rate in 2019
| New Bedford: | 202.1 |
| U.S. Average: | 179.7 |
Property crime rate in 2018
| New Bedford: | 224.0 |
| U.S. Average: | 190.2 |
Property crime rate in 2017
| New Bedford: | 250.7 |
| U.S. Average: | 206.4 |
Property crime rate in 2016
| New Bedford: | 281.6 |
| U.S. Average: | 216.6 |
Property crime rate in 2015
| New Bedford: | 315.8 |
| U.S. Average: | 221.5 |
Property crime rate in 2014
| New Bedford: | 338.0 |
| U.S. Average: | 230.8 |
Property crime rate in 2013
| New Bedford: | 360.8 |
| U.S. Average: | 250.4 |
Property crime rate in 2012
| New Bedford: | 342.9 |
| U.S. Average: | 267.3 |
Property crime rate in 2011
| New Bedford: | 361.8 |
| U.S. Average: | 273.5 |
Property crime rate in 2010
| New Bedford: | 426.8 |
| U.S. Average: | 276.4 |
Property crime rate in 2009
| New Bedford: | 398.2 |
| U.S. Average: | 285.6 |
Property crime rate in 2008
| New Bedford: | 398.3 |
| U.S. Average: | 302.2 |
Property crime rate in 2007
| New Bedford: | 321.9 |
| U.S. Average: | 309.2 |
Property crime rate in 2006
| New Bedford: | 312.6 |
| U.S. Average: | 317.3 |
Property crime rate in 2005
| New Bedford: | 304.2 |
| U.S. Average: | 322.3 |
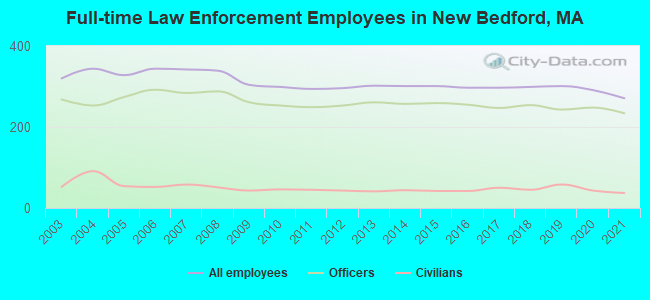
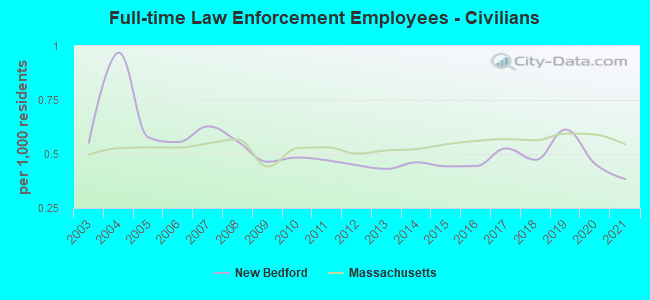
Full-time law enforcement employees in 2021, including police officers: 271 (234 officers - 217 male; 17 female).
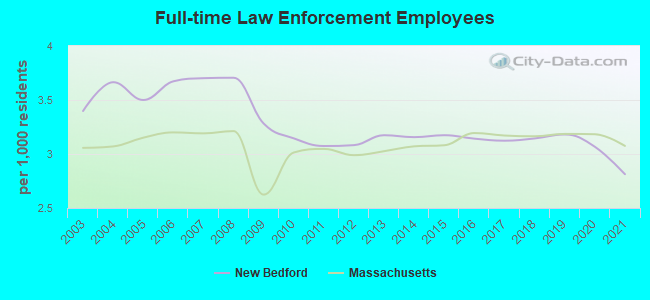
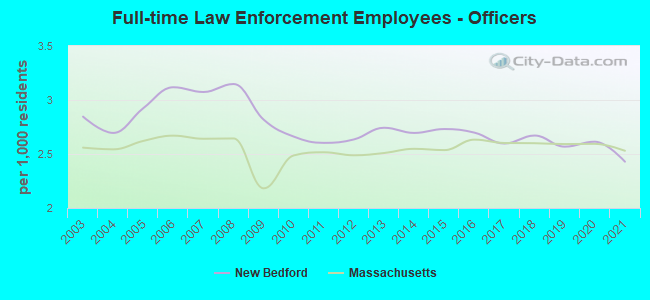
| Officers per 1,000 residents here: | 2.43 |
| Massachusetts average: | 2.53 |
Full-time law enforcement employees in 2020, including police officers: 291 (248 officers - 231 male; 17 female).
| Officers per 1,000 residents here: | 2.61 |
| Massachusetts average: | 2.59 |
Full-time law enforcement employees in 2019, including police officers: 301 (243 officers - 229 male; 14 female).
| Officers per 1,000 residents here: | 2.57 |
| Massachusetts average: | 2.59 |
Full-time law enforcement employees in 2018, including police officers: 299 (254 officers - 237 male; 17 female).
| Officers per 1,000 residents here: | 2.67 |
| Massachusetts average: | 2.60 |
Full-time law enforcement employees in 2017, including police officers: 297 (247 officers - 232 male; 15 female).
| Officers per 1,000 residents here: | 2.60 |
| Massachusetts average: | 2.60 |
Full-time law enforcement employees in 2016, including police officers: 297 (255 officers - 240 male; 15 female).
| Officers per 1,000 residents here: | 2.70 |
| Massachusetts average: | 2.63 |
Full-time law enforcement employees in 2015, including police officers: 301 (259 officers - 244 male; 15 female).
| Officers per 1,000 residents here: | 2.73 |
| Massachusetts average: | 2.54 |
Full-time law enforcement employees in 2014, including police officers: 301 (257 officers - 242 male; 15 female).
| Officers per 1,000 residents here: | 2.69 |
| Massachusetts average: | 2.55 |
Full-time law enforcement employees in 2013, including police officers: 302 (261 officers - 247 male; 14 female).
| Officers per 1,000 residents here: | 2.74 |
| Massachusetts average: | 2.51 |
Full-time law enforcement employees in 2012, including police officers: 296 (253 officers - 240 male; 13 female).
| Officers per 1,000 residents here: | 2.63 |
| Massachusetts average: | 2.49 |
Full-time law enforcement employees in 2011, including police officers: 294 (249 officers - 238 male; 11 female).
| Officers per 1,000 residents here: | 2.60 |
| Massachusetts average: | 2.52 |
Full-time law enforcement employees in 2010, including police officers: 299 (253 officers - 240 male; 13 female).
| Officers per 1,000 residents here: | 2.66 |
| Massachusetts average: | 2.49 |
Full-time law enforcement employees in 2009, including police officers: 304 (261 officers - 247 male; 14 female).
| Officers per 1,000 residents here: | 2.82 |
| Massachusetts average: | 2.18 |
Full-time law enforcement employees in 2008, including police officers: 339 (288 officers - 268 male; 20 female).
| Officers per 1,000 residents here: | 3.15 |
| Massachusetts average: | 2.64 |
Full-time law enforcement employees in 2007, including police officers: 342 (284 officers - 264 male; 20 female).
| Officers per 1,000 residents here: | 3.07 |
| Massachusetts average: | 2.64 |
Full-time law enforcement employees in 2006, including police officers: 344 (292 officers - 269 male; 23 female).
| Officers per 1,000 residents here: | 3.12 |
| Massachusetts average: | 2.67 |
Full-time law enforcement employees in 2005, including police officers: 328 (274 officers - 248 male; 26 female).
| Officers per 1,000 residents here: | 2.92 |
| Massachusetts average: | 2.62 |
Full-time law enforcement employees in 2004, including police officers: 344 (253 officers - 231 male; 22 female).
| Officers per 1,000 residents here: | 2.70 |
| Massachusetts average: | 2.54 |
Full-time law enforcement employees in 2003, including police officers: 320 (268 officers - 244 male; 24 female).
| Officers per 1,000 residents here: | 2.85 |
| Massachusetts average: | 2.56 |