Crime rate in New Haven, Connecticut (CT): murders, rapes, robberies, assaults, burglaries, thefts, auto thefts, arson, law enforcement employees, police officers, crime map
Crime rate in New Haven, CT
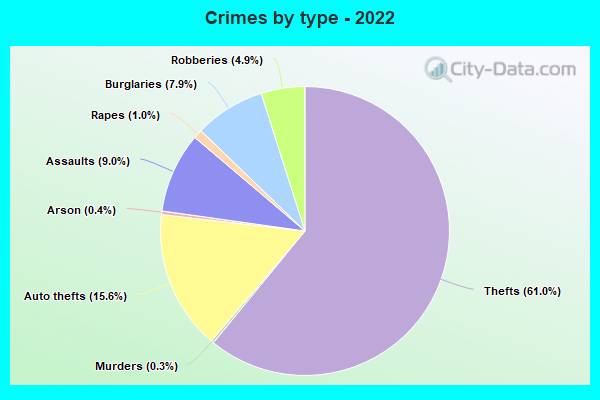
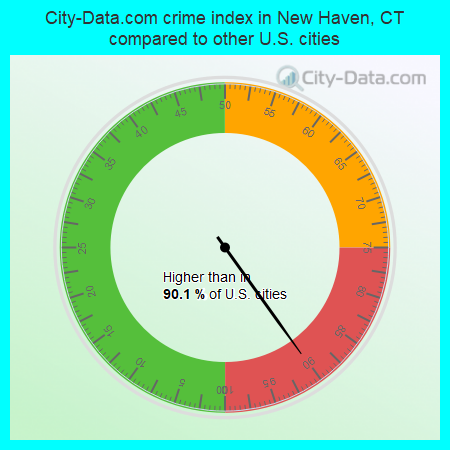
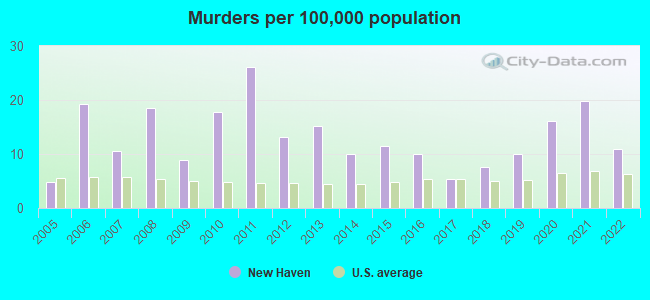
The 2022 crime rate in New Haven, CT is 325 (City-Data.com crime index), which is 1.3 times greater than the U.S. average. It was higher than in 90.1% U.S. cities. The 2022 New Haven crime rate fell by 12% compared to 2021. The number of homicides stood at 15 - a decrease of 11 compared to 2021. In the last 5 years New Haven has seen decline of violent crime and decline of property crime.See how dangerous New Haven, CT is compared to the nearest cities:
(Note: Higher means more crime)
(Note: Higher means more crime)
| New Haven: | 325.5 |
| East Haven: | 174.6 |
| West Haven: | 137.4 |
| Hamden: | 220.4 |
| Woodbridge: | 63.0 |
| Orange: | 199.4 |
| North Haven: | 161.4 |
| Branford: | 126.4 |
| North Branford: | 45.2 |
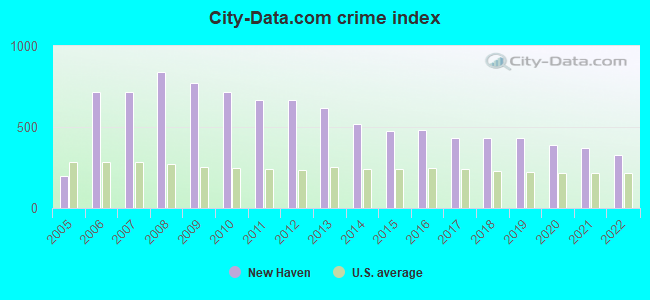
The City-Data.com crime index weighs serious crimes and violent crimes more heavily. Higher means more crime, U.S. average is 246.1. It adjusts for the number of visitors and daily workers commuting into cities.
- means the value is smaller than the state average.- means the value is about the same as the state average.
- means the value is bigger than the state average.
- means the value is much bigger than the state average.
According to our research of Connecticut and other state lists, there were 448 registered sex offenders living in New Haven, Connecticut as of May 22, 2024.
The ratio of all residents to sex offenders in New Haven is 290 to 1.
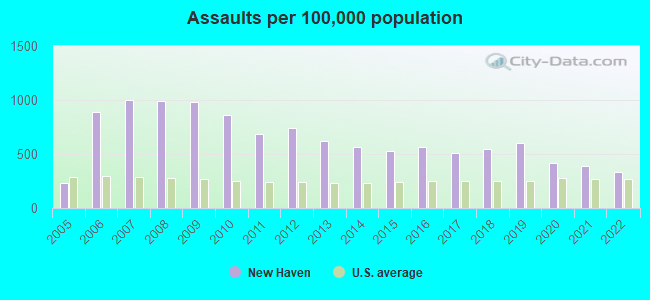
Violent crime rate in 2022
| New Haven: | 311.7 |
| U.S. Average: | 219.8 |
Violent crime rate in 2021
| New Haven: | 366.7 |
| U.S. Average: | 224.8 |
Violent crime rate in 2020
| New Haven: | 392.9 |
| U.S. Average: | 228.2 |
Violent crime rate in 2019
| New Haven: | 479.7 |
| U.S. Average: | 219.9 |
Violent crime rate in 2018
| New Haven: | 460.4 |
| U.S. Average: | 221.2 |
Violent crime rate in 2017
| New Haven: | 452.1 |
| U.S. Average: | 226.2 |
Violent crime rate in 2016
| New Haven: | 510.6 |
| U.S. Average: | 227.3 |
Violent crime rate in 2015
| New Haven: | 512.6 |
| U.S. Average: | 219.3 |
Violent crime rate in 2014
| New Haven: | 590.6 |
| U.S. Average: | 211.1 |
Violent crime rate in 2013
| New Haven: | 700.8 |
| U.S. Average: | 214.2 |
Violent crime rate in 2012
| New Haven: | 766.5 |
| U.S. Average: | 187.4 |
Violent crime rate in 2011
| New Haven: | 736.4 |
| U.S. Average: | 187.1 |
Violent crime rate in 2010
| New Haven: | 821.8 |
| U.S. Average: | 195.7 |
Violent crime rate in 2009
| New Haven: | 925.5 |
| U.S. Average: | 208.9 |
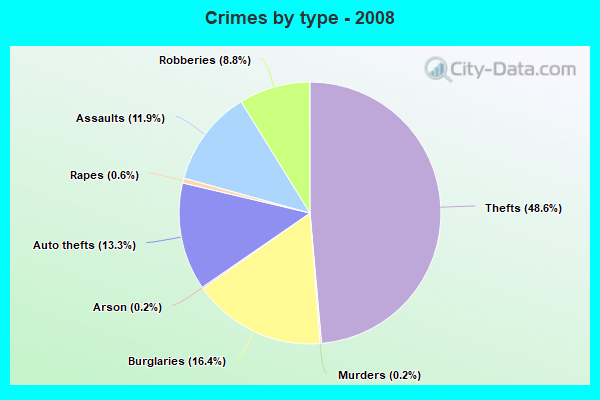
Violent crime rate in 2008
| New Haven: | 948.7 |
| U.S. Average: | 222.5 |
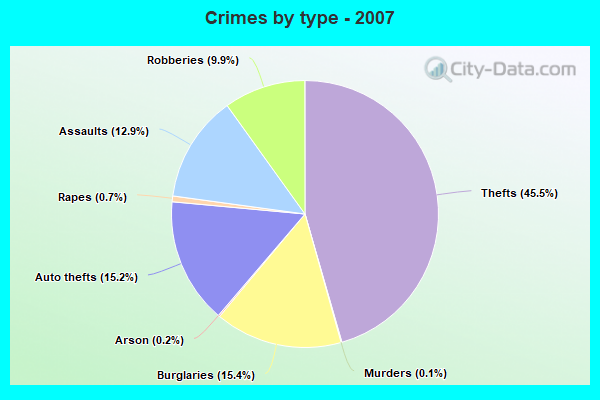
Violent crime rate in 2007
| New Haven: | 843.5 |
| U.S. Average: | 229.1 |
Violent crime rate in 2006
| New Haven: | 814.1 |
| U.S. Average: | 232.6 |
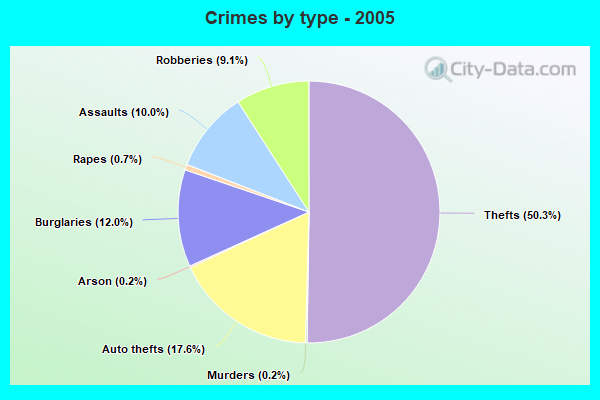
Violent crime rate in 2005
| New Haven: | 213.0 |
| U.S. Average: | 227.0 |
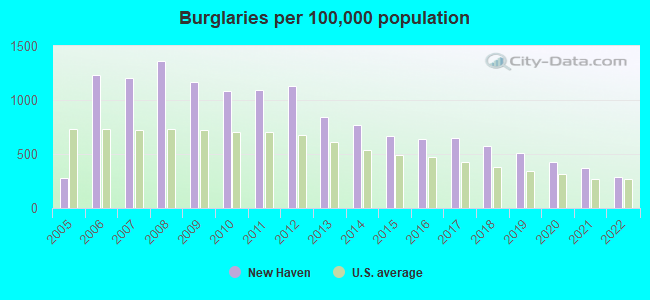
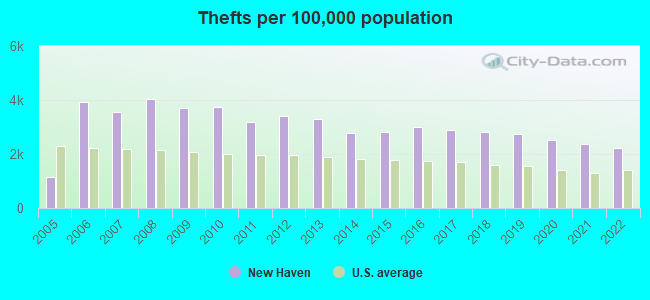
Property crime rate in 2022
| New Haven: | 255.8 |
| U.S. Average: | 166.5 |
Property crime rate in 2021
| New Haven: | 272.6 |
| U.S. Average: | 157.8 |
Property crime rate in 2020
| New Haven: | 299.0 |
| U.S. Average: | 169.6 |
Property crime rate in 2019
| New Haven: | 321.1 |
| U.S. Average: | 179.7 |
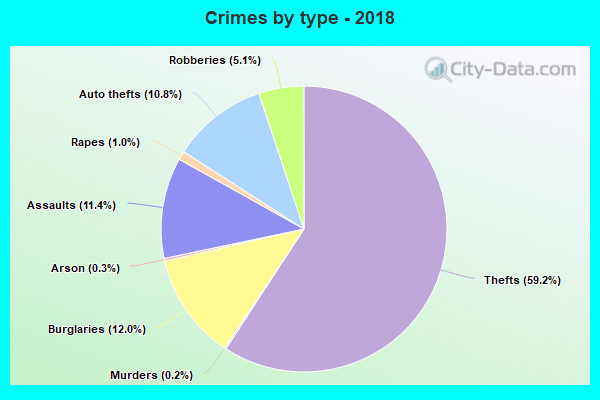
Property crime rate in 2018
| New Haven: | 334.0 |
| U.S. Average: | 190.2 |
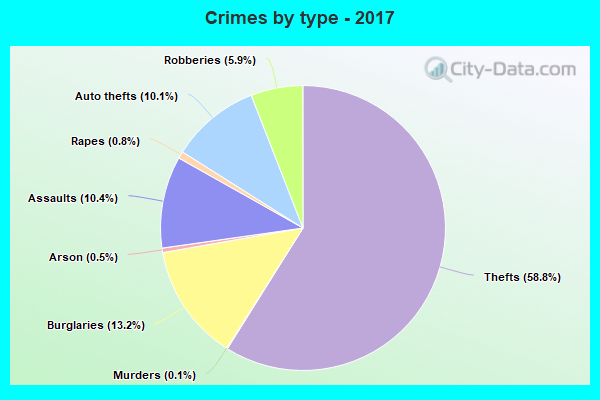
Property crime rate in 2017
| New Haven: | 347.4 |
| U.S. Average: | 206.4 |
Property crime rate in 2016
| New Haven: | 362.7 |
| U.S. Average: | 216.6 |
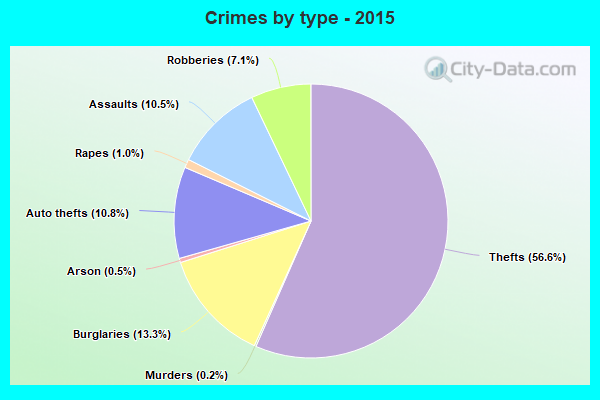
Property crime rate in 2015
| New Haven: | 355.3 |
| U.S. Average: | 221.5 |
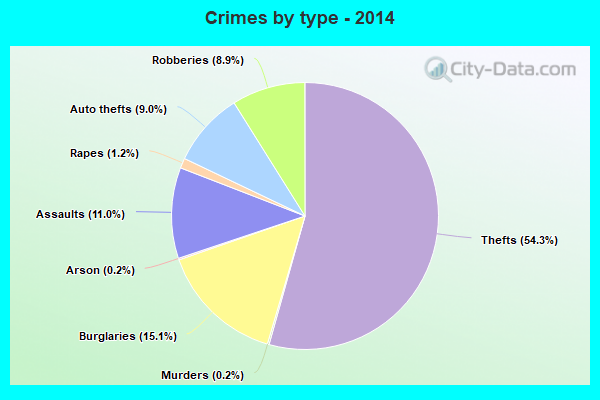
Property crime rate in 2014
| New Haven: | 360.8 |
| U.S. Average: | 230.8 |
Property crime rate in 2013
| New Haven: | 420.0 |
| U.S. Average: | 250.4 |
Property crime rate in 2012
| New Haven: | 479.6 |
| U.S. Average: | 267.3 |
Property crime rate in 2011
| New Haven: | 486.0 |
| U.S. Average: | 273.5 |
Property crime rate in 2010
| New Haven: | 519.3 |
| U.S. Average: | 276.4 |
Property crime rate in 2009
| New Haven: | 550.5 |
| U.S. Average: | 285.6 |
Property crime rate in 2008
| New Haven: | 640.4 |
| U.S. Average: | 302.2 |
Property crime rate in 2007
| New Haven: | 520.7 |
| U.S. Average: | 309.2 |
Property crime rate in 2006
| New Haven: | 519.8 |
| U.S. Average: | 317.3 |
Property crime rate in 2005
| New Haven: | 151.3 |
| U.S. Average: | 322.3 |

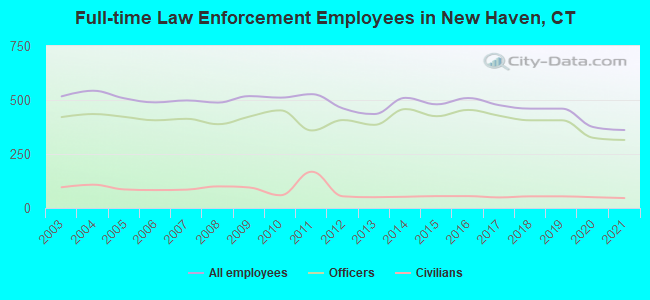
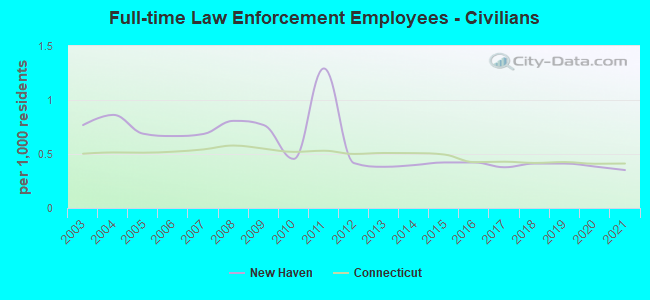
Full-time law enforcement employees in 2021, including police officers: 361 (315 officers - 263 male; 52 female).
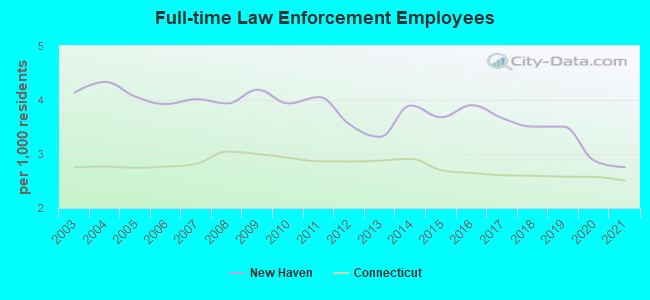
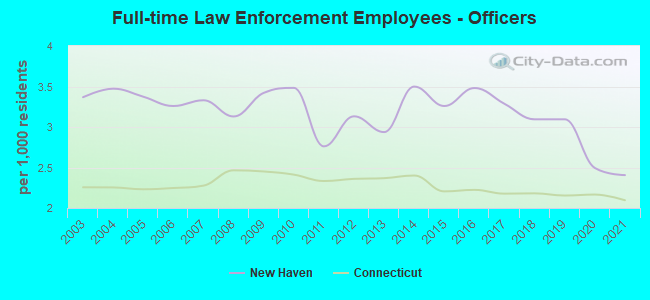
| Officers per 1,000 residents here: | 2.41 |
| Connecticut average: | 2.10 |
Full-time law enforcement employees in 2020, including police officers: 375 (325 officers - 271 male; 54 female).
| Officers per 1,000 residents here: | 2.49 |
| Connecticut average: | 2.17 |
Full-time law enforcement employees in 2018, including police officers: 460 (406 officers - 341 male; 65 female).
| Officers per 1,000 residents here: | 3.09 |
| Connecticut average: | 2.18 |
Full-time law enforcement employees in 2017, including police officers: 476 (427 officers - 359 male; 68 female).
| Officers per 1,000 residents here: | 3.29 |
| Connecticut average: | 2.18 |
Full-time law enforcement employees in 2016, including police officers: 509 (454 officers - 385 male; 69 female).
| Officers per 1,000 residents here: | 3.48 |
| Connecticut average: | 2.22 |
Full-time law enforcement employees in 2015, including police officers: 480 (425 officers - 360 male; 65 female).
| Officers per 1,000 residents here: | 3.26 |
| Connecticut average: | 2.21 |
Full-time law enforcement employees in 2014, including police officers: 510 (458 officers - 389 male; 69 female).
| Officers per 1,000 residents here: | 3.50 |
| Connecticut average: | 2.40 |
Full-time law enforcement employees in 2013, including police officers: 435 (385 officers - 325 male; 60 female).
| Officers per 1,000 residents here: | 2.94 |
| Connecticut average: | 2.37 |
Full-time law enforcement employees in 2012, including police officers: 461 (407 officers - 343 male; 64 female).
| Officers per 1,000 residents here: | 3.13 |
| Connecticut average: | 2.36 |
Full-time law enforcement employees in 2011, including police officers: 527 (359 officers - 299 male; 60 female).
| Officers per 1,000 residents here: | 2.76 |
| Connecticut average: | 2.33 |
Full-time law enforcement employees in 2010, including police officers: 511 (452 officers - 377 male; 75 female).
| Officers per 1,000 residents here: | 3.48 |
| Connecticut average: | 2.41 |
Full-time law enforcement employees in 2009, including police officers: 518 (423 officers - 354 male; 69 female).
| Officers per 1,000 residents here: | 3.42 |
| Connecticut average: | 2.45 |
Full-time law enforcement employees in 2008, including police officers: 488 (388 officers - 321 male; 67 female).
| Officers per 1,000 residents here: | 3.13 |
| Connecticut average: | 2.47 |
Full-time law enforcement employees in 2007, including police officers: 498 (413 officers - 340 male; 73 female).
| Officers per 1,000 residents here: | 3.33 |
| Connecticut average: | 2.28 |
Full-time law enforcement employees in 2006, including police officers: 489 (406 officers - 328 male; 78 female).
| Officers per 1,000 residents here: | 3.26 |
| Connecticut average: | 2.25 |
Full-time law enforcement employees in 2005, including police officers: 508 (422 officers - 344 male; 78 female).
| Officers per 1,000 residents here: | 3.37 |
| Connecticut average: | 2.23 |
Full-time law enforcement employees in 2004, including police officers: 543 (435 officers - 355 male; 80 female).
| Officers per 1,000 residents here: | 3.47 |
| Connecticut average: | 2.25 |
Full-time law enforcement employees in 2003, including police officers: 517 (421 officers - 341 male; 80 female).
| Officers per 1,000 residents here: | 3.37 |
| Connecticut average: | 2.26 |