Crime rate in Orange, Ohio (OH): murders, rapes, robberies, assaults, burglaries, thefts, auto thefts, arson, law enforcement employees, police officers, crime map
Crime rate in Orange, OH
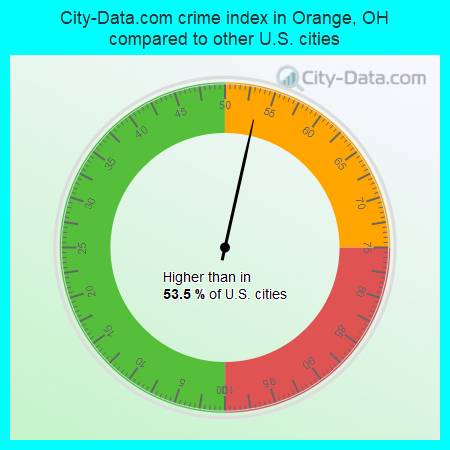
The 2022 crime rate in Orange, OH is 112 (City-Data.com crime index), which is 2.2 times lower than the U.S. average. It was higher than in 54.4% U.S. cities. The 2022 Orange crime rate rose by 1262% compared to 2014.See how dangerous Orange, OH is compared to the nearest cities:
(Note: Higher means more crime)
(Note: Higher means more crime)
| Orange: | 112.0 |
| Woodmere: | 249.1 |
| Pepper Pike: | 36.9 |
| Warrensville Heights: | 312.7 |
| Highland Hills: | 100.1 |
| Moreland Hills: | 18.7 |
| Beachwood: | 200.6 |
| North Randall: | 37.0 |
| Bedford Heights: | 234.9 |
Type |
2009 |
2010 |
2011 |
2012 |
2013 |
2014 |
2022 |
|---|---|---|---|---|---|---|---|
| Murders (per 100,000) | 0 (0.0) | 0 (0.0) | 0 (0.0) | 0 (0.0) | 0 (0.0) | 0 (0.0) | 0 (0.0) |
| Rapes (per 100,000) | 0 (0.0) | 0 (0.0) | 0 (0.0) | 0 (0.0) | 0 (0.0) | 0 (0.0) | 0 (0.0) |
| Robberies (per 100,000) | 0 (0.0) | 0 (0.0) | 0 (0.0) | 1 (30.3) | 0 (0.0) | 0 (0.0) | 1 (29.1) |
| Assaults (per 100,000) | 0 (0.0) | 2 (60.2) | 1 (30.1) | 1 (30.3) | 1 (30.4) | 0 (0.0) | 10 (291.0) |
| Burglaries (per 100,000) | 5 (153.9) | 3 (90.3) | 6 (180.5) | 3 (91.0) | 5 (152.1) | 1 (30.5) | 1 (29.1) |
| Thefts (per 100,000) | 16 (492.5) | 12 (361.1) | 7 (210.5) | 9 (273.0) | 10 (304.2) | 1 (30.5) | 33 (960.1) |
| Auto thefts (per 100,000) | 6 (184.7) | 1 (30.1) | 4 (120.3) | 1 (30.3) | 2 (60.8) | 2 (60.9) | 2 (58.2) |
| Arson (per 100,000) | 0 (0.0) | 0 (0.0) | 0 (0.0) | 1 (30.3) | 0 (0.0) | 0 (0.0) | 0 (0.0) |
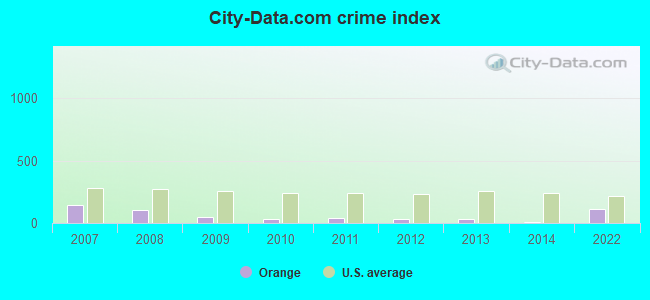
| City-Data.com crime index | 45.2 | 35.2 | 36.7 | 34.9 | 33.8 | 8.2 | 112.0 |
The City-Data.com crime index weighs serious crimes and violent crimes more heavily. Higher means more crime, U.S. average is 246.1. It adjusts for the number of visitors and daily workers commuting into cities.
Violent crime rate in 2022
| Orange: | 160.0 |
| U.S. Average: | 219.8 |
Violent crime rate in 2014
| Orange: | 0.0 |
| U.S. Average: | 211.1 |
Violent crime rate in 2013
| Orange: | 15.2 |
| U.S. Average: | 214.2 |
Violent crime rate in 2012
| Orange: | 30.3 |
| U.S. Average: | 187.4 |
Violent crime rate in 2011
| Orange: | 15.0 |
| U.S. Average: | 187.1 |
Violent crime rate in 2010
| Orange: | 30.1 |
| U.S. Average: | 195.7 |
Violent crime rate in 2009
| Orange: | 0.0 |
| U.S. Average: | 208.9 |
Violent crime rate in 2008
| Orange: | 76.2 |
| U.S. Average: | 222.5 |
Violent crime rate in 2007
| Orange: | 120.4 |
| U.S. Average: | 229.1 |
Property crime rate in 2022
| Orange: | 62.6 |
| U.S. Average: | 166.5 |
Property crime rate in 2014
| Orange: | 16.8 |
| U.S. Average: | 230.8 |
Property crime rate in 2013
| Orange: | 54.8 |
| U.S. Average: | 250.4 |
Property crime rate in 2012
| Orange: | 36.4 |
| U.S. Average: | 267.3 |
Property crime rate in 2011
| Orange: | 64.7 |
| U.S. Average: | 273.5 |
Property crime rate in 2010
| Orange: | 40.6 |
| U.S. Average: | 276.4 |
Property crime rate in 2009
| Orange: | 83.1 |
| U.S. Average: | 285.6 |
Property crime rate in 2008
| Orange: | 109.8 |
| U.S. Average: | 302.2 |
Property crime rate in 2007
| Orange: | 130.9 |
| U.S. Average: | 309.2 |


Full-time law enforcement employees in 2015, including police officers: 16 (15 officers - 14 male; 1 female).
| Officers per 1,000 residents here: | 4.59 |
| Ohio average: | 2.00 |
Full-time law enforcement employees in 2013, including police officers: 15 (14 officers - 13 male; 1 female).
| Officers per 1,000 residents here: | 4.26 |
| Ohio average: | 2.45 |
Full-time law enforcement employees in 2012, including police officers: 14 (13 officers - 12 male; 1 female).
| Officers per 1,000 residents here: | 3.94 |
| Ohio average: | 1.99 |
Full-time law enforcement employees in 2011, including police officers: 15 (14 officers - 13 male; 1 female).
| Officers per 1,000 residents here: | 4.21 |
| Ohio average: | 2.11 |
Full-time law enforcement employees in 2010, including police officers: 15 (14 officers - 13 male; 1 female).
| Officers per 1,000 residents here: | 4.21 |
| Ohio average: | 2.11 |
Full-time law enforcement employees in 2009, including police officers: 15 (14 officers - 13 male; 1 female).
| Officers per 1,000 residents here: | 4.31 |
| Ohio average: | 2.15 |
Full-time law enforcement employees in 2008, including police officers: 15 (14 officers - 13 male; 1 female).
| Officers per 1,000 residents here: | 4.27 |
| Ohio average: | 2.25 |
Full-time law enforcement employees in 2007, including police officers: 15 (14 officers - 13 male; 1 female).
| Officers per 1,000 residents here: | 4.22 |
| Ohio average: | 2.17 |


Zip codes: 44022.