Crime rate in Overland Park, Kansas (KS): murders, rapes, robberies, assaults, burglaries, thefts, auto thefts, arson, law enforcement employees, police officers, crime map
Crime rate in Overland Park, KS
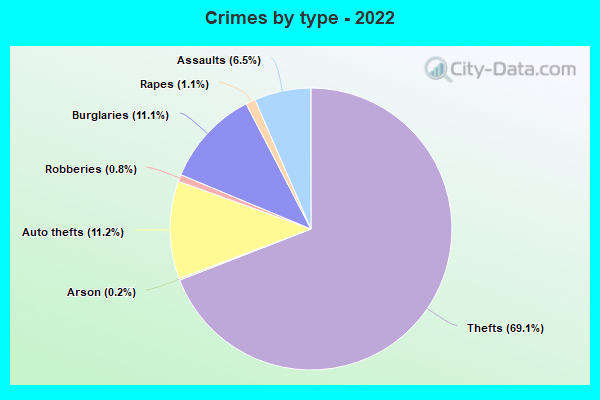
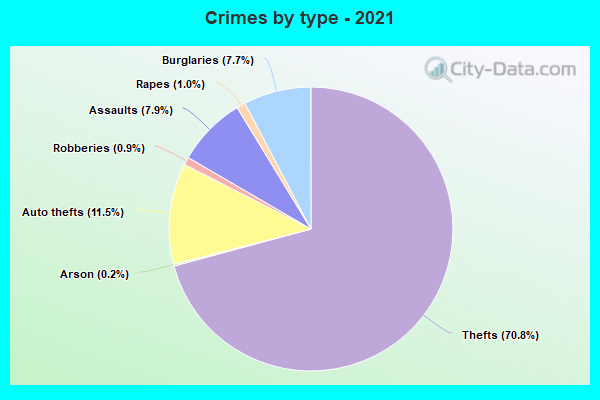
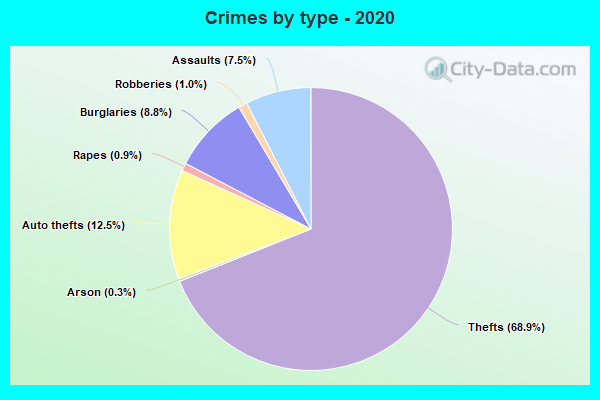
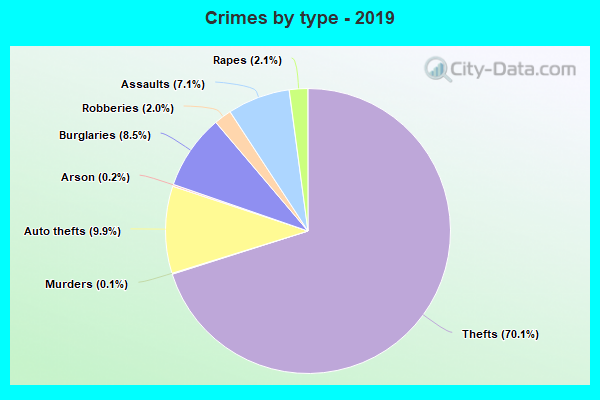
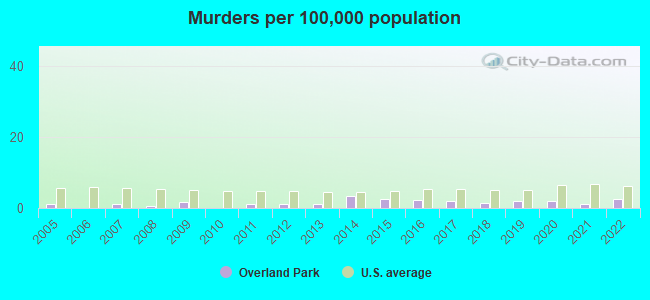
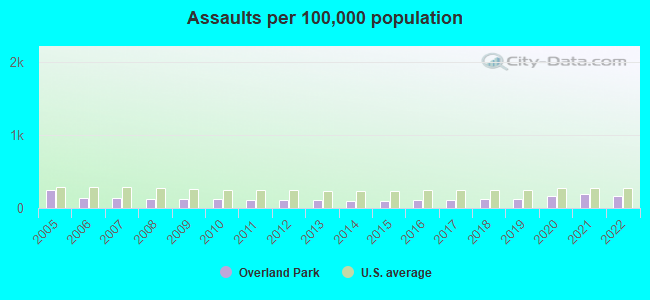
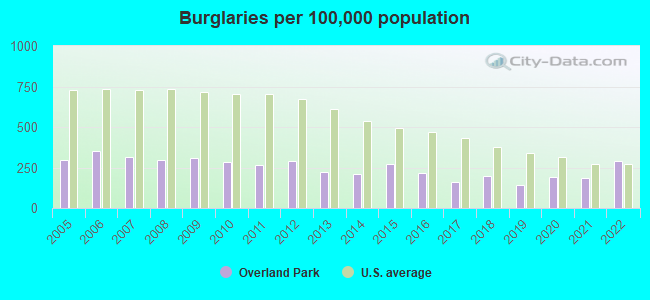
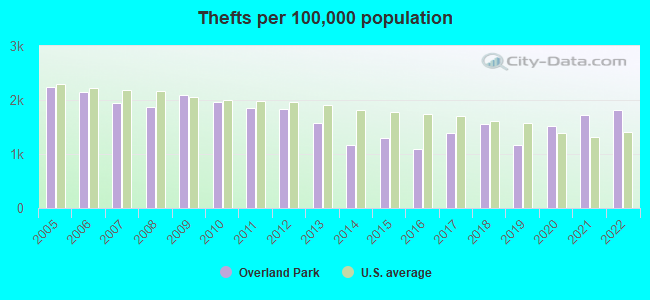
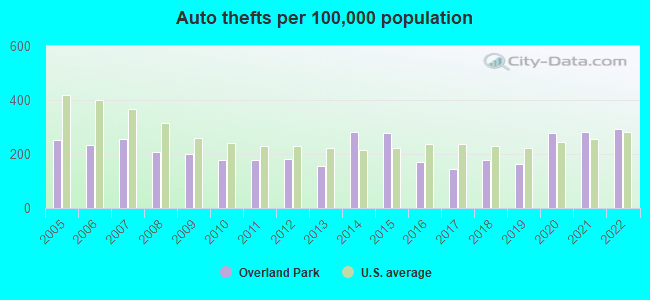
The 2022 crime rate in Overland Park, KS is 185 (City-Data.com crime index), which is 1.3 times smaller than the U.S. average. It was higher than in 72.2% U.S. cities. The 2022 Overland Park crime rate rose by 8% compared to 2021. The number of homicides stood at 5 - an increase of 3 compared to 2021. In the last 5 years Overland Park has seen decline of violent crime and rise of property crime.See how dangerous Overland Park, KS is compared to the nearest cities:
(Note: Higher means more crime)
(Note: Higher means more crime)
| Overland Park: | 184.5 |
| Leawood: | 121.4 |
| Prairie Village: | 110.7 |
| Lenexa: | 147.3 |
| Merriam: | 473.6 |
| Mission: | 399.2 |
| Mission Hills: | 174.6 |
| Fairway: | 82.0 |
| Shawnee: | 146.8 |
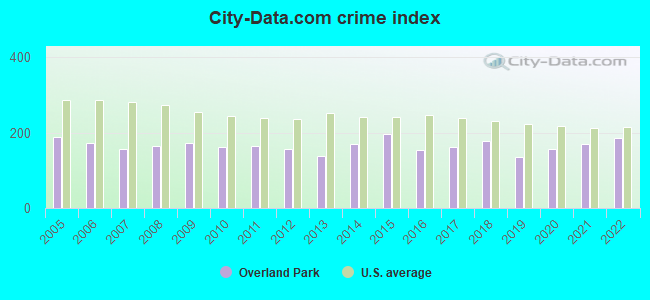
The City-Data.com crime index weighs serious crimes and violent crimes more heavily. Higher means more crime, U.S. average is 246.1. It adjusts for the number of visitors and daily workers commuting into cities.
- means the value is smaller than the state average.- means the value is about the same as the state average.
- means the value is bigger than the state average.
- means the value is much bigger than the state average.
According to our research of Kansas and other state lists, there were 132 registered sex offenders living in Overland Park, Kansas as of May 09, 2024.
The ratio of all residents to sex offenders in Overland Park is 1,431 to 1.
The ratio of registered sex offenders to all residents in this city is much lower than the state average.
Violent crime rate in 2022
| Overland Park: | 129.2 |
| U.S. Average: | 219.8 |
Violent crime rate in 2021
| Overland Park: | 133.6 |
| U.S. Average: | 224.8 |
Violent crime rate in 2020
| Overland Park: | 118.2 |
| U.S. Average: | 228.2 |
Violent crime rate in 2019
| Overland Park: | 114.9 |
| U.S. Average: | 219.9 |
Violent crime rate in 2018
| Overland Park: | 146.7 |
| U.S. Average: | 221.2 |
Violent crime rate in 2017
| Overland Park: | 135.7 |
| U.S. Average: | 226.2 |
Violent crime rate in 2016
| Overland Park: | 131.1 |
| U.S. Average: | 227.3 |
Violent crime rate in 2015
| Overland Park: | 154.9 |
| U.S. Average: | 219.3 |
Violent crime rate in 2014
| Overland Park: | 128.9 |
| U.S. Average: | 211.1 |
Violent crime rate in 2013
| Overland Park: | 89.4 |
| U.S. Average: | 214.2 |
Violent crime rate in 2012
| Overland Park: | 93.5 |
| U.S. Average: | 187.4 |
Violent crime rate in 2011
| Overland Park: | 101.7 |
| U.S. Average: | 187.1 |
Violent crime rate in 2010
| Overland Park: | 94.9 |
| U.S. Average: | 195.7 |
Violent crime rate in 2009
| Overland Park: | 99.3 |
| U.S. Average: | 208.9 |
Violent crime rate in 2008
| Overland Park: | 99.8 |
| U.S. Average: | 222.5 |
Violent crime rate in 2007
| Overland Park: | 93.9 |
| U.S. Average: | 229.1 |
Violent crime rate in 2006
| Overland Park: | 103.3 |
| U.S. Average: | 232.6 |
Violent crime rate in 2005
| Overland Park: | 146.5 |
| U.S. Average: | 227.0 |
Property crime rate in 2022
| Overland Park: | 192.7 |
| U.S. Average: | 166.5 |
Property crime rate in 2021
| Overland Park: | 166.2 |
| U.S. Average: | 157.8 |
Property crime rate in 2020
| Overland Park: | 156.0 |
| U.S. Average: | 169.6 |
Property crime rate in 2019
| Overland Park: | 111.3 |
| U.S. Average: | 179.7 |
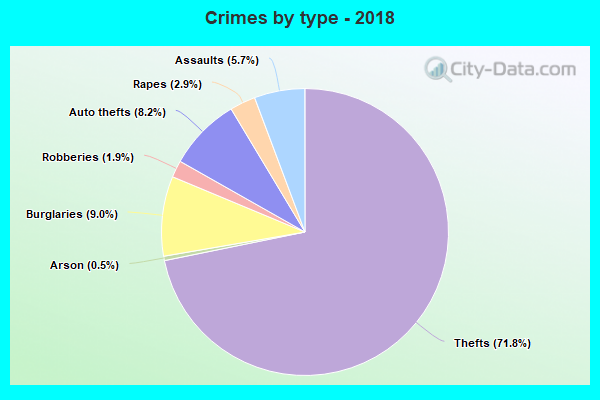
Property crime rate in 2018
| Overland Park: | 143.4 |
| U.S. Average: | 190.2 |
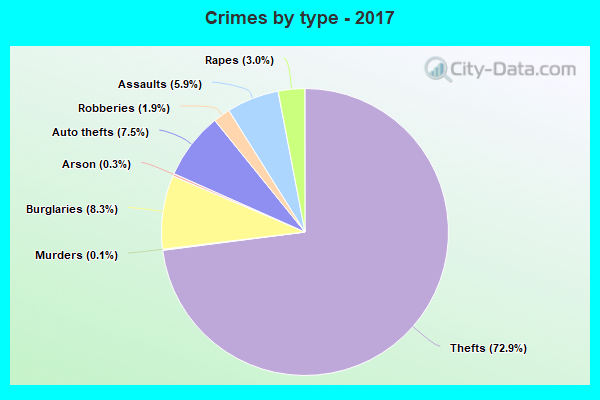
Property crime rate in 2017
| Overland Park: | 122.3 |
| U.S. Average: | 206.4 |
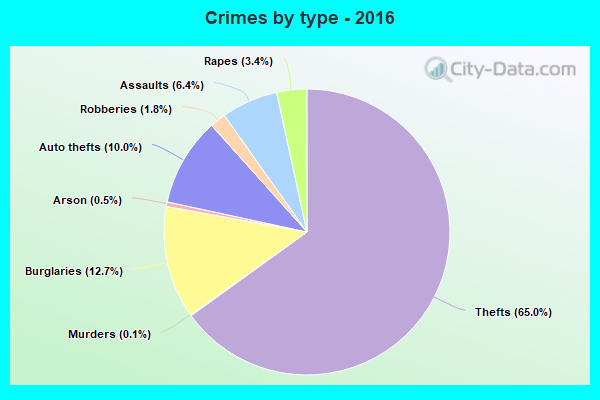
Property crime rate in 2016
| Overland Park: | 123.2 |
| U.S. Average: | 216.6 |
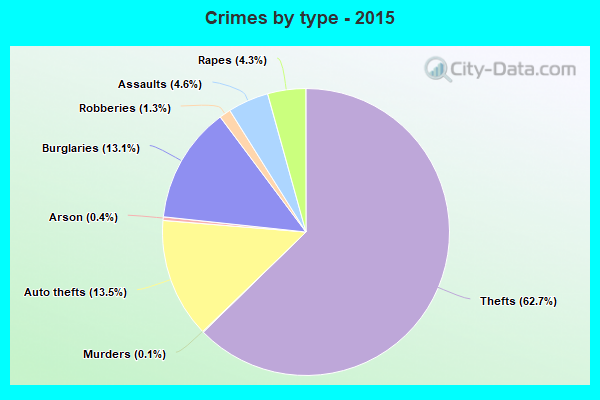
Property crime rate in 2015
| Overland Park: | 160.3 |
| U.S. Average: | 221.5 |
Property crime rate in 2014
| Overland Park: | 142.6 |
| U.S. Average: | 230.8 |
Property crime rate in 2013
| Overland Park: | 146.8 |
| U.S. Average: | 250.4 |
Property crime rate in 2012
| Overland Park: | 177.3 |
| U.S. Average: | 267.3 |
Property crime rate in 2011
| Overland Park: | 173.1 |
| U.S. Average: | 273.5 |
Property crime rate in 2010
| Overland Park: | 180.8 |
| U.S. Average: | 276.4 |
Property crime rate in 2009
| Overland Park: | 195.7 |
| U.S. Average: | 285.6 |
Property crime rate in 2008
| Overland Park: | 184.2 |
| U.S. Average: | 302.2 |
Property crime rate in 2007
| Overland Park: | 179.2 |
| U.S. Average: | 309.2 |
Property crime rate in 2006
| Overland Park: | 192.1 |
| U.S. Average: | 317.3 |
Property crime rate in 2005
| Overland Park: | 189.1 |
| U.S. Average: | 322.3 |
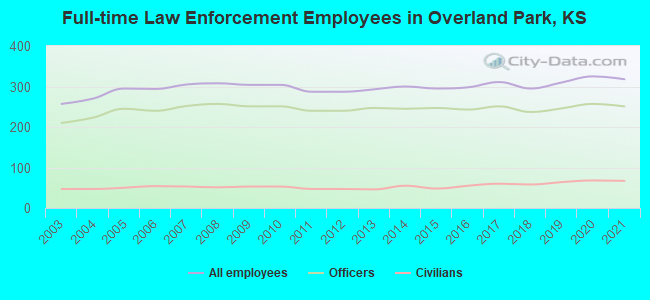
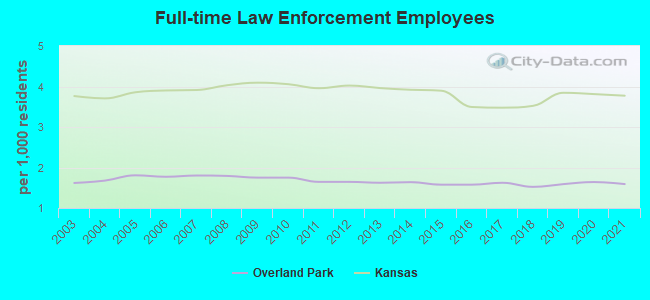
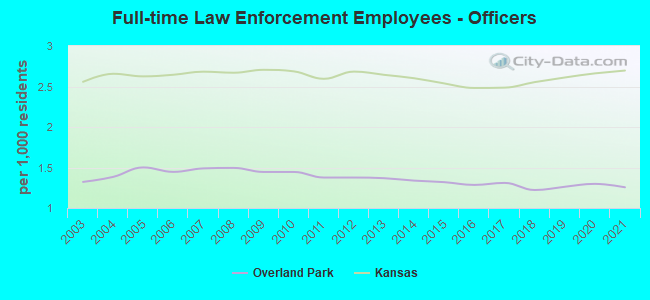
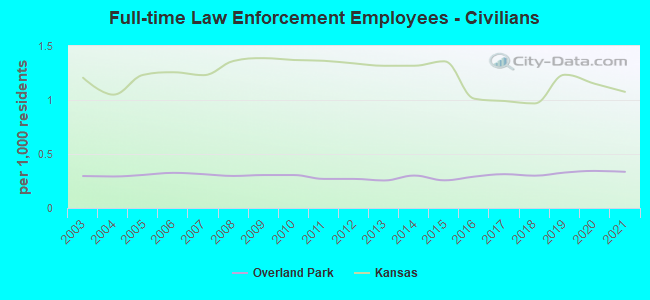
Full-time law enforcement employees in 2021, including police officers: 318 (251 officers - 213 male; 38 female).
| Officers per 1,000 residents here: | 1.26 |
| Kansas average: | 2.70 |
Full-time law enforcement employees in 2020, including police officers: 325 (257 officers - 217 male; 40 female).
| Officers per 1,000 residents here: | 1.30 |
| Kansas average: | 2.66 |
Full-time law enforcement employees in 2019, including police officers: 310 (246 officers - 212 male; 34 female).
| Officers per 1,000 residents here: | 1.26 |
| Kansas average: | 2.61 |
Full-time law enforcement employees in 2018, including police officers: 295 (237 officers - 204 male; 33 female).
| Officers per 1,000 residents here: | 1.22 |
| Kansas average: | 2.55 |
Full-time law enforcement employees in 2017, including police officers: 311 (251 officers - 214 male; 37 female).
| Officers per 1,000 residents here: | 1.31 |
| Kansas average: | 2.49 |
Full-time law enforcement employees in 2016, including police officers: 298 (243 officers - 205 male; 38 female).
| Officers per 1,000 residents here: | 1.29 |
| Kansas average: | 2.48 |
Full-time law enforcement employees in 2015, including police officers: 295 (247 officers - 207 male; 40 female).
| Officers per 1,000 residents here: | 1.32 |
| Kansas average: | 2.54 |
Full-time law enforcement employees in 2014, including police officers: 300 (245 officers - 204 male; 41 female).
| Officers per 1,000 residents here: | 1.34 |
| Kansas average: | 2.60 |
Full-time law enforcement employees in 2013, including police officers: 293 (247 officers - 210 male; 37 female).
| Officers per 1,000 residents here: | 1.37 |
| Kansas average: | 2.64 |
Full-time law enforcement employees in 2011, including police officers: 287 (240 officers - 202 male; 38 female).
| Officers per 1,000 residents here: | 1.38 |
| Kansas average: | 2.59 |
Full-time law enforcement employees in 2009, including police officers: 304 (251 officers - 204 male; 47 female).
| Officers per 1,000 residents here: | 1.45 |
| Kansas average: | 2.71 |
Full-time law enforcement employees in 2008, including police officers: 308 (257 officers - 211 male; 46 female).
| Officers per 1,000 residents here: | 1.49 |
| Kansas average: | 2.67 |
Full-time law enforcement employees in 2007, including police officers: 305 (252 officers - 206 male; 46 female).
| Officers per 1,000 residents here: | 1.49 |
| Kansas average: | 2.68 |
Full-time law enforcement employees in 2006, including police officers: 294 (240 officers - 195 male; 45 female).
| Officers per 1,000 residents here: | 1.45 |
| Kansas average: | 2.65 |
Full-time law enforcement employees in 2005, including police officers: 295 (245 officers - 201 male; 44 female).
| Officers per 1,000 residents here: | 1.50 |
| Kansas average: | 2.63 |
Full-time law enforcement employees in 2004, including police officers: 270 (223 officers - 186 male; 37 female).
| Officers per 1,000 residents here: | 1.38 |
| Kansas average: | 2.66 |
Full-time law enforcement employees in 2003, including police officers: 257 (210 officers - 179 male; 31 female).
| Officers per 1,000 residents here: | 1.32 |
| Kansas average: | 2.56 |