Crime rate in Pine Bluff, Arkansas (AR): murders, rapes, robberies, assaults, burglaries, thefts, auto thefts, arson, law enforcement employees, police officers, crime map
Crime rate in Pine Bluff, AR
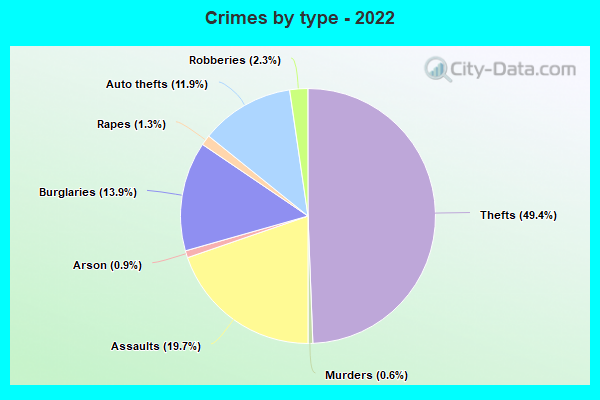
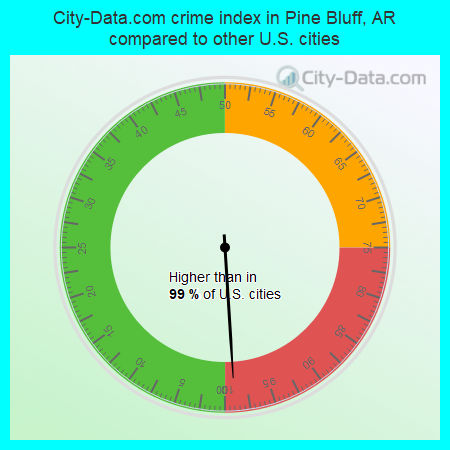
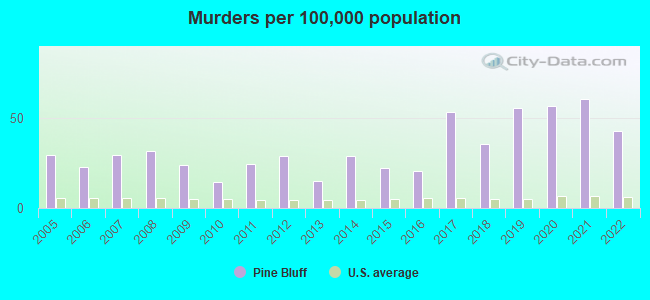
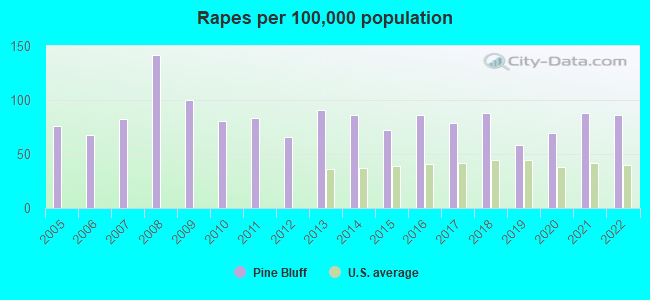
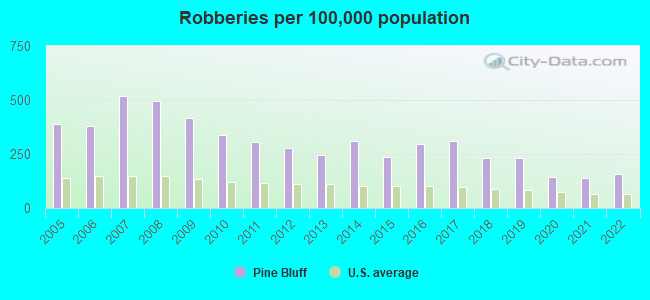
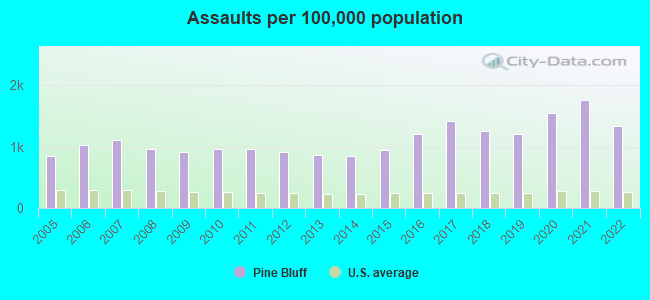
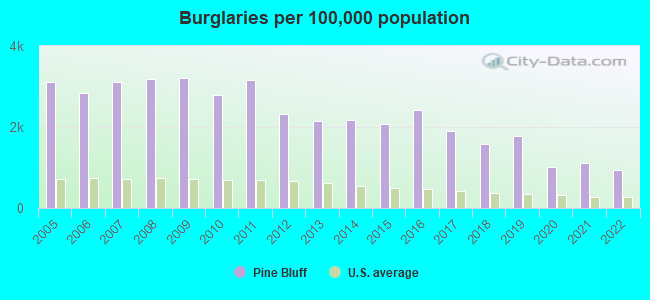
The 2022 crime rate in Pine Bluff, AR is 736 (City-Data.com crime index), which is 3.0 times higher than the U.S. average. It was higher than in 99.0% U.S. cities. The 2022 Pine Bluff crime rate fell by 17% compared to 2021. The number of homicides stood at 17 - a decrease of 7 compared to 2021. In the last 5 years Pine Bluff has seen rise of violent crime and decline of property crime.See how dangerous Pine Bluff, AR is compared to the nearest cities:
(Note: Higher means more crime)
(Note: Higher means more crime)
| Pine Bluff: | 735.9 |
| White Hall: | 126.5 |
| Redfield: | 251.3 |
| Star City: | 606.4 |
| Sheridan: | 165.0 |
| England: | 251.3 |
| Stuttgart: | 548.6 |
| Shannon Hills: | 342.3 |
| Fordyce: | 642.0 |
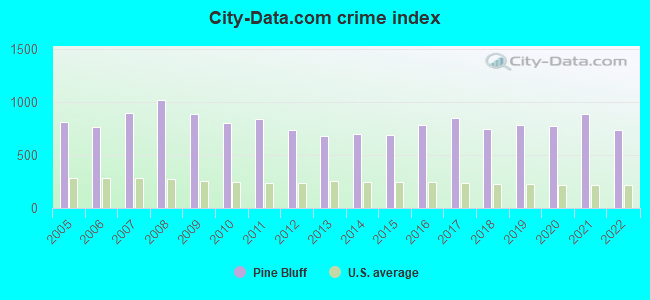
The City-Data.com crime index weighs serious crimes and violent crimes more heavily. Higher means more crime, U.S. average is 246.1. It adjusts for the number of visitors and daily workers commuting into cities.
- means the value is much bigger than the state average.
According to our research of Arkansas and other state lists, there were 207 registered sex offenders living in Pine Bluff, Arkansas as of May 18, 2024.
The ratio of all residents to sex offenders in Pine Bluff is 221 to 1.
Violent crime rate in 2022
| Pine Bluff: | 921.6 |
| U.S. Average: | 219.8 |
Violent crime rate in 2021
| Pine Bluff: | 1,159.6 |
| U.S. Average: | 224.8 |
Violent crime rate in 2020
| Pine Bluff: | 1,030.3 |
| U.S. Average: | 228.2 |
Violent crime rate in 2019
| Pine Bluff: | 889.0 |
| U.S. Average: | 219.9 |
Violent crime rate in 2018
| Pine Bluff: | 905.3 |
| U.S. Average: | 221.2 |
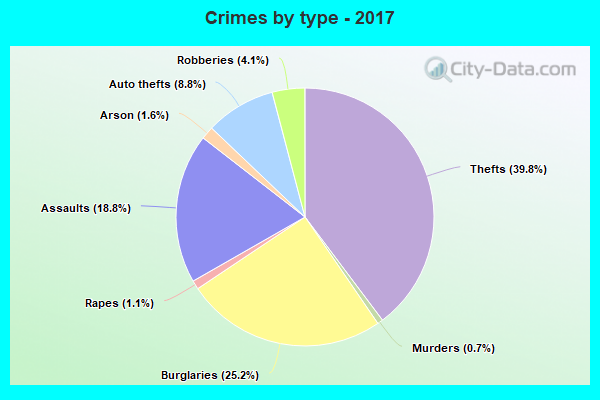
Violent crime rate in 2017
| Pine Bluff: | 1,046.7 |
| U.S. Average: | 226.2 |
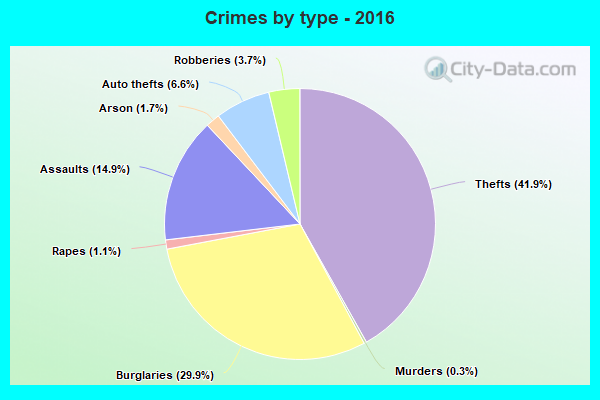
Violent crime rate in 2016
| Pine Bluff: | 875.5 |
| U.S. Average: | 227.3 |
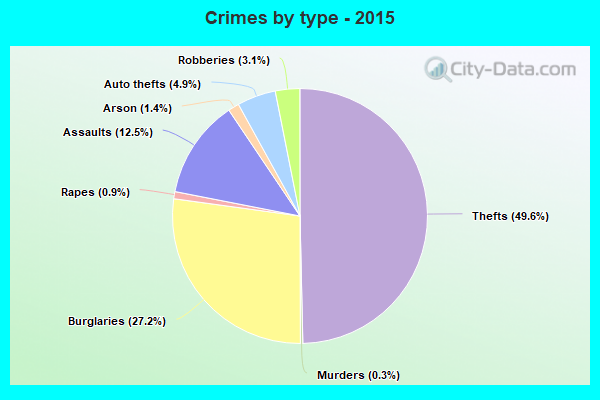
Violent crime rate in 2015
| Pine Bluff: | 709.5 |
| U.S. Average: | 219.3 |
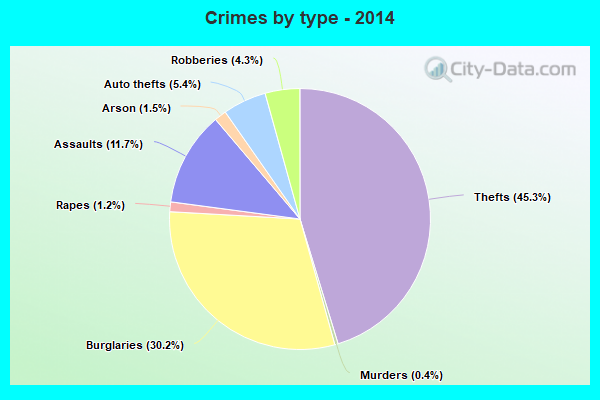
Violent crime rate in 2014
| Pine Bluff: | 720.2 |
| U.S. Average: | 211.1 |
Violent crime rate in 2013
| Pine Bluff: | 677.8 |
| U.S. Average: | 214.2 |
Violent crime rate in 2012
| Pine Bluff: | 720.3 |
| U.S. Average: | 187.4 |
Violent crime rate in 2011
| Pine Bluff: | 768.4 |
| U.S. Average: | 187.1 |
Violent crime rate in 2010
| Pine Bluff: | 762.0 |
| U.S. Average: | 195.7 |
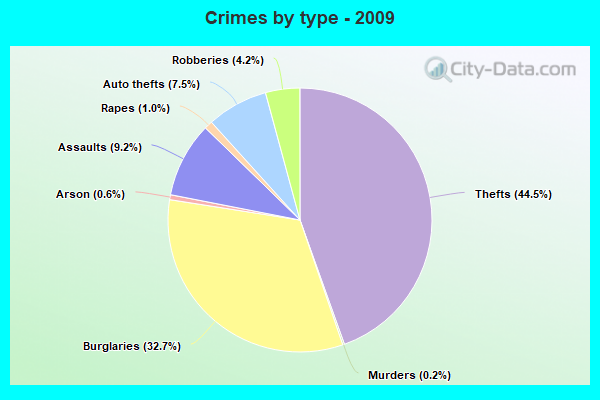
Violent crime rate in 2009
| Pine Bluff: | 808.4 |
| U.S. Average: | 208.9 |
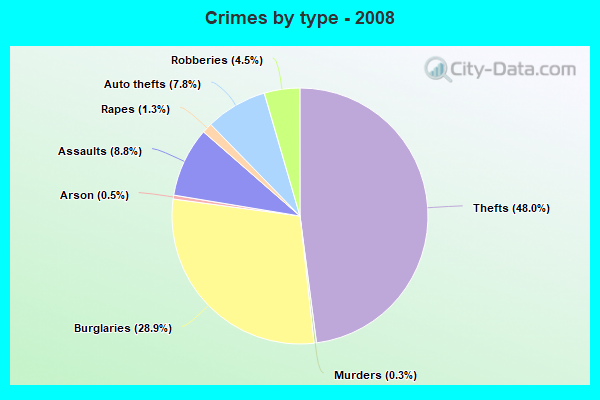
Violent crime rate in 2008
| Pine Bluff: | 935.3 |
| U.S. Average: | 222.5 |
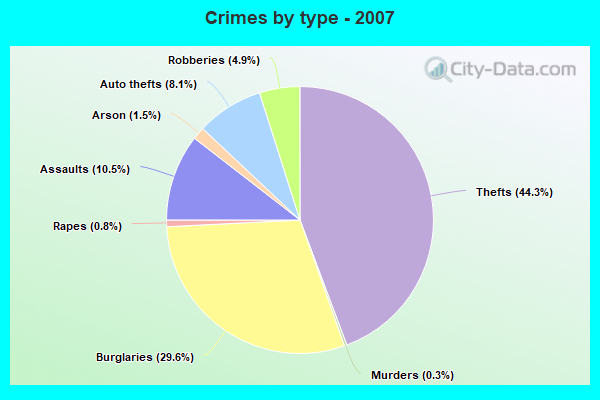
Violent crime rate in 2007
| Pine Bluff: | 874.4 |
| U.S. Average: | 229.1 |
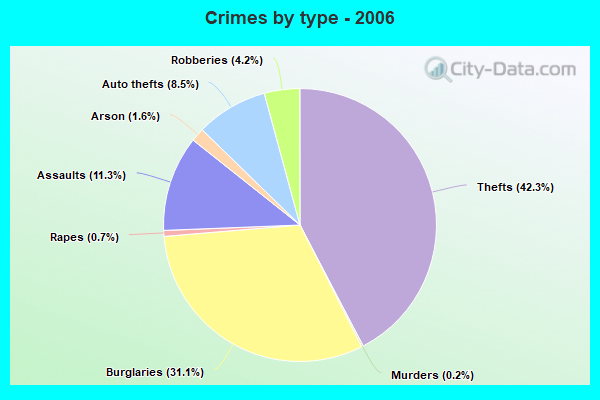
Violent crime rate in 2006
| Pine Bluff: | 750.4 |
| U.S. Average: | 232.6 |
Violent crime rate in 2005
| Pine Bluff: | 693.7 |
| U.S. Average: | 227.0 |
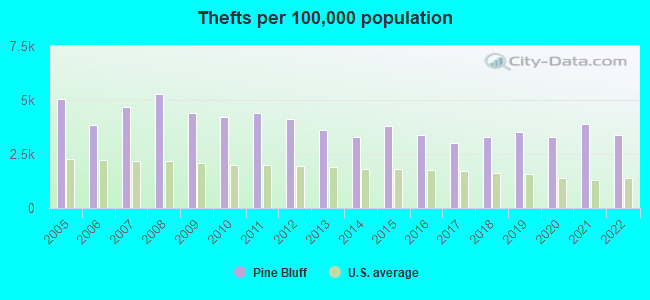
Property crime rate in 2022
| Pine Bluff: | 479.2 |
| U.S. Average: | 166.5 |
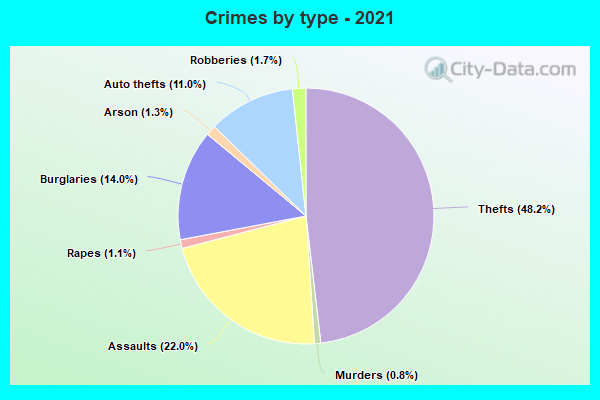
Property crime rate in 2021
| Pine Bluff: | 550.0 |
| U.S. Average: | 157.8 |
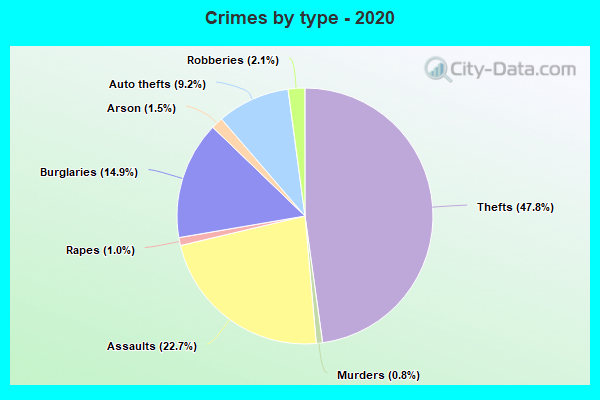
Property crime rate in 2020
| Pine Bluff: | 460.5 |
| U.S. Average: | 169.6 |
Property crime rate in 2019
| Pine Bluff: | 627.3 |
| U.S. Average: | 179.7 |
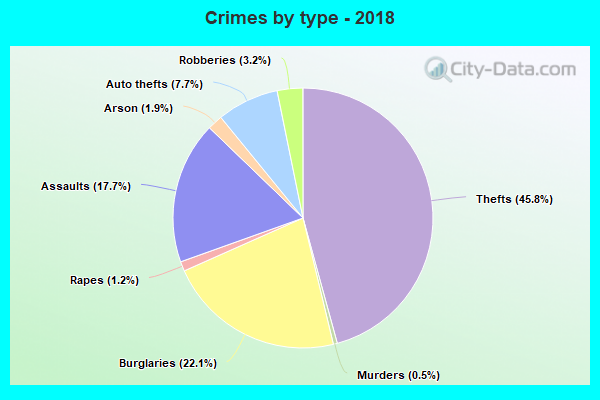
Property crime rate in 2018
| Pine Bluff: | 562.2 |
| U.S. Average: | 190.2 |
Property crime rate in 2017
| Pine Bluff: | 626.2 |
| U.S. Average: | 206.4 |
Property crime rate in 2016
| Pine Bluff: | 732.7 |
| U.S. Average: | 216.6 |
Property crime rate in 2015
| Pine Bluff: | 659.3 |
| U.S. Average: | 221.5 |
Property crime rate in 2014
| Pine Bluff: | 659.1 |
| U.S. Average: | 230.8 |
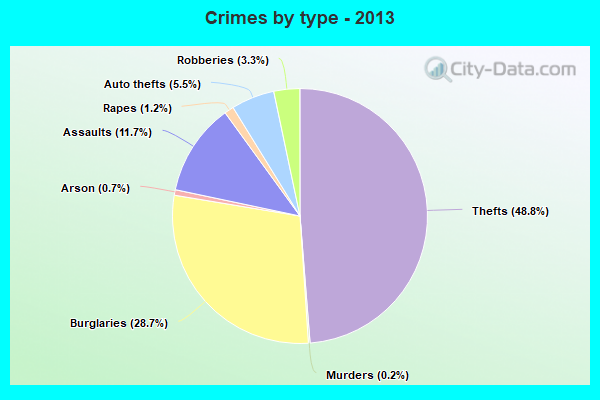
Property crime rate in 2013
| Pine Bluff: | 669.9 |
| U.S. Average: | 250.4 |
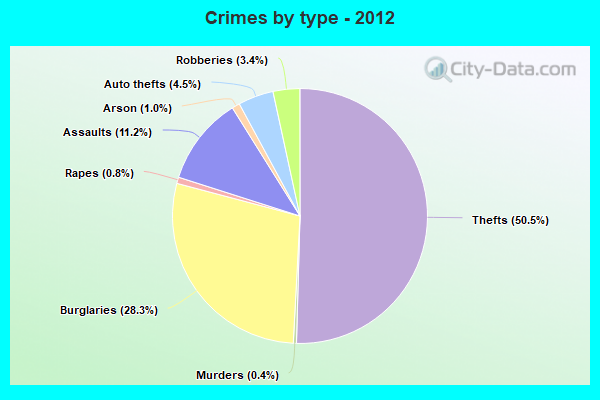
Property crime rate in 2012
| Pine Bluff: | 725.7 |
| U.S. Average: | 267.3 |
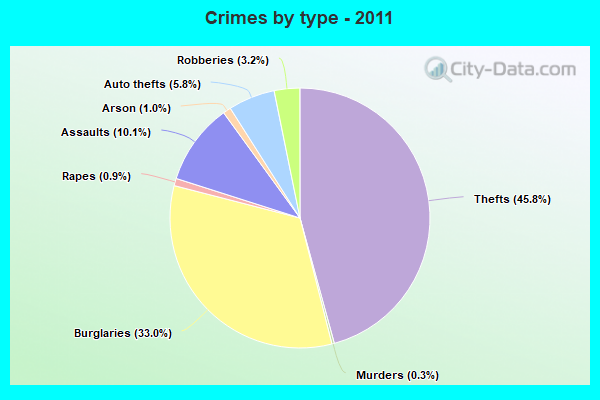
Property crime rate in 2011
| Pine Bluff: | 934.8 |
| U.S. Average: | 273.5 |
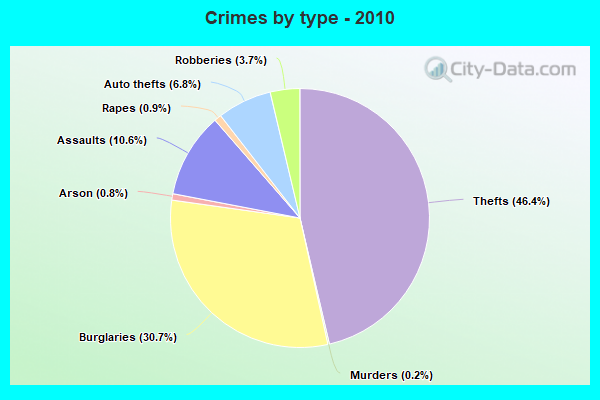
Property crime rate in 2010
| Pine Bluff: | 862.5 |
| U.S. Average: | 276.4 |
Property crime rate in 2009
| Pine Bluff: | 973.2 |
| U.S. Average: | 285.6 |
Property crime rate in 2008
| Pine Bluff: | 1,029.2 |
| U.S. Average: | 302.2 |
Property crime rate in 2007
| Pine Bluff: | 903.6 |
| U.S. Average: | 309.2 |
Property crime rate in 2006
| Pine Bluff: | 806.1 |
| U.S. Average: | 317.3 |
Property crime rate in 2005
| Pine Bluff: | 910.8 |
| U.S. Average: | 322.3 |

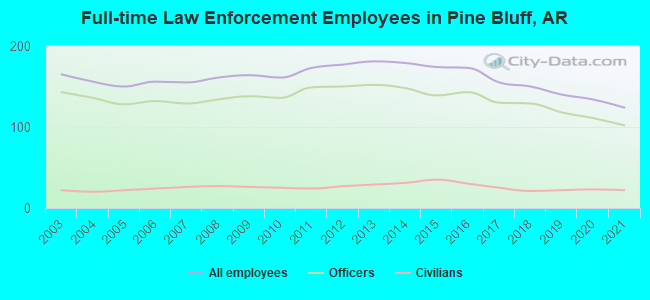
Full-time law enforcement employees in 2021, including police officers: 124 (102 officers - 73 male; 29 female).
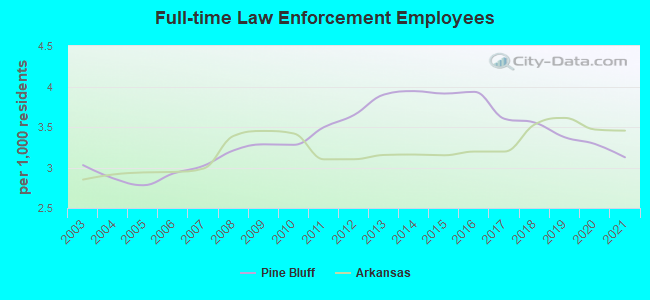
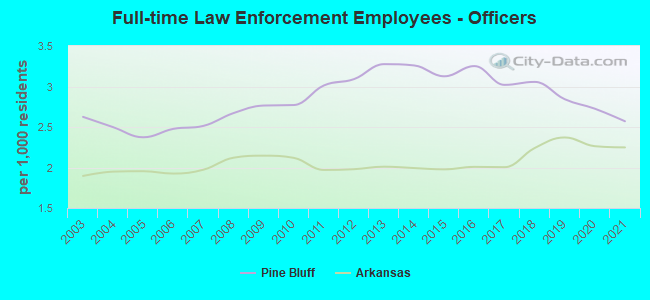
| Officers per 1,000 residents here: | 2.57 |
| Arkansas average: | 2.25 |
Full-time law enforcement employees in 2020, including police officers: 134 (111 officers - 83 male; 28 female).
| Officers per 1,000 residents here: | 2.73 |
| Arkansas average: | 2.26 |
Full-time law enforcement employees in 2019, including police officers: 140 (118 officers - 89 male; 29 female).
| Officers per 1,000 residents here: | 2.84 |
| Arkansas average: | 2.37 |
Full-time law enforcement employees in 2018, including police officers: 150 (129 officers - 96 male; 33 female).
| Officers per 1,000 residents here: | 3.06 |
| Arkansas average: | 2.24 |
Full-time law enforcement employees in 2017, including police officers: 155 (130 officers - 92 male; 38 female).
| Officers per 1,000 residents here: | 3.02 |
| Arkansas average: | 2.00 |
Full-time law enforcement employees in 2016, including police officers: 173 (143 officers - 102 male; 41 female).
| Officers per 1,000 residents here: | 3.25 |
| Arkansas average: | 2.01 |
Full-time law enforcement employees in 2015, including police officers: 174 (139 officers - 104 male; 35 female).
| Officers per 1,000 residents here: | 3.13 |
| Arkansas average: | 1.98 |
Full-time law enforcement employees in 2014, including police officers: 179 (148 officers - 114 male; 34 female).
| Officers per 1,000 residents here: | 3.26 |
| Arkansas average: | 1.99 |
Full-time law enforcement employees in 2013, including police officers: 181 (152 officers - 123 male; 29 female).
| Officers per 1,000 residents here: | 3.28 |
| Arkansas average: | 2.01 |
Full-time law enforcement employees in 2012, including police officers: 177 (150 officers - 119 male; 31 female).
| Officers per 1,000 residents here: | 3.09 |
| Arkansas average: | 1.98 |
Full-time law enforcement employees in 2011, including police officers: 173 (149 officers - 122 male; 27 female).
| Officers per 1,000 residents here: | 3.01 |
| Arkansas average: | 1.97 |
Full-time law enforcement employees in 2010, including police officers: 161 (136 officers - 115 male; 21 female).
| Officers per 1,000 residents here: | 2.77 |
| Arkansas average: | 2.12 |
Full-time law enforcement employees in 2009, including police officers: 164 (138 officers - 119 male; 19 female).
| Officers per 1,000 residents here: | 2.76 |
| Arkansas average: | 2.15 |
Full-time law enforcement employees in 2008, including police officers: 161 (134 officers - 118 male; 16 female).
| Officers per 1,000 residents here: | 2.67 |
| Arkansas average: | 2.12 |
Full-time law enforcement employees in 2007, including police officers: 155 (129 officers - 114 male; 15 female).
| Officers per 1,000 residents here: | 2.51 |
| Arkansas average: | 1.97 |
Full-time law enforcement employees in 2006, including police officers: 156 (132 officers - 116 male; 16 female).
| Officers per 1,000 residents here: | 2.48 |
| Arkansas average: | 1.93 |
Full-time law enforcement employees in 2005, including police officers: 150 (128 officers - 112 male; 16 female).
| Officers per 1,000 residents here: | 2.37 |
| Arkansas average: | 1.95 |
Full-time law enforcement employees in 2004, including police officers: 156 (136 officers - 119 male; 17 female).
| Officers per 1,000 residents here: | 2.50 |
| Arkansas average: | 1.95 |
Full-time law enforcement employees in 2003, including police officers: 165 (143 officers - 127 male; 16 female).
| Officers per 1,000 residents here: | 2.62 |
| Arkansas average: | 1.90 |