Crime rate in Plainfield, New Jersey (NJ): murders, rapes, robberies, assaults, burglaries, thefts, auto thefts, arson, law enforcement employees, police officers, crime map
Crime rate in Plainfield, NJ
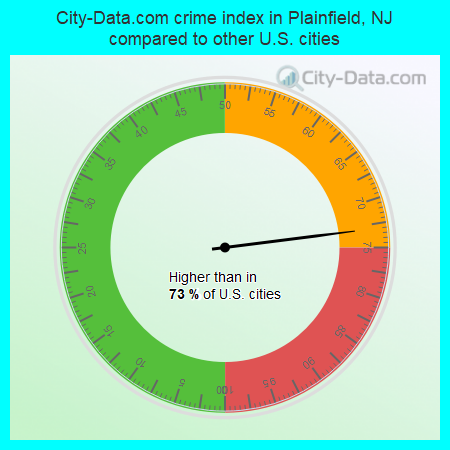
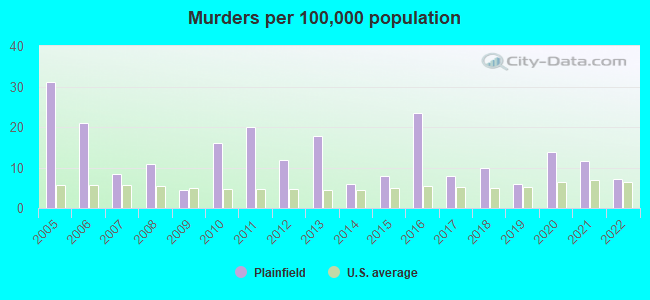
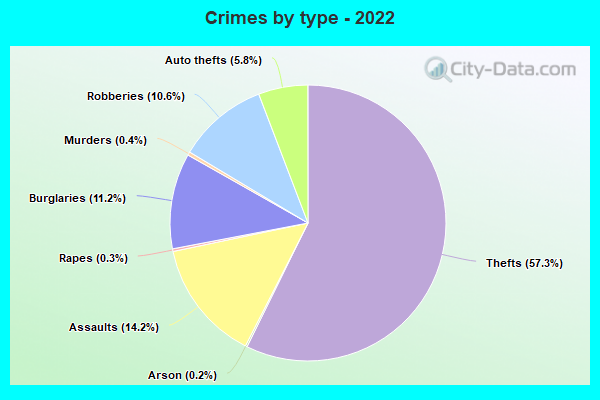
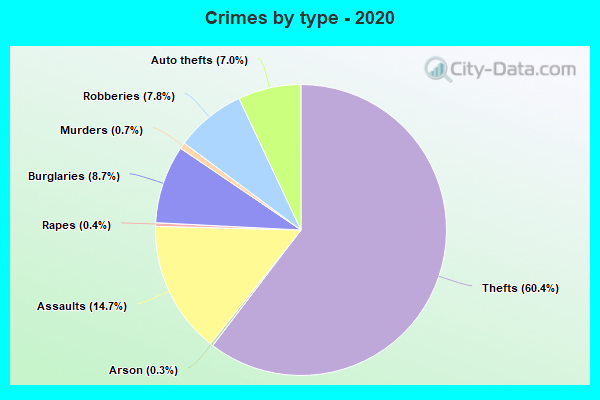
The 2022 crime rate in Plainfield, NJ is 188 (City-Data.com crime index), which is 1.3 times smaller than the U.S. average. It was higher than in 73.0% U.S. cities. The 2022 Plainfield crime rate fell by 30% compared to 2021. The number of homicides stood at 4 - a decrease of 2 compared to 2021. In the last 5 years Plainfield has seen rise of violent crime and decreasing property crime.See how dangerous Plainfield, NJ is compared to the nearest cities:
(Note: Higher means more crime)
(Note: Higher means more crime)
| Plainfield: | 188.2 |
| North Plainfield: | 128.7 |
| Watchung: | 210.0 |
| South Plainfield: | 101.9 |
| Fanwood: | 8.4 |
| Scotch Plains: | 64.5 |
| Dunellen: | 44.8 |
| Berkeley Heights: | 29.2 |
| Westfield: | 41.1 |
The City-Data.com crime index weighs serious crimes and violent crimes more heavily. Higher means more crime, U.S. average is 246.1. It adjusts for the number of visitors and daily workers commuting into cities.
- means the value is smaller than the state average.- means the value is about the same as the state average.
- means the value is bigger than the state average.
- means the value is much bigger than the state average.
According to our research of New Jersey and other state lists, there were 27 registered sex offenders living in Plainfield, New Jersey as of May 21, 2024.
The ratio of all residents to sex offenders in Plainfield is 1,891 to 1.
The ratio of registered sex offenders to all residents in this city is near the state average.
Violent crime rate in 2022
| Plainfield: | 239.7 |
| U.S. Average: | 219.8 |
Violent crime rate in 2021
| Plainfield: | 364.2 |
| U.S. Average: | 224.8 |
Violent crime rate in 2020
| Plainfield: | 251.3 |
| U.S. Average: | 228.2 |
Violent crime rate in 2019
| Plainfield: | 200.7 |
| U.S. Average: | 219.9 |
Violent crime rate in 2018
| Plainfield: | 210.5 |
| U.S. Average: | 221.2 |
Violent crime rate in 2017
| Plainfield: | 340.3 |
| U.S. Average: | 226.2 |
Violent crime rate in 2016
| Plainfield: | 389.5 |
| U.S. Average: | 227.3 |
Violent crime rate in 2015
| Plainfield: | 349.1 |
| U.S. Average: | 219.3 |
Violent crime rate in 2014
| Plainfield: | 374.7 |
| U.S. Average: | 211.1 |
Violent crime rate in 2013
| Plainfield: | 459.0 |
| U.S. Average: | 214.2 |
Violent crime rate in 2012
| Plainfield: | 387.4 |
| U.S. Average: | 187.4 |
Violent crime rate in 2011
| Plainfield: | 513.3 |
| U.S. Average: | 187.1 |
Violent crime rate in 2010
| Plainfield: | 528.0 |
| U.S. Average: | 195.7 |
Violent crime rate in 2009
| Plainfield: | 531.1 |
| U.S. Average: | 208.9 |
Violent crime rate in 2008
| Plainfield: | 531.2 |
| U.S. Average: | 222.5 |
Violent crime rate in 2007
| Plainfield: | 525.3 |
| U.S. Average: | 229.1 |
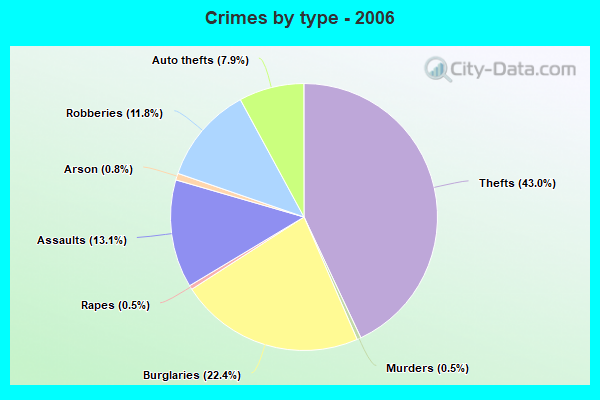
Violent crime rate in 2006
| Plainfield: | 629.2 |
| U.S. Average: | 232.6 |
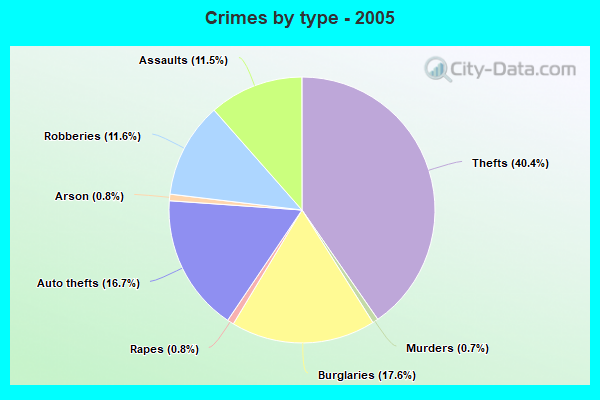
Violent crime rate in 2005
| Plainfield: | 588.2 |
| U.S. Average: | 227.0 |
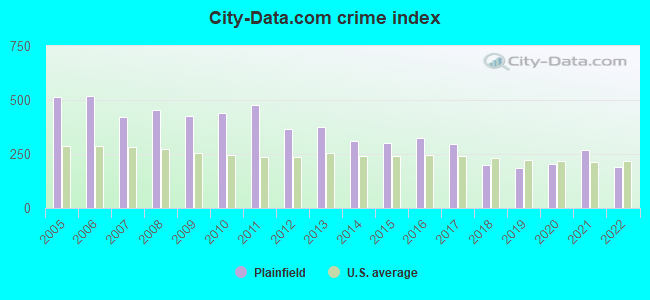
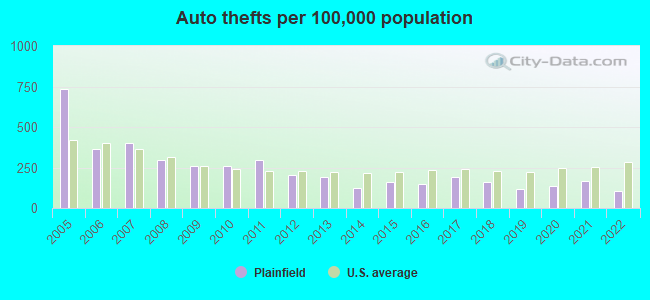
Property crime rate in 2022
| Plainfield: | 105.9 |
| U.S. Average: | 166.5 |
Property crime rate in 2021
| Plainfield: | 112.3 |
| U.S. Average: | 157.8 |
Property crime rate in 2020
| Plainfield: | 111.2 |
| U.S. Average: | 169.6 |
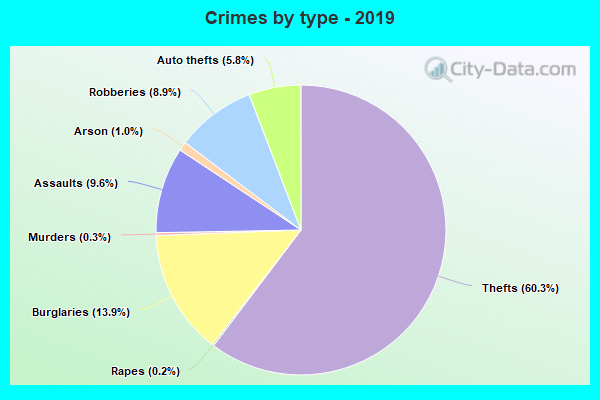
Property crime rate in 2019
| Plainfield: | 132.6 |
| U.S. Average: | 179.7 |
Property crime rate in 2018
| Plainfield: | 138.4 |
| U.S. Average: | 190.2 |
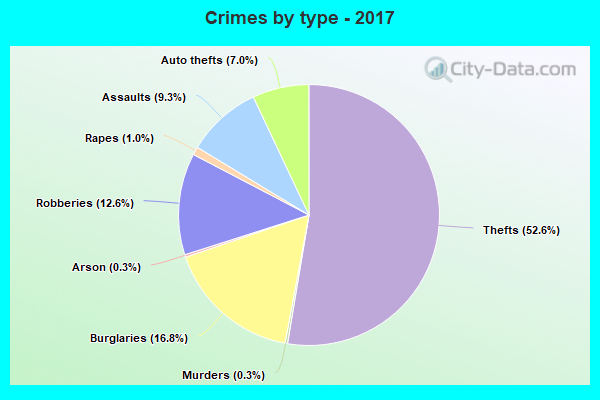
Property crime rate in 2017
| Plainfield: | 190.7 |
| U.S. Average: | 206.4 |
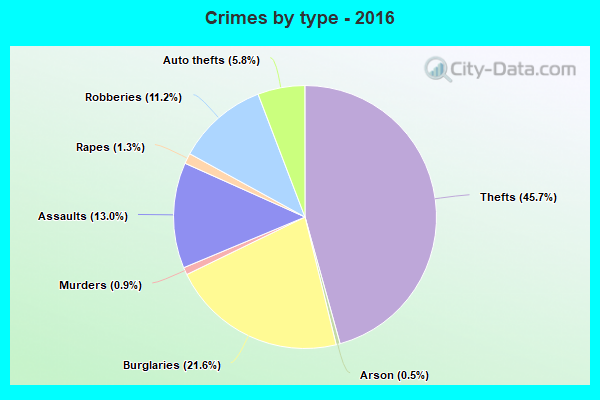
Property crime rate in 2016
| Plainfield: | 191.2 |
| U.S. Average: | 216.6 |
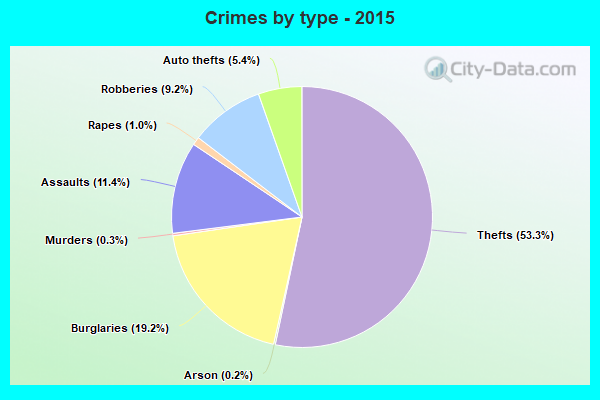
Property crime rate in 2015
| Plainfield: | 215.1 |
| U.S. Average: | 221.5 |
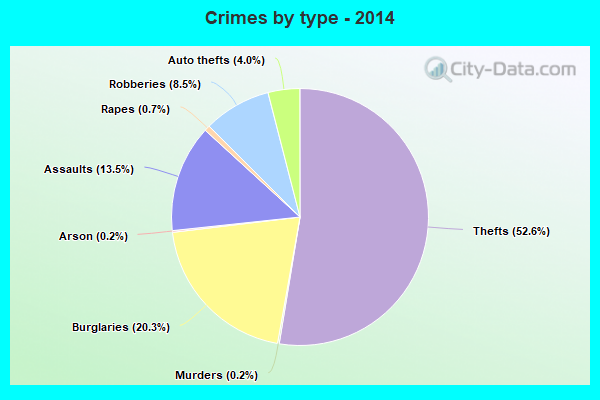
Property crime rate in 2014
| Plainfield: | 225.9 |
| U.S. Average: | 230.8 |
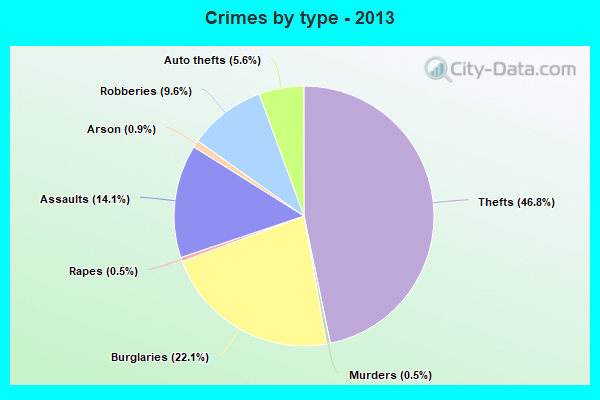
Property crime rate in 2013
| Plainfield: | 259.7 |
| U.S. Average: | 250.4 |
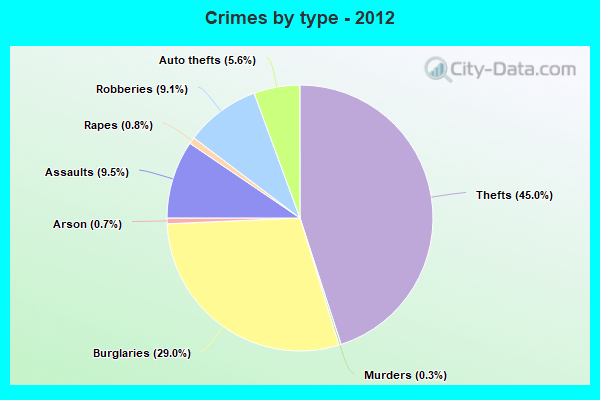
Property crime rate in 2012
| Plainfield: | 320.4 |
| U.S. Average: | 267.3 |
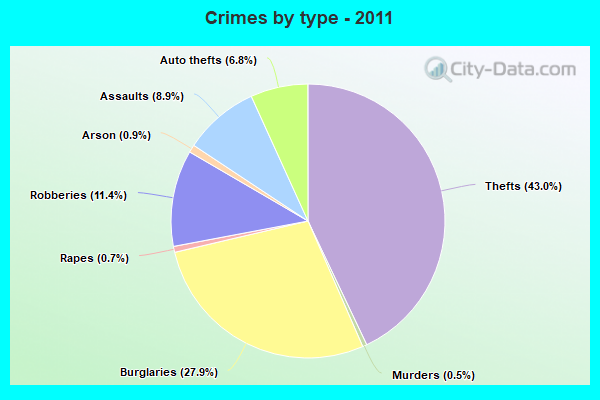
Property crime rate in 2011
| Plainfield: | 379.7 |
| U.S. Average: | 273.5 |
Property crime rate in 2010
| Plainfield: | 287.8 |
| U.S. Average: | 276.4 |
Property crime rate in 2009
| Plainfield: | 276.3 |
| U.S. Average: | 285.6 |
Property crime rate in 2008
| Plainfield: | 323.6 |
| U.S. Average: | 302.2 |
Property crime rate in 2007
| Plainfield: | 253.0 |
| U.S. Average: | 309.2 |
Property crime rate in 2006
| Plainfield: | 353.6 |
| U.S. Average: | 317.3 |
Property crime rate in 2005
| Plainfield: | 345.6 |
| U.S. Average: | 322.3 |
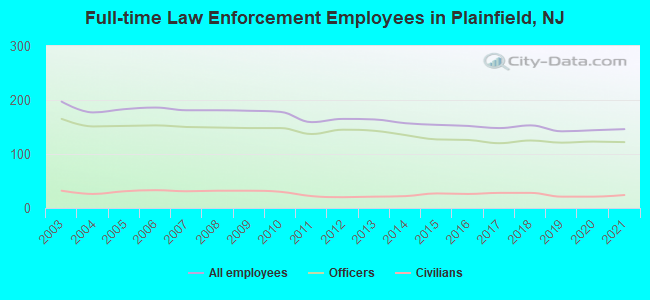
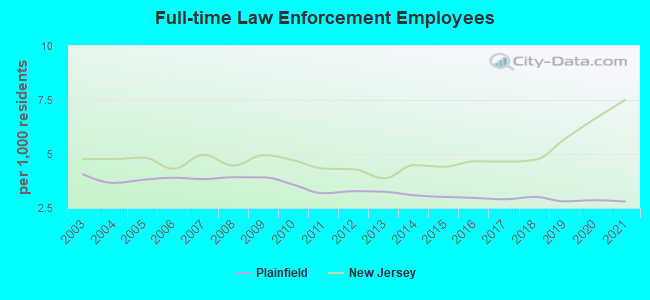
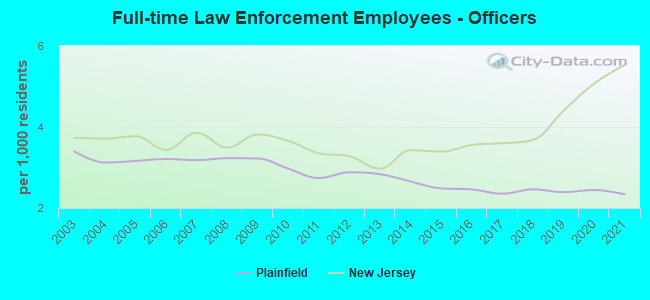
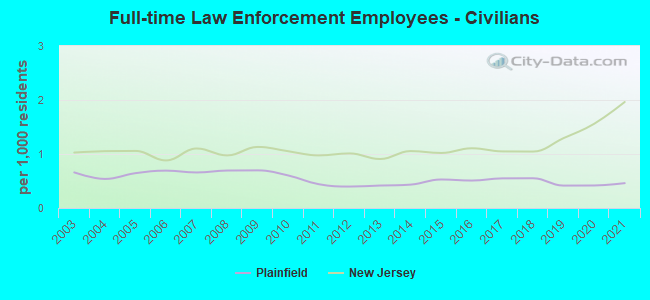
Full-time law enforcement employees in 2021, including police officers: 146 (122 officers - 95 male; 27 female).
| Officers per 1,000 residents here: | 2.34 |
| New Jersey average: | 5.53 |
Full-time law enforcement employees in 2020, including police officers: 144 (123 officers - 102 male; 21 female).
| Officers per 1,000 residents here: | 2.44 |
| New Jersey average: | 5.07 |
Full-time law enforcement employees in 2019, including police officers: 142 (121 officers - 97 male; 24 female).
| Officers per 1,000 residents here: | 2.39 |
| New Jersey average: | 4.40 |
Full-time law enforcement employees in 2018, including police officers: 153 (125 officers - 101 male; 24 female).
| Officers per 1,000 residents here: | 2.46 |
| New Jersey average: | 3.68 |
Full-time law enforcement employees in 2017, including police officers: 148 (120 officers - 100 male; 20 female).
| Officers per 1,000 residents here: | 2.35 |
| New Jersey average: | 3.60 |
Full-time law enforcement employees in 2016, including police officers: 152 (126 officers - 105 male; 21 female).
| Officers per 1,000 residents here: | 2.46 |
| New Jersey average: | 3.56 |
Full-time law enforcement employees in 2015, including police officers: 154 (127 officers - 110 male; 17 female).
| Officers per 1,000 residents here: | 2.48 |
| New Jersey average: | 3.39 |
Full-time law enforcement employees in 2014, including police officers: 157 (135 officers - 114 male; 21 female).
| Officers per 1,000 residents here: | 2.66 |
| New Jersey average: | 3.43 |
Full-time law enforcement employees in 2013, including police officers: 164 (143 officers - 121 male; 22 female).
| Officers per 1,000 residents here: | 2.84 |
| New Jersey average: | 2.97 |
Full-time law enforcement employees in 2012, including police officers: 165 (145 officers - 127 male; 18 female).
| Officers per 1,000 residents here: | 2.88 |
| New Jersey average: | 3.28 |
Full-time law enforcement employees in 2011, including police officers: 159 (137 officers - 119 male; 18 female).
| Officers per 1,000 residents here: | 2.74 |
| New Jersey average: | 3.35 |
Full-time law enforcement employees in 2010, including police officers: 178 (148 officers - 128 male; 20 female).
| Officers per 1,000 residents here: | 2.97 |
| New Jersey average: | 3.66 |
Full-time law enforcement employees in 2009, including police officers: 180 (148 officers - 128 male; 20 female).
| Officers per 1,000 residents here: | 3.22 |
| New Jersey average: | 3.81 |
Full-time law enforcement employees in 2008, including police officers: 181 (149 officers - 130 male; 19 female).
| Officers per 1,000 residents here: | 3.23 |
| New Jersey average: | 3.49 |
Full-time law enforcement employees in 2007, including police officers: 181 (150 officers - 131 male; 19 female).
| Officers per 1,000 residents here: | 3.18 |
| New Jersey average: | 3.86 |
Full-time law enforcement employees in 2006, including police officers: 186 (153 officers - 135 male; 18 female).
| Officers per 1,000 residents here: | 3.21 |
| New Jersey average: | 3.44 |
Full-time law enforcement employees in 2005, including police officers: 183 (152 officers - 134 male; 18 female).
| Officers per 1,000 residents here: | 3.16 |
| New Jersey average: | 3.77 |
Full-time law enforcement employees in 2004, including police officers: 177 (151 officers - 135 male; 16 female).
| Officers per 1,000 residents here: | 3.12 |
| New Jersey average: | 3.71 |
Full-time law enforcement employees in 2003, including police officers: 197 (165 officers - 148 male; 17 female).
| Officers per 1,000 residents here: | 3.40 |
| New Jersey average: | 3.74 |


Zip codes: 07076.