Crime rate in Pontiac, Michigan (MI): murders, rapes, robberies, assaults, burglaries, thefts, auto thefts, arson, law enforcement employees, police officers, crime map
Crime rate in Pontiac, MI
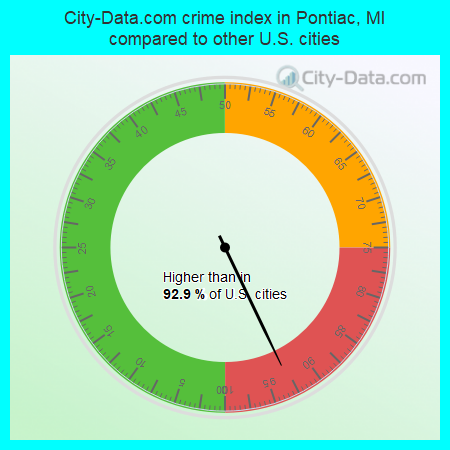
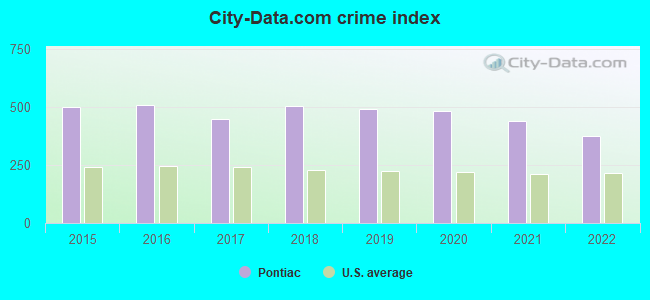
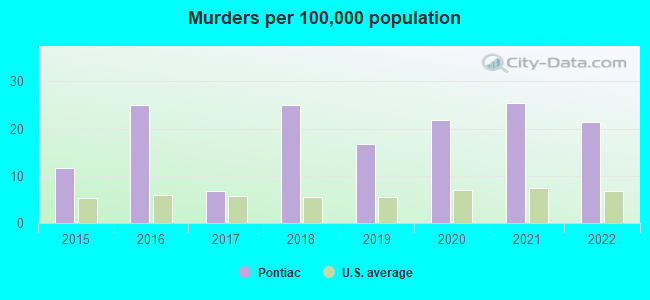
The 2022 crime rate in Pontiac, MI is 377 (City-Data.com crime index), which is 1.5 times greater than the U.S. average. It was higher than in 92.9% U.S. cities. The 2022 Pontiac crime rate fell by 14% compared to 2021. The number of homicides stood at 13 - a decrease of 2 compared to 2021. In the last 5 years Pontiac has seen decreasing violent crime and decreasing property crime.See how dangerous Pontiac, MI is compared to the nearest cities:
(Note: Higher means more crime)
(Note: Higher means more crime)
| Pontiac: | 376.7 |
| Auburn Hills: | 217.9 |
| Sylvan Lake: | 172.5 |
| Lake Angelus: | 27.6 |
| Keego Harbor: | 69.3 |
| Waterford: | 111.8 |
| Bloomfield Township: | 41.9 |
| Bloomfield Hills: | 56.8 |
| West Bloomfield Township: | 61.7 |
The City-Data.com crime index weighs serious crimes and violent crimes more heavily. Higher means more crime, U.S. average is 246.1. It adjusts for the number of visitors and daily workers commuting into cities.
- means the value is smaller than the state average.- means the value is about the same as the state average.
- means the value is bigger than the state average.
- means the value is much bigger than the state average.
According to our research of Michigan and other state lists, there were 589 registered sex offenders living in Pontiac, Michigan as of May 19, 2024.
The ratio of all residents to sex offenders in Pontiac is 102 to 1.
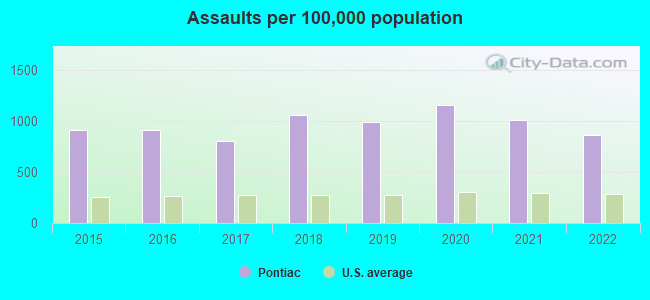
Violent crime rate in 2022
| Pontiac: | 572.0 |
| U.S. Average: | 219.8 |
Violent crime rate in 2021
| Pontiac: | 687.5 |
| U.S. Average: | 224.8 |
Violent crime rate in 2020
| Pontiac: | 781.8 |
| U.S. Average: | 228.2 |
Violent crime rate in 2019
| Pontiac: | 738.4 |
| U.S. Average: | 219.9 |
Violent crime rate in 2018
| Pontiac: | 759.0 |
| U.S. Average: | 221.2 |
Violent crime rate in 2017
| Pontiac: | 603.5 |
| U.S. Average: | 226.2 |
Violent crime rate in 2016
| Pontiac: | 714.1 |
| U.S. Average: | 227.3 |
Violent crime rate in 2015
| Pontiac: | 695.5 |
| U.S. Average: | 219.3 |
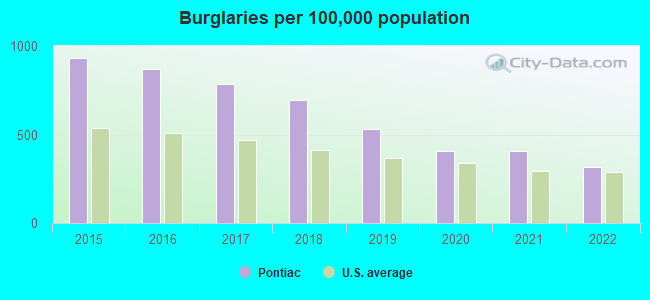
Property crime rate in 2022
| Pontiac: | 162.8 |
| U.S. Average: | 166.5 |
Property crime rate in 2021
| Pontiac: | 167.4 |
| U.S. Average: | 157.8 |
Property crime rate in 2020
| Pontiac: | 173.4 |
| U.S. Average: | 169.6 |
Property crime rate in 2019
| Pontiac: | 207.4 |
| U.S. Average: | 179.7 |
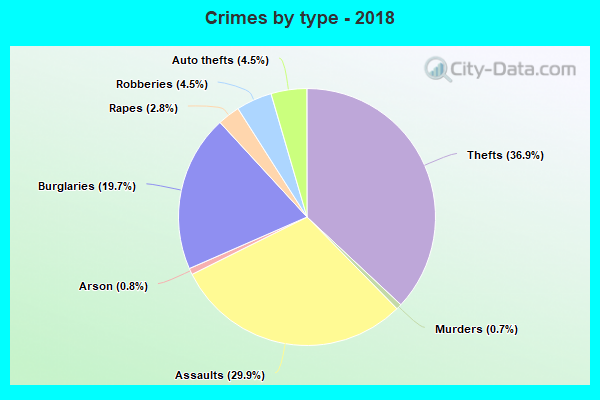
Property crime rate in 2018
| Pontiac: | 228.0 |
| U.S. Average: | 190.2 |
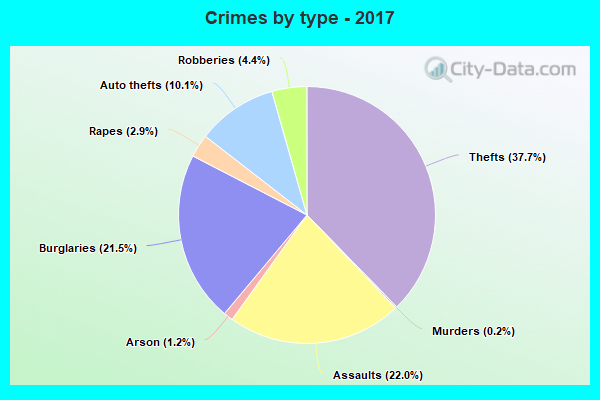
Property crime rate in 2017
| Pontiac: | 281.3 |
| U.S. Average: | 206.4 |
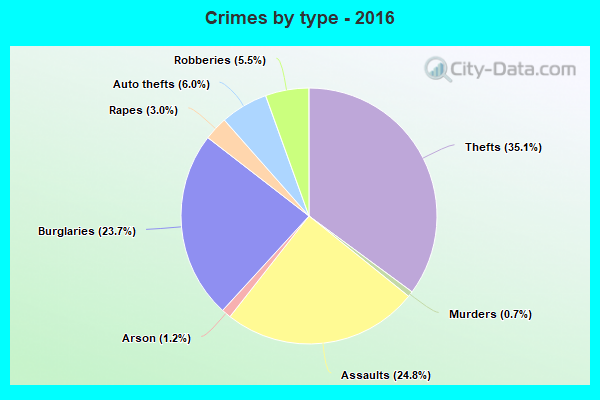
Property crime rate in 2016
| Pontiac: | 271.6 |
| U.S. Average: | 216.6 |
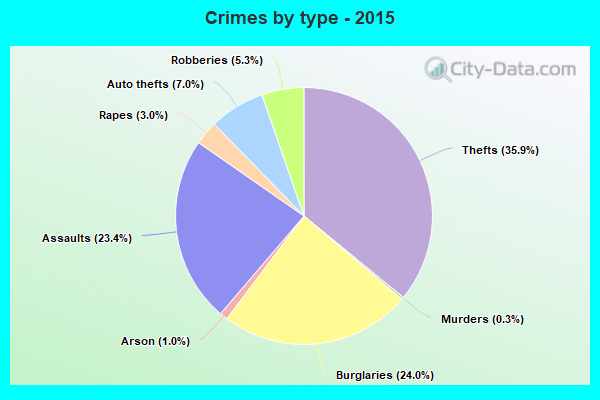
Property crime rate in 2015
| Pontiac: | 296.4 |
| U.S. Average: | 221.5 |
Full-time law enforcement employees in 2015, including police officers: 1 (1 officers - 1 male; 0 female).
| Officers per 1,000 residents here: | 0.02 |
| Michigan average: | 1.72 |