Crime rate in Racine, Wisconsin (WI): murders, rapes, robberies, assaults, burglaries, thefts, auto thefts, arson, law enforcement employees, police officers, crime map
Crime rate in Racine, WI
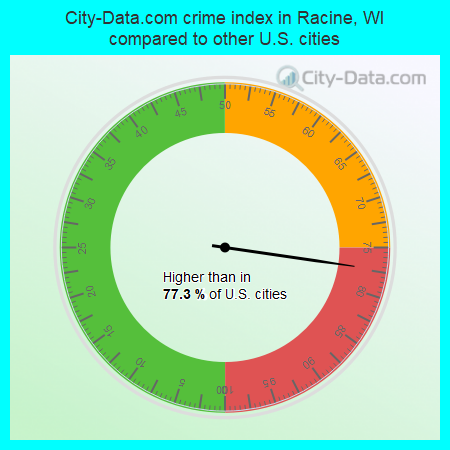
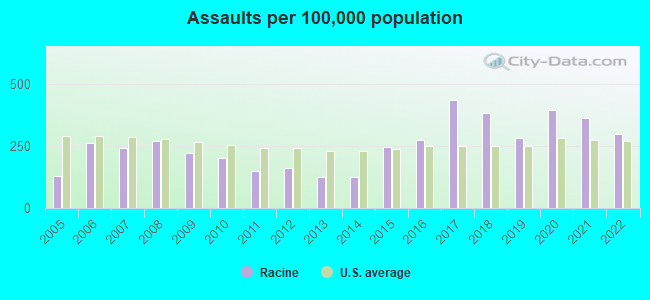
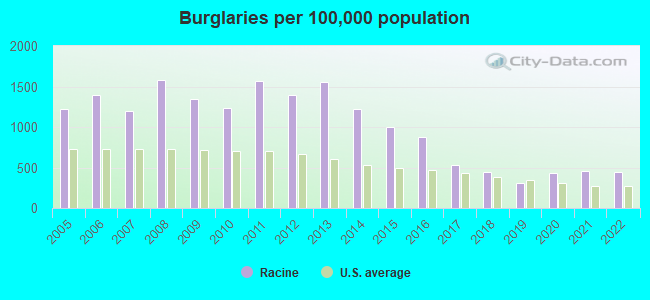
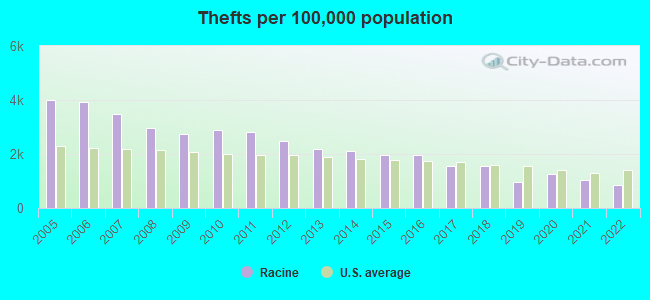
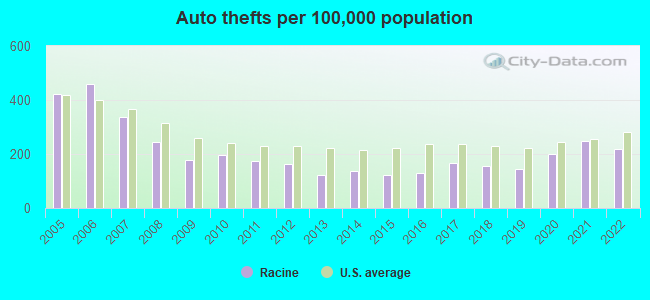
The 2022 crime rate in Racine, WI is 213 (City-Data.com crime index), which is about the average for the U.S. cities. It was higher than in 77.3% U.S. cities. The 2022 Racine crime rate fell by 12% compared to 2021. The number of homicides stood at 5 - a decrease of 3 compared to 2021. In the last 5 years Racine has seen decreasing violent crime and decreasing property crime.See how dangerous Racine, WI is compared to the nearest cities:
(Note: Higher means more crime)
(Note: Higher means more crime)
| Racine: | 213.2 |
| Mount Pleasant: | 108.8 |
| Wind Point: | 6.8 |
| Caledonia: | 32.9 |
| Sturtevant: | 47.5 |
| Kenosha: | 186.8 |
| Oak Creek: | 138.0 |
| South Milwaukee: | 109.5 |
| Pleasant Prairie: | 113.3 |

The City-Data.com crime index weighs serious crimes and violent crimes more heavily. Higher means more crime, U.S. average is 246.1. It adjusts for the number of visitors and daily workers commuting into cities.
- means the value is smaller than the state average.- means the value is about the same as the state average.
- means the value is bigger than the state average.
- means the value is much bigger than the state average.
According to our research of Wisconsin and other state lists, there were 407 registered sex offenders living in Racine, Wisconsin as of May 17, 2024.
The ratio of all residents to sex offenders in Racine is 192 to 1.
Violent crime rate in 2022
| Racine: | 246.5 |
| U.S. Average: | 219.8 |
Violent crime rate in 2021
| Racine: | 282.8 |
| U.S. Average: | 224.8 |
Violent crime rate in 2020
| Racine: | 314.7 |
| U.S. Average: | 228.2 |
Violent crime rate in 2019
| Racine: | 267.2 |
| U.S. Average: | 219.9 |
Violent crime rate in 2018
| Racine: | 339.3 |
| U.S. Average: | 221.2 |
Violent crime rate in 2017
| Racine: | 379.3 |
| U.S. Average: | 226.2 |
Violent crime rate in 2016
| Racine: | 258.6 |
| U.S. Average: | 227.3 |
Violent crime rate in 2015
| Racine: | 251.6 |
| U.S. Average: | 219.3 |
Violent crime rate in 2014
| Racine: | 219.7 |
| U.S. Average: | 211.1 |
Violent crime rate in 2013
| Racine: | 205.4 |
| U.S. Average: | 214.2 |
Violent crime rate in 2012
| Racine: | 263.7 |
| U.S. Average: | 187.4 |
Violent crime rate in 2011
| Racine: | 222.8 |
| U.S. Average: | 187.1 |
Violent crime rate in 2010
| Racine: | 272.6 |
| U.S. Average: | 195.7 |
Violent crime rate in 2009
| Racine: | 299.2 |
| U.S. Average: | 208.9 |
Violent crime rate in 2008
| Racine: | 359.4 |
| U.S. Average: | 222.5 |
Violent crime rate in 2007
| Racine: | 323.3 |
| U.S. Average: | 229.1 |
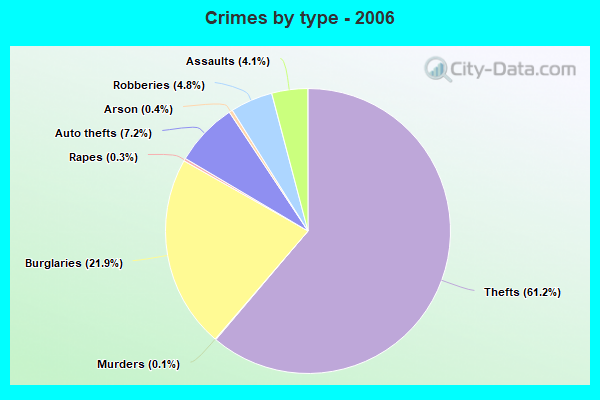
Violent crime rate in 2006
| Racine: | 296.8 |
| U.S. Average: | 232.6 |
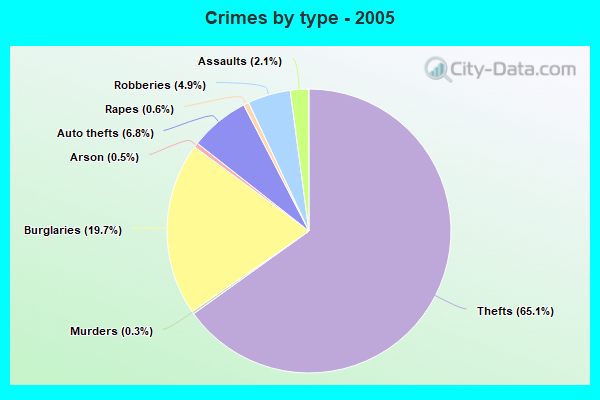
Violent crime rate in 2005
| Racine: | 269.6 |
| U.S. Average: | 227.0 |
Property crime rate in 2022
| Racine: | 163.5 |
| U.S. Average: | 166.5 |
Property crime rate in 2021
| Racine: | 178.5 |
| U.S. Average: | 157.8 |
Property crime rate in 2020
| Racine: | 178.8 |
| U.S. Average: | 169.6 |
Property crime rate in 2019
| Racine: | 131.8 |
| U.S. Average: | 179.7 |
Property crime rate in 2018
| Racine: | 190.9 |
| U.S. Average: | 190.2 |
Property crime rate in 2017
| Racine: | 208.8 |
| U.S. Average: | 206.4 |
Property crime rate in 2016
| Racine: | 291.3 |
| U.S. Average: | 216.6 |
Property crime rate in 2015
| Racine: | 315.3 |
| U.S. Average: | 221.5 |
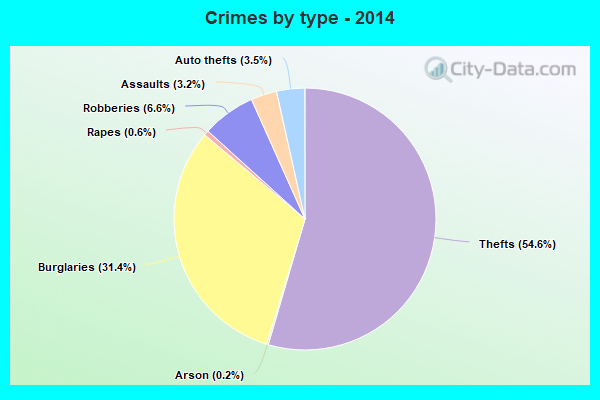
Property crime rate in 2014
| Racine: | 371.5 |
| U.S. Average: | 230.8 |
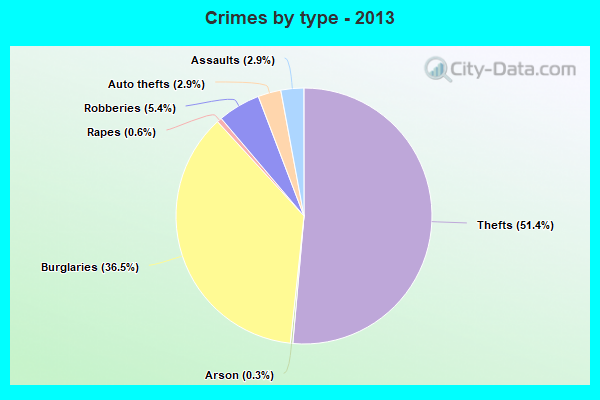
Property crime rate in 2013
| Racine: | 437.2 |
| U.S. Average: | 250.4 |
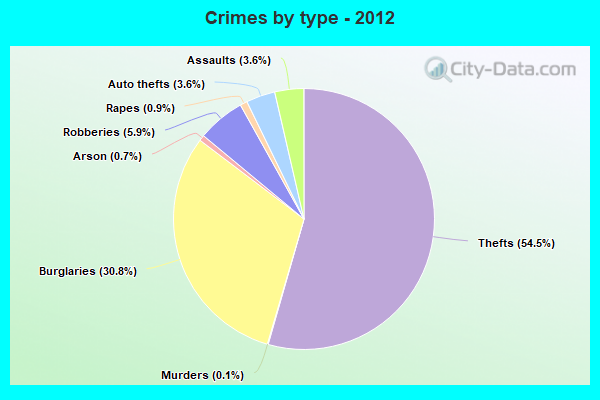
Property crime rate in 2012
| Racine: | 426.5 |
| U.S. Average: | 267.3 |
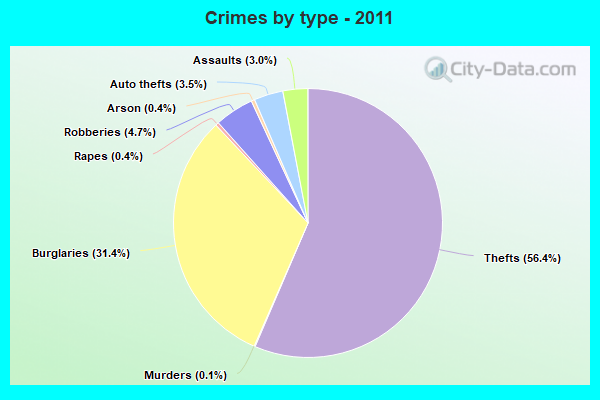
Property crime rate in 2011
| Racine: | 479.8 |
| U.S. Average: | 273.5 |
Property crime rate in 2010
| Racine: | 420.4 |
| U.S. Average: | 276.4 |
Property crime rate in 2009
| Racine: | 434.1 |
| U.S. Average: | 285.6 |
Property crime rate in 2008
| Racine: | 500.3 |
| U.S. Average: | 302.2 |
Property crime rate in 2007
| Racine: | 428.0 |
| U.S. Average: | 309.2 |
Property crime rate in 2006
| Racine: | 502.1 |
| U.S. Average: | 317.3 |
Property crime rate in 2005
| Racine: | 469.5 |
| U.S. Average: | 322.3 |
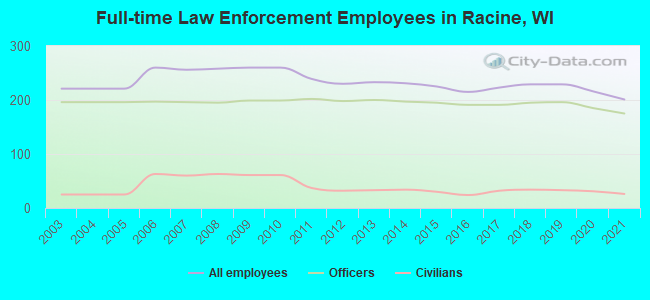
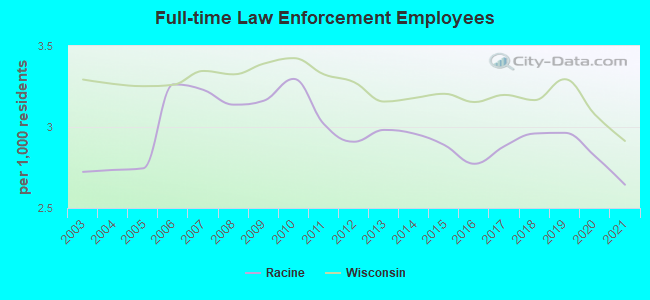
Full-time law enforcement employees in 2021, including police officers: 201 (175 officers - 152 male; 23 female).
| Officers per 1,000 residents here: | 2.30 |
| Wisconsin average: | 2.07 |
Full-time law enforcement employees in 2020, including police officers: 216 (185 officers - 157 male; 28 female).
| Officers per 1,000 residents here: | 2.42 |
| Wisconsin average: | 2.11 |
Full-time law enforcement employees in 2019, including police officers: 229 (196 officers - 172 male; 24 female).
| Officers per 1,000 residents here: | 2.54 |
| Wisconsin average: | 2.27 |
Full-time law enforcement employees in 2018, including police officers: 229 (195 officers - 170 male; 25 female).
| Officers per 1,000 residents here: | 2.52 |
| Wisconsin average: | 2.23 |
Full-time law enforcement employees in 2017, including police officers: 223 (191 officers - 169 male; 22 female).
| Officers per 1,000 residents here: | 2.47 |
| Wisconsin average: | 2.24 |
Full-time law enforcement employees in 2016, including police officers: 215 (191 officers - 24 male; 167 female).
| Officers per 1,000 residents here: | 2.46 |
| Wisconsin average: | 2.23 |
Full-time law enforcement employees in 2015, including police officers: 225 (195 officers - 170 male; 25 female).
| Officers per 1,000 residents here: | 2.50 |
| Wisconsin average: | 2.22 |
Full-time law enforcement employees in 2014, including police officers: 231 (197 officers - 171 male; 26 female).
| Officers per 1,000 residents here: | 2.52 |
| Wisconsin average: | 2.23 |
Full-time law enforcement employees in 2013, including police officers: 233 (200 officers - 176 male; 24 female).
| Officers per 1,000 residents here: | 2.56 |
| Wisconsin average: | 2.19 |
Full-time law enforcement employees in 2012, including police officers: 230 (198 officers - 174 male; 24 female).
| Officers per 1,000 residents here: | 2.50 |
| Wisconsin average: | 2.22 |
Full-time law enforcement employees in 2011, including police officers: 239 (202 officers - 181 male; 21 female).
| Officers per 1,000 residents here: | 2.55 |
| Wisconsin average: | 2.24 |
Full-time law enforcement employees in 2010, including police officers: 260 (199 officers - 181 male; 18 female).
| Officers per 1,000 residents here: | 2.52 |
| Wisconsin average: | 2.31 |
Full-time law enforcement employees in 2009, including police officers: 260 (199 officers - 181 male; 18 female).
| Officers per 1,000 residents here: | 2.42 |
| Wisconsin average: | 2.32 |
Full-time law enforcement employees in 2008, including police officers: 258 (195 officers - 178 male; 17 female).
| Officers per 1,000 residents here: | 2.37 |
| Wisconsin average: | 2.32 |
Full-time law enforcement employees in 2007, including police officers: 256 (196 officers - 181 male; 15 female).
| Officers per 1,000 residents here: | 2.47 |
| Wisconsin average: | 2.32 |
Full-time law enforcement employees in 2006, including police officers: 260 (197 officers - 179 male; 18 female).
| Officers per 1,000 residents here: | 2.47 |
| Wisconsin average: | 2.35 |
Full-time law enforcement employees in 2005, including police officers: 221 (196 officers - 177 male; 19 female).
| Officers per 1,000 residents here: | 2.43 |
| Wisconsin average: | 2.36 |
Full-time law enforcement employees in 2004, including police officers: 221 (196 officers - 177 male; 19 female).
| Officers per 1,000 residents here: | 2.43 |
| Wisconsin average: | 2.33 |
Full-time law enforcement employees in 2003, including police officers: 221 (196 officers - 177 male; 19 female).
| Officers per 1,000 residents here: | 2.41 |
| Wisconsin average: | 2.37 |

Zip codes: 53403.