Crime rate in Roswell, Georgia (GA): murders, rapes, robberies, assaults, burglaries, thefts, auto thefts, arson, law enforcement employees, police officers, crime map
Crime rate in Roswell, GA
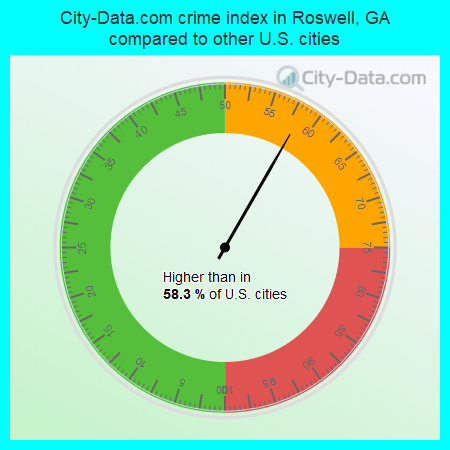
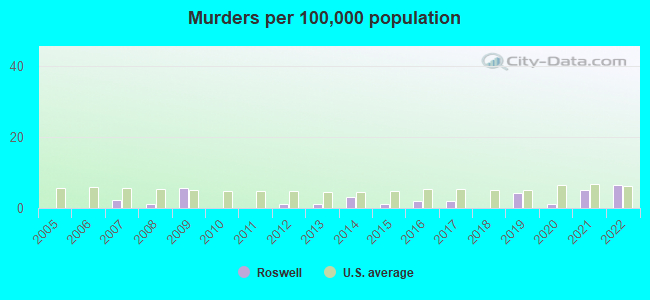
The 2022 crime rate in Roswell, GA is 126 (City-Data.com crime index), which is 2.0 times smaller than the U.S. average. It was higher than in 58.3% U.S. cities. The 2022 Roswell crime rate fell by 20% compared to 2021. The number of homicides stood at 6 - an increase of 1 compared to 2021. In the last 5 years Roswell has seen increasing violent crime and decline of property crime.See how dangerous Roswell, GA is compared to the nearest cities:
(Note: Higher means more crime)
(Note: Higher means more crime)
| Roswell: | 125.8 |
| Alpharetta: | 124.6 |
| Dunwoody: | 210.9 |
| Sandy Springs: | 122.0 |
| Milton: | 49.9 |
| Johns Creek: | 35.6 |
| Doraville: | 353.2 |
| Norcross: | 327.9 |
| Chamblee: | 244.5 |
The City-Data.com crime index weighs serious crimes and violent crimes more heavily. Higher means more crime, U.S. average is 246.1. It adjusts for the number of visitors and daily workers commuting into cities.
- means the value is smaller than the state average.- means the value is about the same as the state average.
- means the value is bigger than the state average.
According to our research of Georgia and other state lists, there were 43 registered sex offenders living in Roswell, Georgia as of May 16, 2024.
The ratio of all residents to sex offenders in Roswell is 2,244 to 1.
The ratio of registered sex offenders to all residents in this city is much lower than the state average.
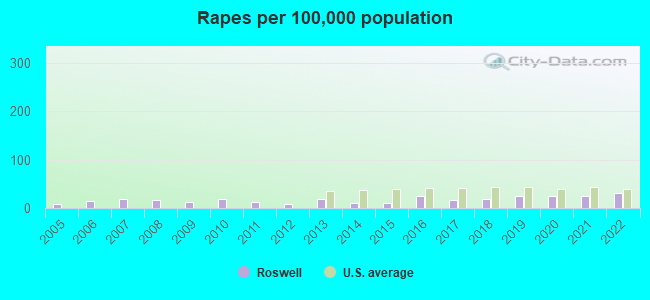
Violent crime rate in 2022
| Roswell: | 118.9 |
| U.S. Average: | 219.8 |
Violent crime rate in 2021
| Roswell: | 180.7 |
| U.S. Average: | 224.8 |
Violent crime rate in 2020
| Roswell: | 199.7 |
| U.S. Average: | 228.2 |
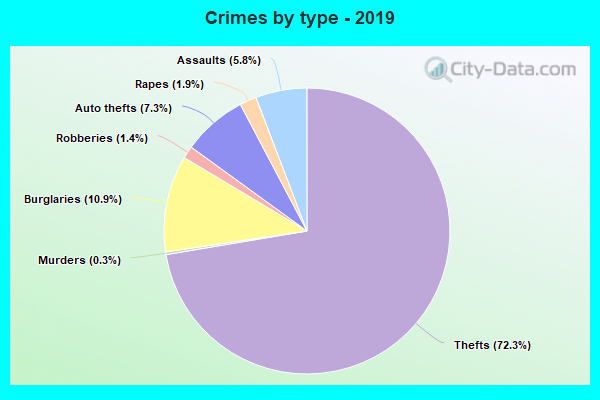
Violent crime rate in 2019
| Roswell: | 81.2 |
| U.S. Average: | 219.9 |
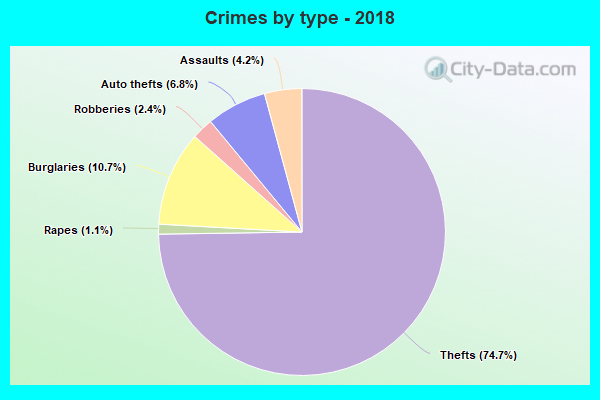
Violent crime rate in 2018
| Roswell: | 75.3 |
| U.S. Average: | 221.2 |
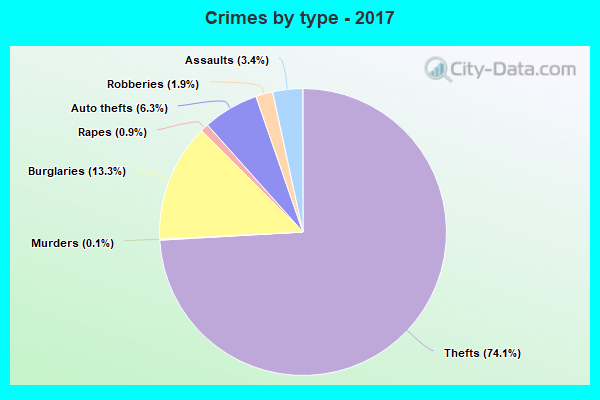
Violent crime rate in 2017
| Roswell: | 67.5 |
| U.S. Average: | 226.2 |
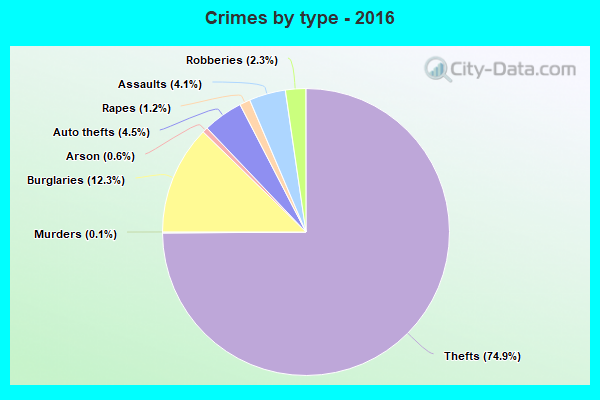
Violent crime rate in 2016
| Roswell: | 89.9 |
| U.S. Average: | 227.3 |
Violent crime rate in 2015
| Roswell: | 69.1 |
| U.S. Average: | 219.3 |
Violent crime rate in 2014
| Roswell: | 67.6 |
| U.S. Average: | 211.1 |
Violent crime rate in 2013
| Roswell: | 86.0 |
| U.S. Average: | 214.2 |
Violent crime rate in 2012
| Roswell: | 77.1 |
| U.S. Average: | 187.4 |
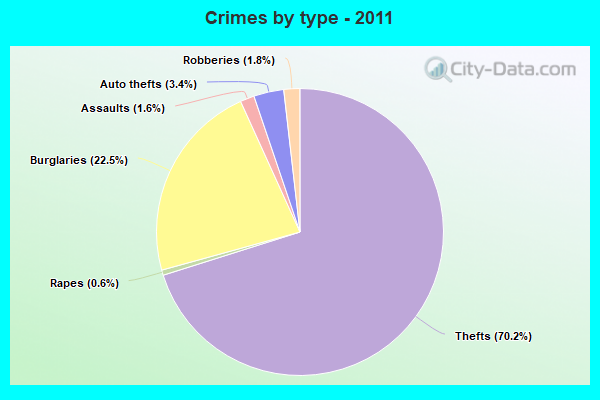
Violent crime rate in 2011
| Roswell: | 46.4 |
| U.S. Average: | 187.1 |
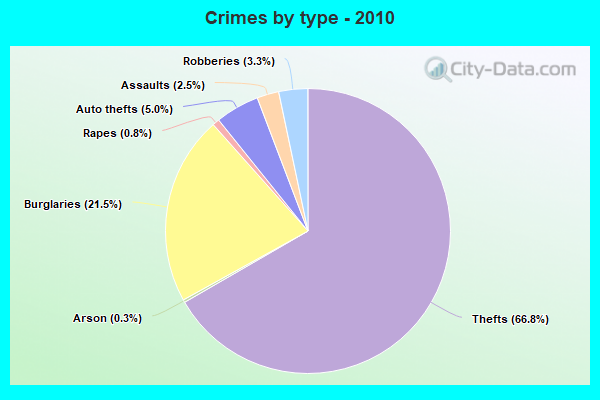
Violent crime rate in 2010
| Roswell: | 83.2 |
| U.S. Average: | 195.7 |
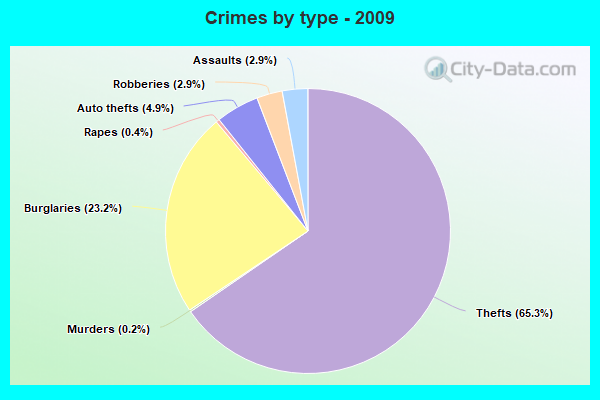
Violent crime rate in 2009
| Roswell: | 106.9 |
| U.S. Average: | 208.9 |
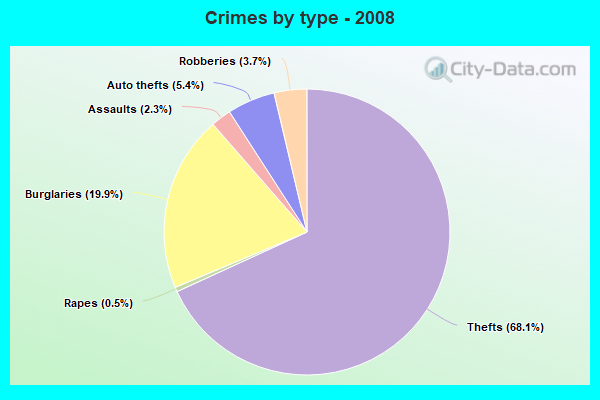
Violent crime rate in 2008
| Roswell: | 108.4 |
| U.S. Average: | 222.5 |
Violent crime rate in 2007
| Roswell: | 104.8 |
| U.S. Average: | 229.1 |
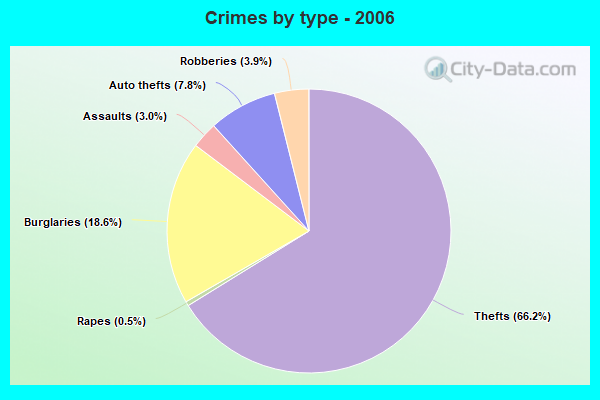
Violent crime rate in 2006
| Roswell: | 93.3 |
| U.S. Average: | 232.6 |
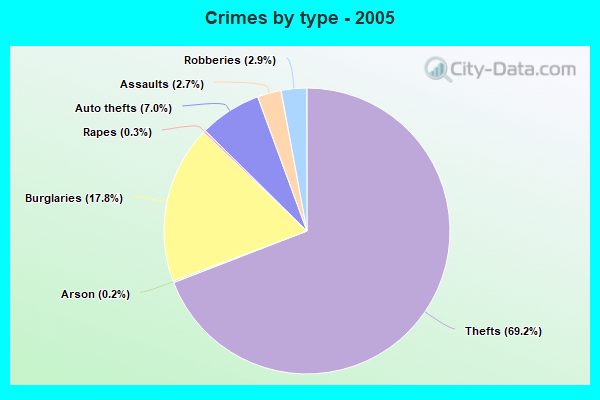
Violent crime rate in 2005
| Roswell: | 76.2 |
| U.S. Average: | 227.0 |
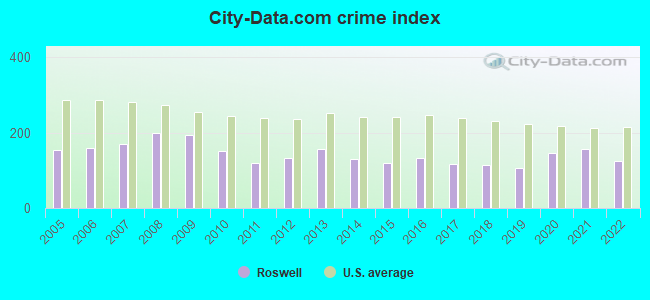
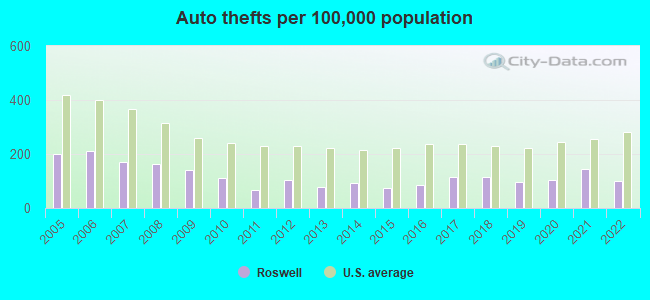
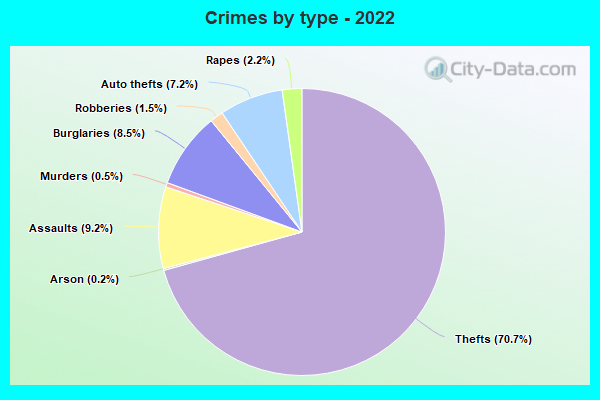
Property crime rate in 2022
| Roswell: | 88.3 |
| U.S. Average: | 166.5 |
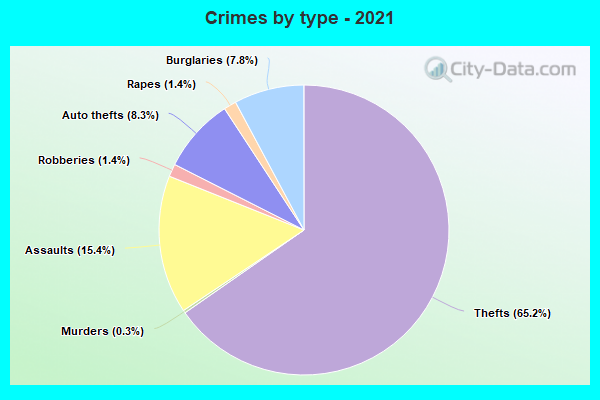
Property crime rate in 2021
| Roswell: | 105.0 |
| U.S. Average: | 157.8 |
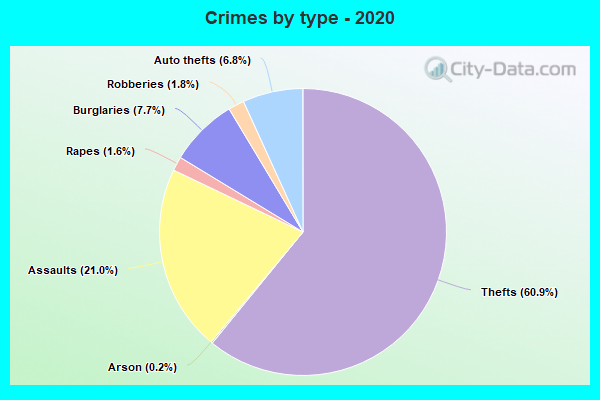
Property crime rate in 2020
| Roswell: | 85.5 |
| U.S. Average: | 169.6 |
Property crime rate in 2019
| Roswell: | 90.2 |
| U.S. Average: | 179.7 |
Property crime rate in 2018
| Roswell: | 117.3 |
| U.S. Average: | 190.2 |
Property crime rate in 2017
| Roswell: | 131.8 |
| U.S. Average: | 206.4 |
Property crime rate in 2016
| Roswell: | 133.4 |
| U.S. Average: | 216.6 |
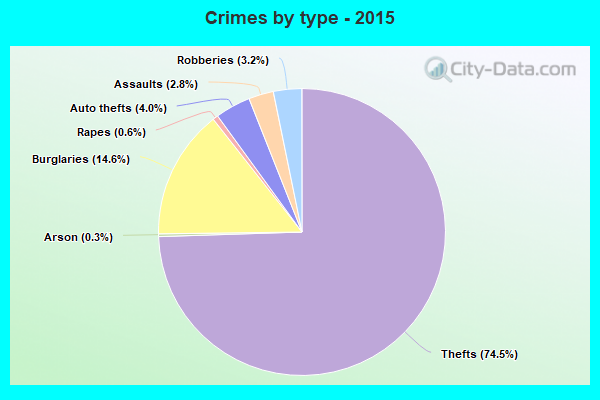
Property crime rate in 2015
| Roswell: | 135.9 |
| U.S. Average: | 221.5 |
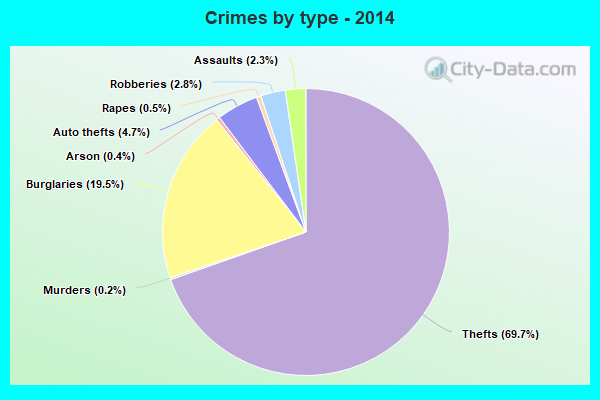
Property crime rate in 2014
| Roswell: | 161.6 |
| U.S. Average: | 230.8 |
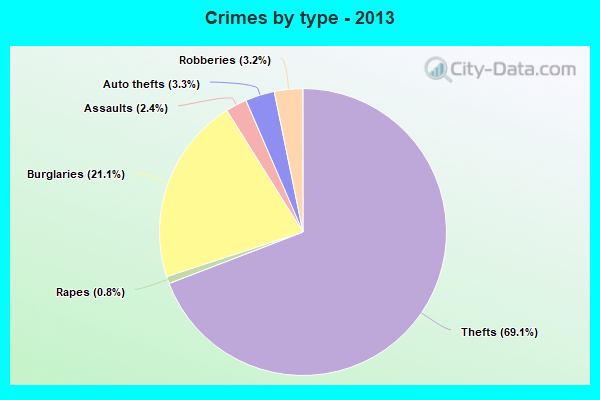
Property crime rate in 2013
| Roswell: | 193.2 |
| U.S. Average: | 250.4 |
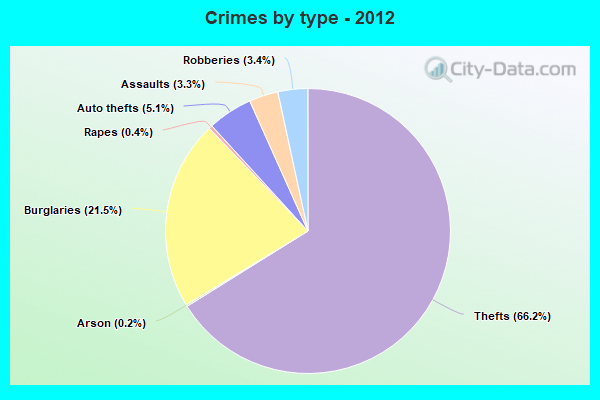
Property crime rate in 2012
| Roswell: | 168.5 |
| U.S. Average: | 267.3 |
Property crime rate in 2011
| Roswell: | 171.0 |
| U.S. Average: | 273.5 |
Property crime rate in 2010
| Roswell: | 189.4 |
| U.S. Average: | 276.4 |
Property crime rate in 2009
| Roswell: | 246.0 |
| U.S. Average: | 285.6 |
Property crime rate in 2008
| Roswell: | 247.0 |
| U.S. Average: | 302.2 |
Property crime rate in 2007
| Roswell: | 198.7 |
| U.S. Average: | 309.2 |
Property crime rate in 2006
| Roswell: | 192.8 |
| U.S. Average: | 317.3 |
Property crime rate in 2005
| Roswell: | 199.9 |
| U.S. Average: | 322.3 |
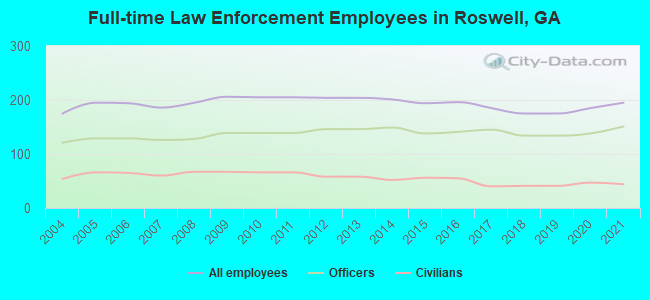
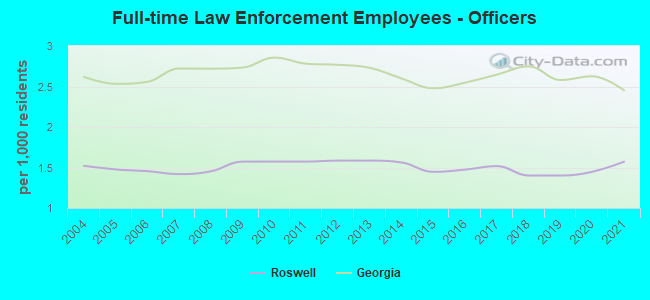
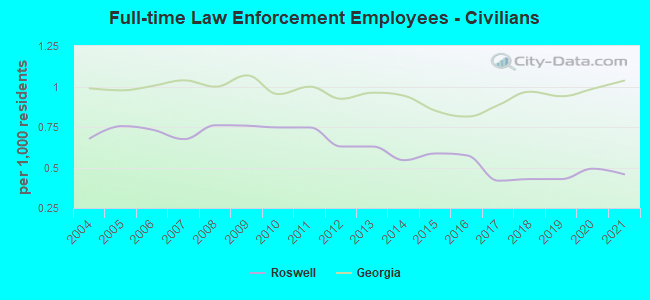
Full-time law enforcement employees in 2021, including police officers: 195 (151 officers - 129 male; 22 female).
| Officers per 1,000 residents here: | 1.57 |
| Georgia average: | 2.45 |
Full-time law enforcement employees in 2020, including police officers: 185 (138 officers - 118 male; 20 female).
| Officers per 1,000 residents here: | 1.45 |
| Georgia average: | 2.63 |
Full-time law enforcement employees in 2018, including police officers: 175 (134 officers - 114 male; 20 female).
| Officers per 1,000 residents here: | 1.40 |
| Georgia average: | 2.75 |
Full-time law enforcement employees in 2017, including police officers: 185 (145 officers - 122 male; 23 female).
| Officers per 1,000 residents here: | 1.52 |
| Georgia average: | 2.65 |
Full-time law enforcement employees in 2016, including police officers: 196 (141 officers - 121 male; 20 female).
| Officers per 1,000 residents here: | 1.47 |
| Georgia average: | 2.55 |
Full-time law enforcement employees in 2015, including police officers: 194 (138 officers - 122 male; 16 female).
| Officers per 1,000 residents here: | 1.45 |
| Georgia average: | 2.48 |
Full-time law enforcement employees in 2014, including police officers: 201 (149 officers - 127 male; 22 female).
| Officers per 1,000 residents here: | 1.56 |
| Georgia average: | 2.60 |
Full-time law enforcement employees in 2012, including police officers: 204 (146 officers - 129 male; 17 female).
| Officers per 1,000 residents here: | 1.58 |
| Georgia average: | 2.77 |
Full-time law enforcement employees in 2010, including police officers: 205 (139 officers - 122 male; 17 female).
| Officers per 1,000 residents here: | 1.57 |
| Georgia average: | 2.86 |
Full-time law enforcement employees in 2009, including police officers: 206 (139 officers - 122 male; 17 female).
| Officers per 1,000 residents here: | 1.57 |
| Georgia average: | 2.73 |
Full-time law enforcement employees in 2008, including police officers: 195 (128 officers - 111 male; 17 female).
| Officers per 1,000 residents here: | 1.45 |
| Georgia average: | 2.72 |
Full-time law enforcement employees in 2007, including police officers: 186 (126 officers - 111 male; 15 female).
| Officers per 1,000 residents here: | 1.42 |
| Georgia average: | 2.72 |
Full-time law enforcement employees in 2006, including police officers: 194 (129 officers - 115 male; 14 female).
| Officers per 1,000 residents here: | 1.45 |
| Georgia average: | 2.56 |
Full-time law enforcement employees in 2005, including police officers: 195 (129 officers - 115 male; 14 female).
| Officers per 1,000 residents here: | 1.48 |
| Georgia average: | 2.53 |
Full-time law enforcement employees in 2004, including police officers: 175 (121 officers - 107 male; 14 female).
| Officers per 1,000 residents here: | 1.52 |
| Georgia average: | 2.62 |


Zip codes: 30075.