Crime rate in Santa Fe, New Mexico (NM): murders, rapes, robberies, assaults, burglaries, thefts, auto thefts, arson, law enforcement employees, police officers, crime map
Crime rate in Santa Fe, NM
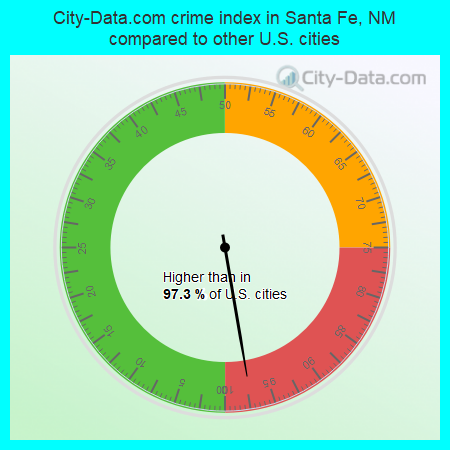
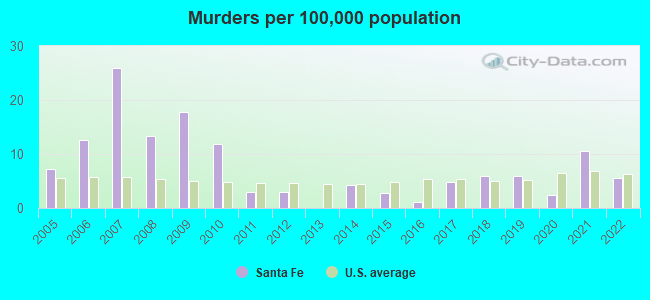
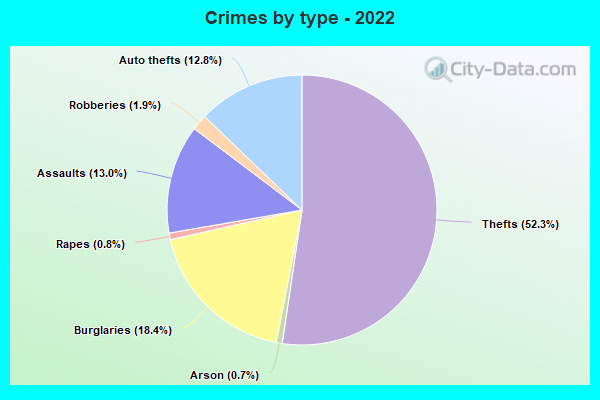
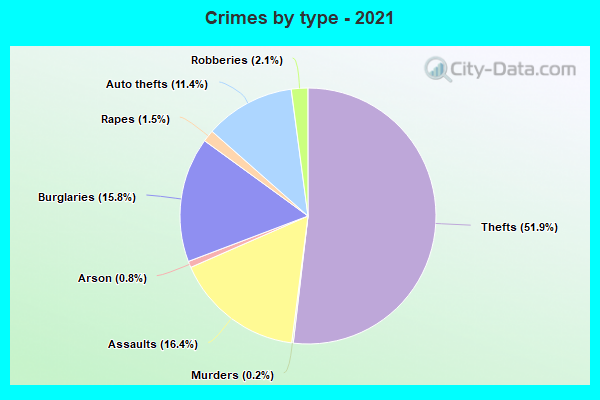
The 2022 crime rate in Santa Fe, NM is 492 (City-Data.com crime index), which is 2.0 times greater than the U.S. average. It was higher than in 96.5% U.S. cities. The 2022 Santa Fe crime rate rose by 12% compared to 2021. The number of homicides stood at 5 - a decrease of 4 compared to 2021. In the last 5 years Santa Fe has seen increasing violent crime and increasing property crime.See how dangerous Santa Fe, NM is compared to the nearest cities:
(Note: Higher means more crime)
(Note: Higher means more crime)
| Santa Fe: | 492.2 |
| Espanola: | 330.4 |
| Los Alamos: | 36.4 |
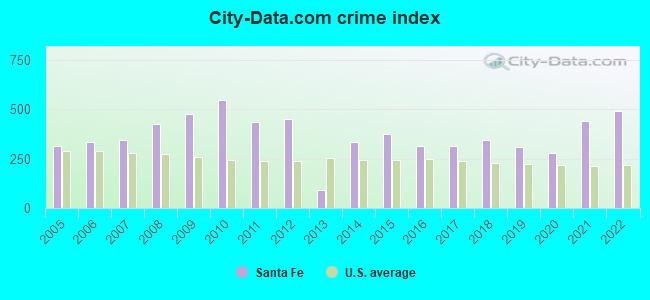
The City-Data.com crime index weighs serious crimes and violent crimes more heavily. Higher means more crime, U.S. average is 246.1. It adjusts for the number of visitors and daily workers commuting into cities.
- means the value is smaller than the state average.- means the value is about the same as the state average.
- means the value is bigger than the state average.
- means the value is much bigger than the state average.
According to our research of New Mexico and other state lists, there were 55 registered sex offenders living in Santa Fe, New Mexico as of May 19, 2024.
The ratio of all residents to sex offenders in Santa Fe is 1,525 to 1.
The ratio of registered sex offenders to all residents in this city is lower than the state average.
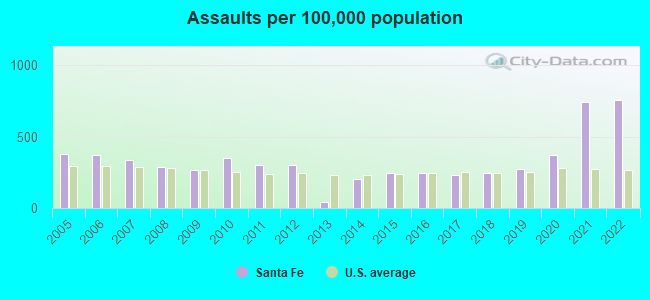
Violent crime rate in 2022
| Santa Fe: | 493.8 |
| U.S. Average: | 219.8 |
Violent crime rate in 2021
| Santa Fe: | 509.3 |
| U.S. Average: | 224.8 |
Violent crime rate in 2020
| Santa Fe: | 251.5 |
| U.S. Average: | 228.2 |
Violent crime rate in 2019
| Santa Fe: | 221.6 |
| U.S. Average: | 219.9 |
Violent crime rate in 2018
| Santa Fe: | 225.7 |
| U.S. Average: | 221.2 |
Violent crime rate in 2017
| Santa Fe: | 199.7 |
| U.S. Average: | 226.2 |
Violent crime rate in 2016
| Santa Fe: | 210.8 |
| U.S. Average: | 227.3 |
Violent crime rate in 2015
| Santa Fe: | 253.4 |
| U.S. Average: | 219.3 |
Violent crime rate in 2014
| Santa Fe: | 195.9 |
| U.S. Average: | 211.1 |
Violent crime rate in 2013
| Santa Fe: | 44.6 |
| U.S. Average: | 214.2 |
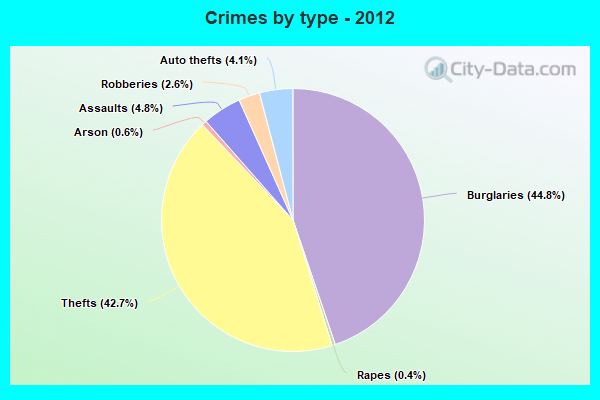
Violent crime rate in 2012
| Santa Fe: | 256.0 |
| U.S. Average: | 187.4 |
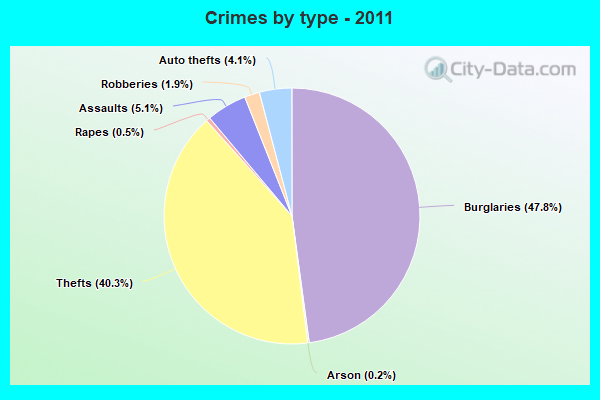
Violent crime rate in 2011
| Santa Fe: | 240.2 |
| U.S. Average: | 187.1 |
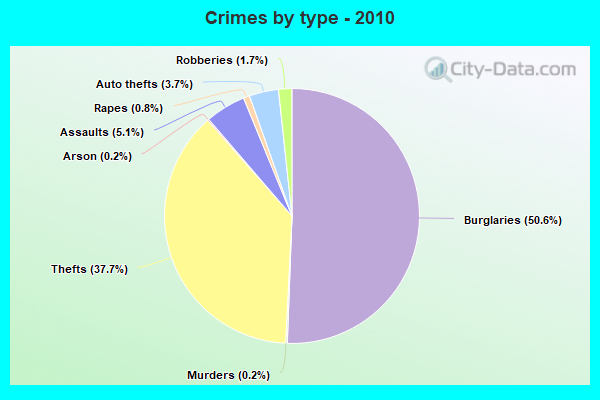
Violent crime rate in 2010
| Santa Fe: | 316.4 |
| U.S. Average: | 195.7 |
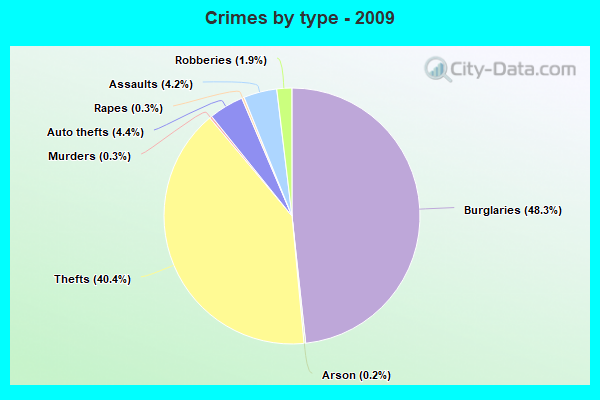
Violent crime rate in 2009
| Santa Fe: | 249.2 |
| U.S. Average: | 208.9 |
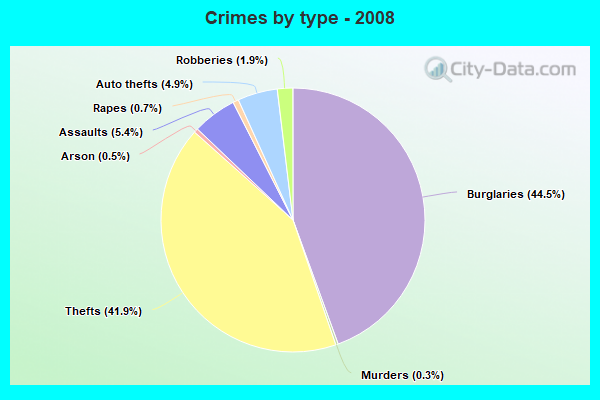
Violent crime rate in 2008
| Santa Fe: | 261.8 |
| U.S. Average: | 222.5 |
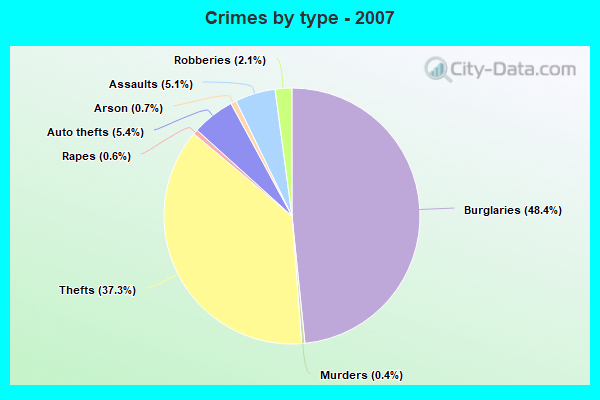
Violent crime rate in 2007
| Santa Fe: | 208.8 |
| U.S. Average: | 229.1 |
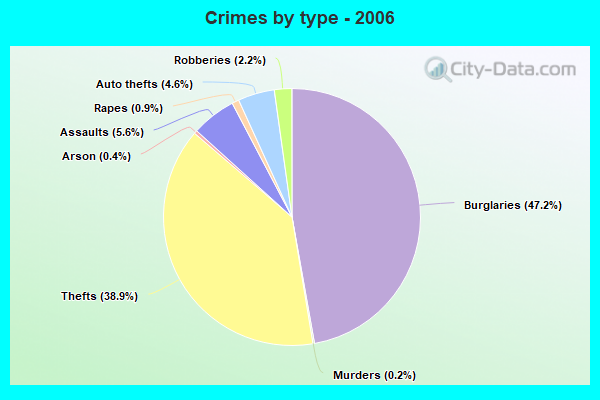
Violent crime rate in 2006
| Santa Fe: | 214.3 |
| U.S. Average: | 232.6 |
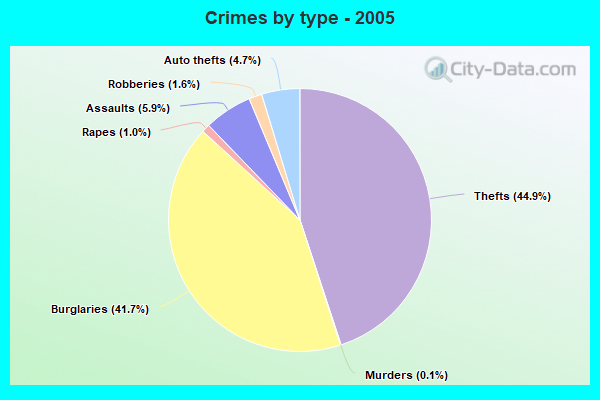
Violent crime rate in 2005
| Santa Fe: | 199.8 |
| U.S. Average: | 227.0 |
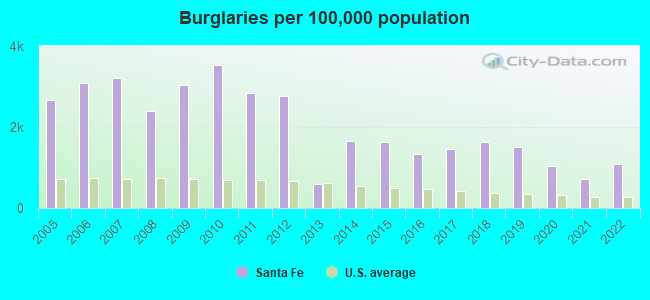
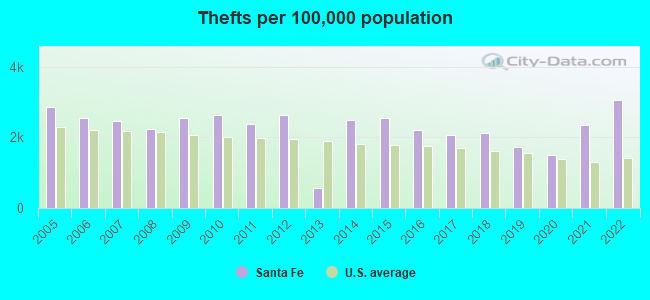
Property crime rate in 2022
| Santa Fe: | 480.7 |
| U.S. Average: | 166.5 |
Property crime rate in 2021
| Santa Fe: | 338.9 |
| U.S. Average: | 157.8 |
Property crime rate in 2020
| Santa Fe: | 322.9 |
| U.S. Average: | 169.6 |
Property crime rate in 2019
| Santa Fe: | 425.2 |
| U.S. Average: | 179.7 |
Property crime rate in 2018
| Santa Fe: | 473.5 |
| U.S. Average: | 190.2 |
Property crime rate in 2017
| Santa Fe: | 432.1 |
| U.S. Average: | 206.4 |
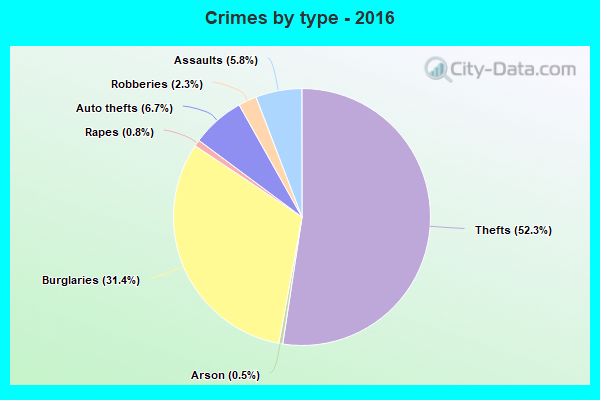
Property crime rate in 2016
| Santa Fe: | 418.4 |
| U.S. Average: | 216.6 |
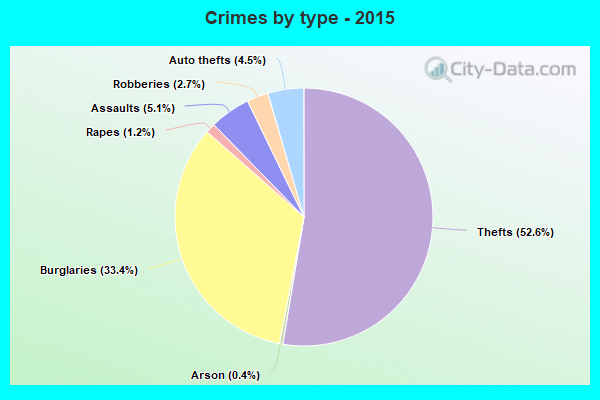
Property crime rate in 2015
| Santa Fe: | 484.4 |
| U.S. Average: | 221.5 |
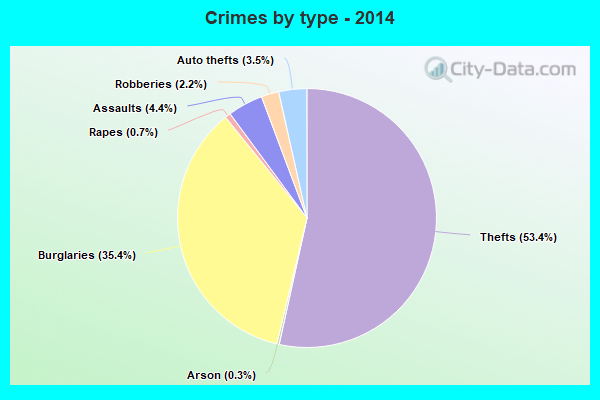
Property crime rate in 2014
| Santa Fe: | 476.6 |
| U.S. Average: | 230.8 |
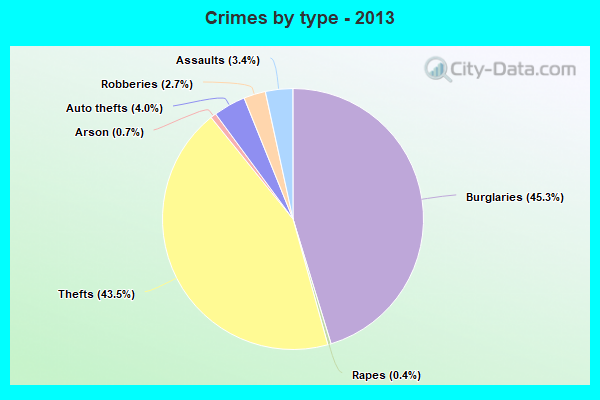
Property crime rate in 2013
| Santa Fe: | 151.8 |
| U.S. Average: | 250.4 |
Property crime rate in 2012
| Santa Fe: | 724.8 |
| U.S. Average: | 267.3 |
Property crime rate in 2011
| Santa Fe: | 721.3 |
| U.S. Average: | 273.5 |
Property crime rate in 2010
| Santa Fe: | 874.0 |
| U.S. Average: | 276.4 |
Property crime rate in 2009
| Santa Fe: | 777.5 |
| U.S. Average: | 285.6 |
Property crime rate in 2008
| Santa Fe: | 628.8 |
| U.S. Average: | 302.2 |
Property crime rate in 2007
| Santa Fe: | 515.4 |
| U.S. Average: | 309.2 |
Property crime rate in 2006
| Santa Fe: | 496.6 |
| U.S. Average: | 317.3 |
Property crime rate in 2005
| Santa Fe: | 453.7 |
| U.S. Average: | 322.3 |
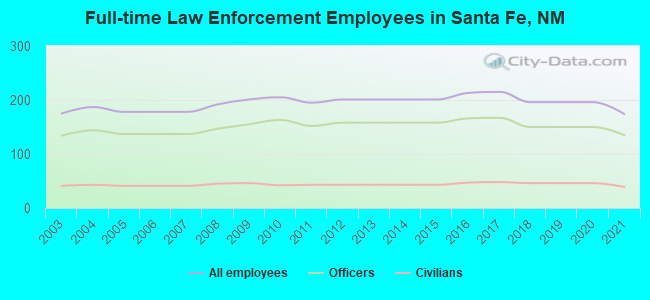
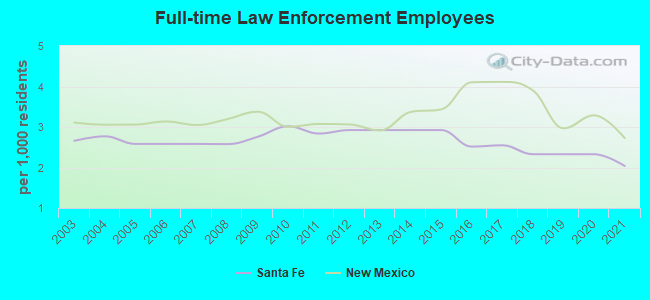
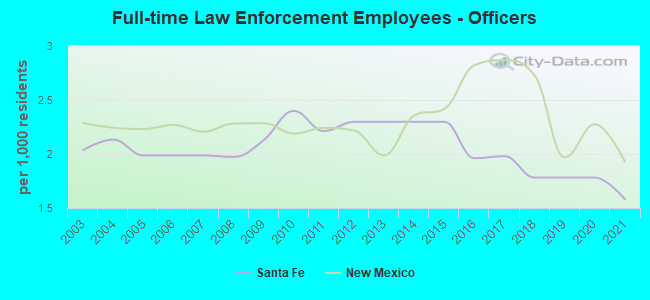
Full-time law enforcement employees in 2021, including police officers: 174 (135 officers - 115 male; 20 female).
| Officers per 1,000 residents here: | 1.58 |
| New Mexico average: | 1.93 |
Full-time law enforcement employees in 2018, including police officers: 196 (150 officers - 131 male; 19 female).
| Officers per 1,000 residents here: | 1.78 |
| New Mexico average: | 2.73 |
Full-time law enforcement employees in 2017, including police officers: 215 (167 officers - 146 male; 21 female).
| Officers per 1,000 residents here: | 1.98 |
| New Mexico average: | 2.87 |
Full-time law enforcement employees in 2016, including police officers: 213 (166 officers - 146 male; 20 female).
| Officers per 1,000 residents here: | 1.96 |
| New Mexico average: | 2.82 |
Full-time law enforcement employees in 2012, including police officers: 201 (158 officers - 134 male; 24 female).
| Officers per 1,000 residents here: | 2.30 |
| New Mexico average: | 2.22 |
Full-time law enforcement employees in 2011, including police officers: 195 (152 officers - 124 male; 28 female).
| Officers per 1,000 residents here: | 2.21 |
| New Mexico average: | 2.24 |
Full-time law enforcement employees in 2010, including police officers: 205 (163 officers - 137 male; 26 female).
| Officers per 1,000 residents here: | 2.40 |
| New Mexico average: | 2.19 |
Full-time law enforcement employees in 2009, including police officers: 201 (155 officers - 137 male; 18 female).
| Officers per 1,000 residents here: | 2.13 |
| New Mexico average: | 2.28 |
Full-time law enforcement employees in 2008, including police officers: 192 (147 officers - 130 male; 17 female).
| Officers per 1,000 residents here: | 1.97 |
| New Mexico average: | 2.28 |
Full-time law enforcement employees in 2005, including police officers: 178 (137 officers - 120 male; 17 female).
| Officers per 1,000 residents here: | 1.99 |
| New Mexico average: | 2.23 |
Full-time law enforcement employees in 2004, including police officers: 187 (144 officers - 128 male; 16 female).
| Officers per 1,000 residents here: | 2.13 |
| New Mexico average: | 2.24 |
Full-time law enforcement employees in 2003, including police officers: 175 (134 officers - 120 male; 14 female).
| Officers per 1,000 residents here: | 2.04 |
| New Mexico average: | 2.29 |

Zip codes: 87501.