Crime rate in Sugar Land, Texas (TX): murders, rapes, robberies, assaults, burglaries, thefts, auto thefts, arson, law enforcement employees, police officers, crime map
Crime rate in Sugar Land, TX
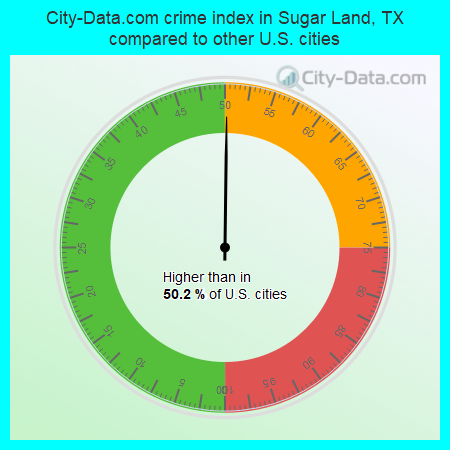
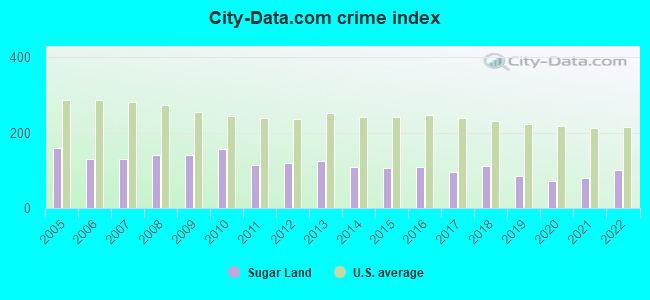
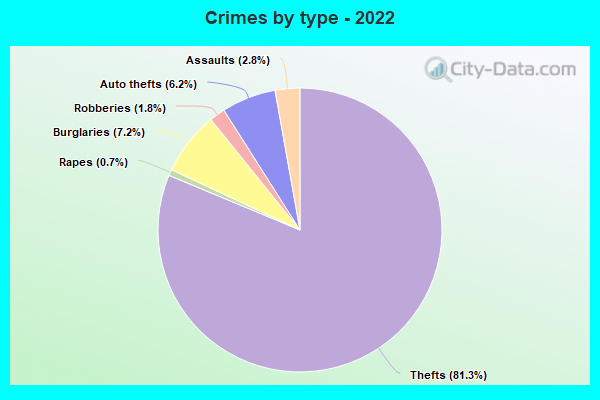
The 2022 crime rate in Sugar Land, TX is 100 (City-Data.com crime index), which is 2.5 times smaller than the U.S. average. It was higher than in 50.2% U.S. cities. The 2022 Sugar Land crime rate rose by 24% compared to 2021. In the last 5 years Sugar Land has seen decline of violent crime and decreasing property crime.See how dangerous Sugar Land, TX is compared to the nearest cities:
(Note: Higher means more crime)
(Note: Higher means more crime)
| Sugar Land: | 100.3 |
| Stafford: | 410.6 |
| Meadows Place: | 195.6 |
| Missouri City: | 112.5 |
| Richmond: | 200.2 |
| Arcola: | 224.3 |
| Bellaire: | 166.9 |
| Rosenberg: | 173.8 |
| Southside Place: | 118.1 |
The City-Data.com crime index weighs serious crimes and violent crimes more heavily. Higher means more crime, U.S. average is 246.1. It adjusts for the number of visitors and daily workers commuting into cities.
- means the value is smaller than the state average.- means the value is about the same as the state average.
According to our research of Texas and other state lists, there were 45 registered sex offenders living in Sugar Land, Texas as of May 18, 2024.
The ratio of all residents to sex offenders in Sugar Land is 2,064 to 1.
The ratio of registered sex offenders to all residents in this city is much lower than the state average.
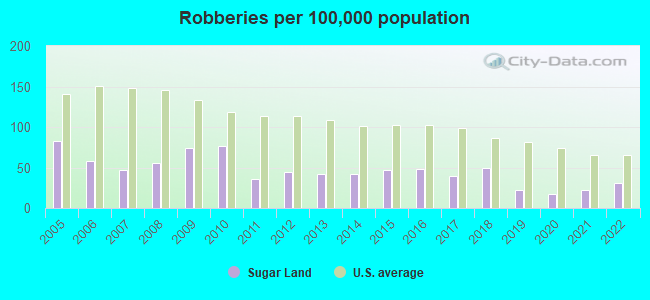
Violent crime rate in 2022
| Sugar Land: | 50.5 |
| U.S. Average: | 219.8 |
Violent crime rate in 2021
| Sugar Land: | 39.1 |
| U.S. Average: | 224.8 |
Violent crime rate in 2020
| Sugar Land: | 38.9 |
| U.S. Average: | 228.2 |
Violent crime rate in 2019
| Sugar Land: | 37.9 |
| U.S. Average: | 219.9 |
Violent crime rate in 2018
| Sugar Land: | 53.9 |
| U.S. Average: | 221.2 |
Violent crime rate in 2017
| Sugar Land: | 47.9 |
| U.S. Average: | 226.2 |
Violent crime rate in 2016
| Sugar Land: | 51.6 |
| U.S. Average: | 227.3 |
Violent crime rate in 2015
| Sugar Land: | 54.6 |
| U.S. Average: | 219.3 |
Violent crime rate in 2014
| Sugar Land: | 63.5 |
| U.S. Average: | 211.1 |
Violent crime rate in 2013
| Sugar Land: | 70.1 |
| U.S. Average: | 214.2 |
Violent crime rate in 2012
| Sugar Land: | 68.1 |
| U.S. Average: | 187.4 |
Violent crime rate in 2011
| Sugar Land: | 64.6 |
| U.S. Average: | 187.1 |
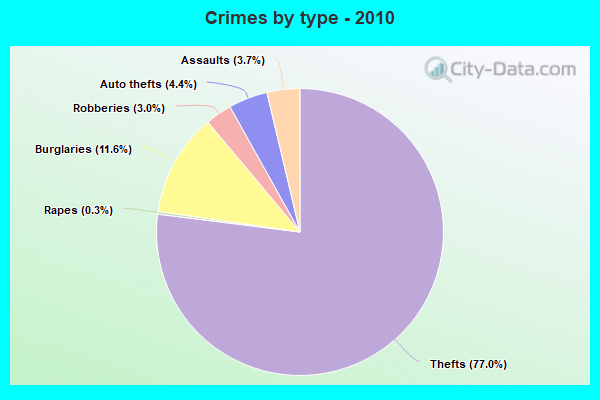
Violent crime rate in 2010
| Sugar Land: | 94.5 |
| U.S. Average: | 195.7 |
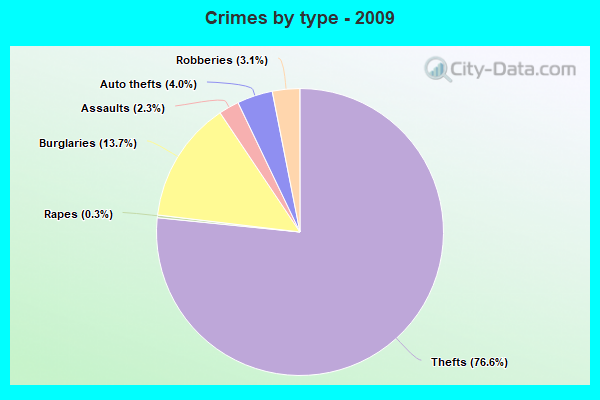
Violent crime rate in 2009
| Sugar Land: | 72.0 |
| U.S. Average: | 208.9 |
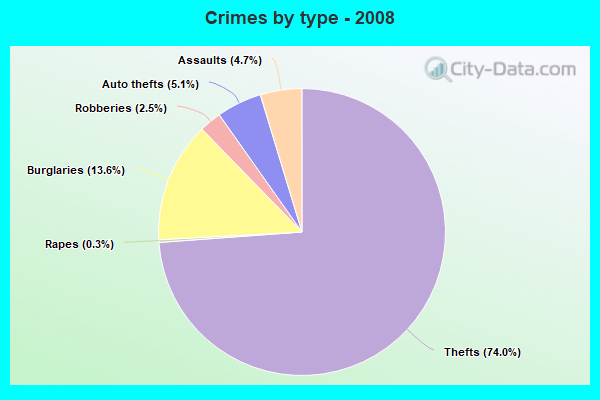
Violent crime rate in 2008
| Sugar Land: | 87.4 |
| U.S. Average: | 222.5 |
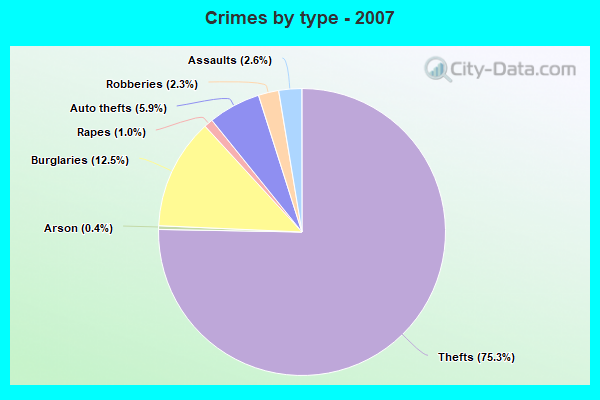
Violent crime rate in 2007
| Sugar Land: | 70.9 |
| U.S. Average: | 229.1 |
Violent crime rate in 2006
| Sugar Land: | 68.6 |
| U.S. Average: | 232.6 |
Violent crime rate in 2005
| Sugar Land: | 82.7 |
| U.S. Average: | 227.0 |
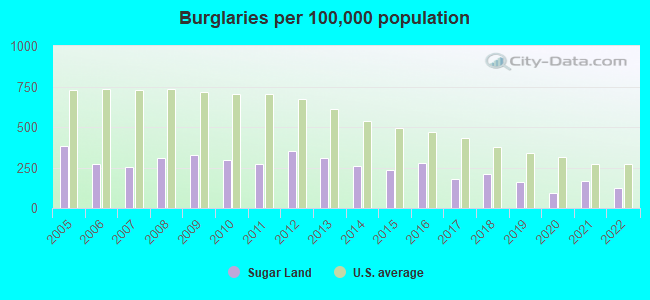
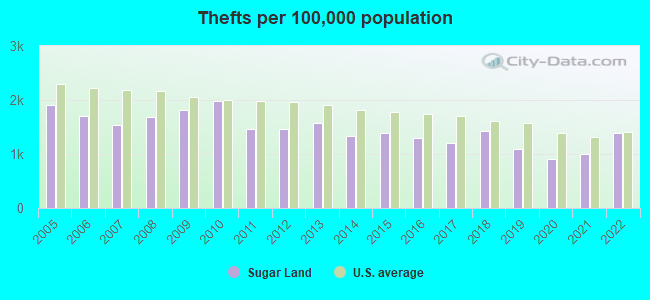
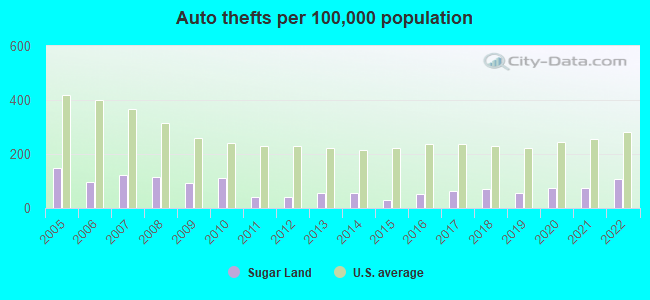
Property crime rate in 2022
| Sugar Land: | 109.9 |
| U.S. Average: | 166.5 |
Property crime rate in 2021
| Sugar Land: | 94.7 |
| U.S. Average: | 157.8 |
Property crime rate in 2020
| Sugar Land: | 74.8 |
| U.S. Average: | 169.6 |
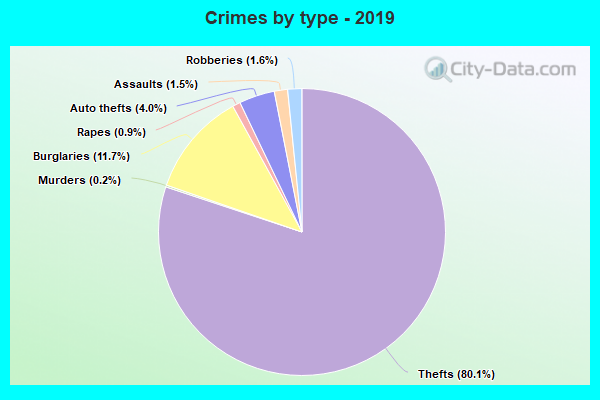
Property crime rate in 2019
| Sugar Land: | 94.1 |
| U.S. Average: | 179.7 |
Property crime rate in 2018
| Sugar Land: | 123.5 |
| U.S. Average: | 190.2 |
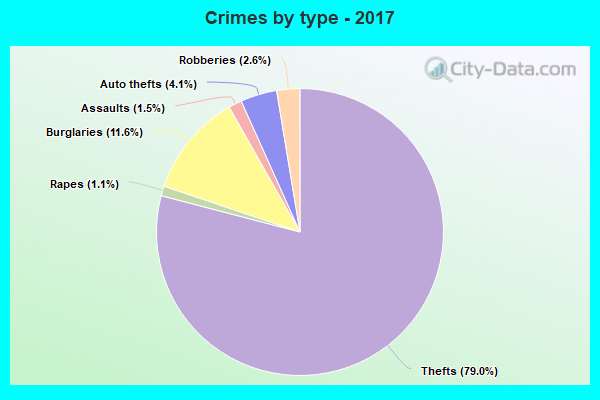
Property crime rate in 2017
| Sugar Land: | 104.4 |
| U.S. Average: | 206.4 |
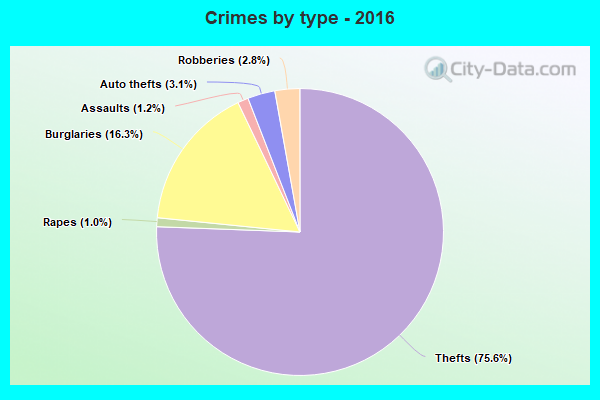
Property crime rate in 2016
| Sugar Land: | 128.0 |
| U.S. Average: | 216.6 |
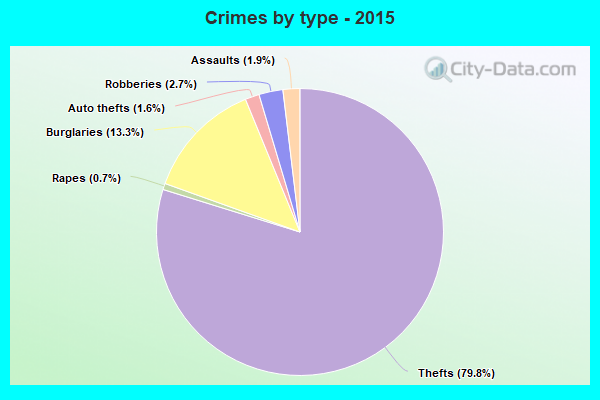
Property crime rate in 2015
| Sugar Land: | 120.4 |
| U.S. Average: | 221.5 |
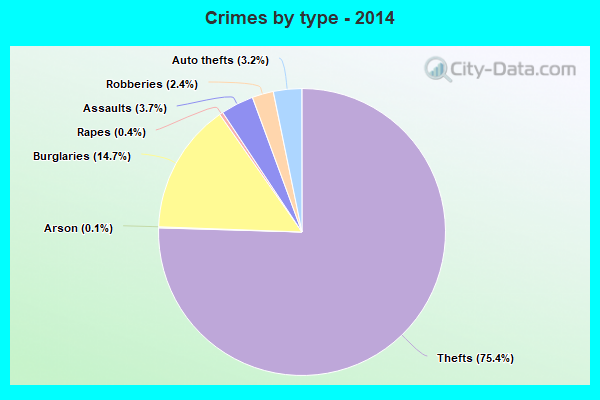
Property crime rate in 2014
| Sugar Land: | 126.7 |
| U.S. Average: | 230.8 |
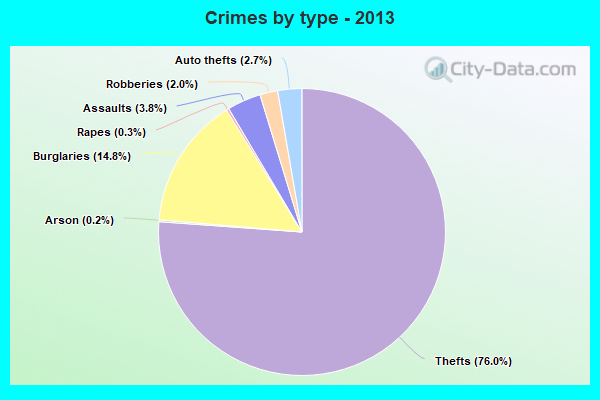
Property crime rate in 2013
| Sugar Land: | 148.2 |
| U.S. Average: | 250.4 |
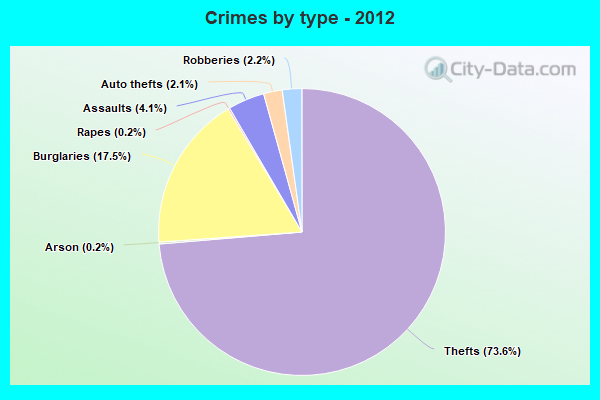
Property crime rate in 2012
| Sugar Land: | 149.4 |
| U.S. Average: | 267.3 |
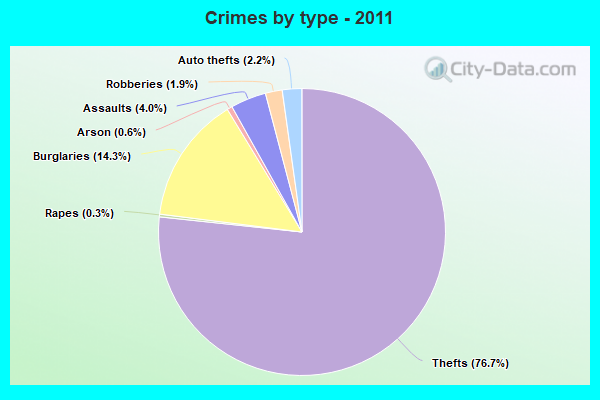
Property crime rate in 2011
| Sugar Land: | 133.9 |
| U.S. Average: | 273.5 |
Property crime rate in 2010
| Sugar Land: | 175.1 |
| U.S. Average: | 276.4 |
Property crime rate in 2009
| Sugar Land: | 170.5 |
| U.S. Average: | 285.6 |
Property crime rate in 2008
| Sugar Land: | 163.8 |
| U.S. Average: | 302.2 |
Property crime rate in 2007
| Sugar Land: | 146.0 |
| U.S. Average: | 309.2 |
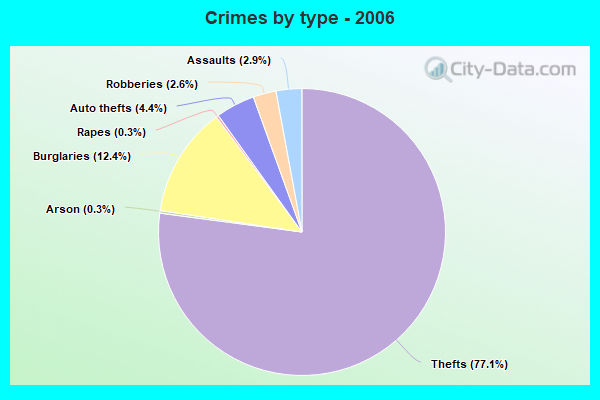
Property crime rate in 2006
| Sugar Land: | 153.6 |
| U.S. Average: | 317.3 |
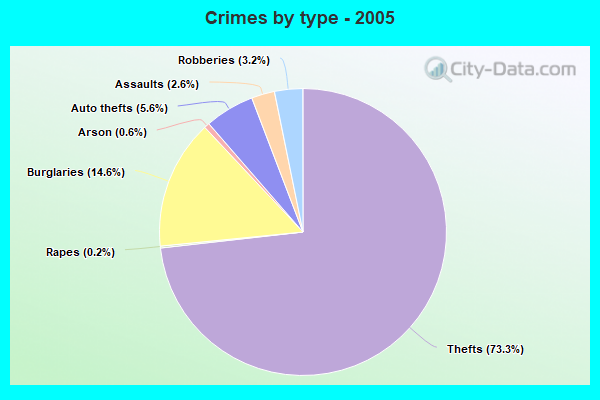
Property crime rate in 2005
| Sugar Land: | 193.6 |
| U.S. Average: | 322.3 |

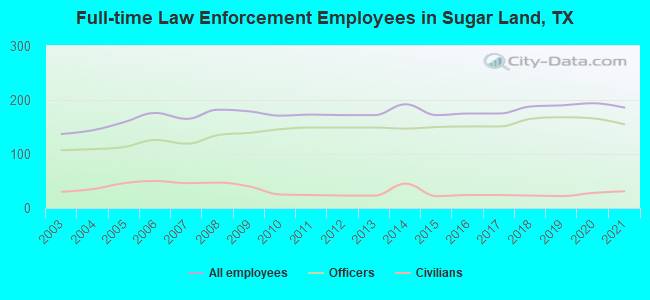
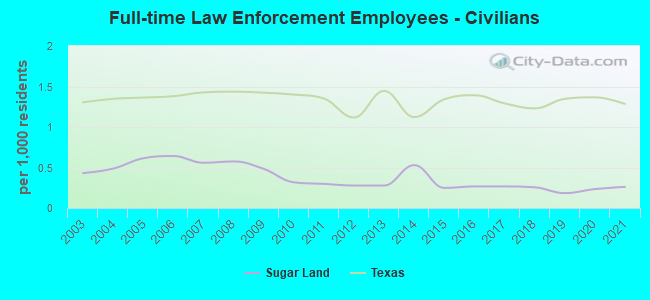
Full-time law enforcement employees in 2021, including police officers: 186 (155 officers - 138 male; 17 female).
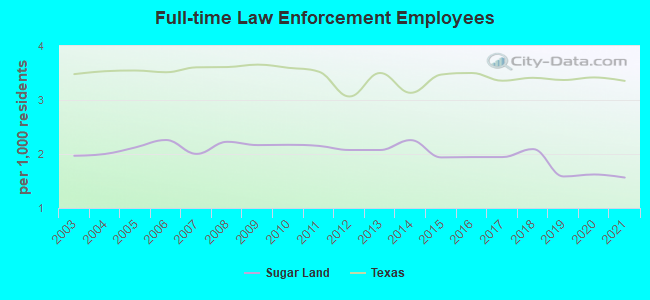
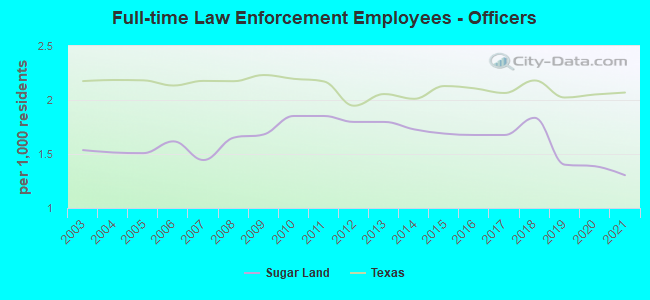
| Officers per 1,000 residents here: | 1.30 |
| Texas average: | 2.07 |
Full-time law enforcement employees in 2020, including police officers: 194 (166 officers - 149 male; 17 female).
| Officers per 1,000 residents here: | 1.39 |
| Texas average: | 2.05 |
Full-time law enforcement employees in 2019, including police officers: 190 (168 officers - 153 male; 15 female).
| Officers per 1,000 residents here: | 1.40 |
| Texas average: | 2.02 |
Full-time law enforcement employees in 2018, including police officers: 188 (165 officers - 148 male; 17 female).
| Officers per 1,000 residents here: | 1.83 |
| Texas average: | 2.18 |
Full-time law enforcement employees in 2016, including police officers: 175 (151 officers - 134 male; 17 female).
| Officers per 1,000 residents here: | 1.68 |
| Texas average: | 2.11 |
Full-time law enforcement employees in 2015, including police officers: 172 (150 officers - 134 male; 16 female).
| Officers per 1,000 residents here: | 1.69 |
| Texas average: | 2.13 |
Full-time law enforcement employees in 2014, including police officers: 192 (147 officers - 132 male; 15 female).
| Officers per 1,000 residents here: | 1.73 |
| Texas average: | 2.01 |
Full-time law enforcement employees in 2012, including police officers: 172 (149 officers - 134 male; 15 female).
| Officers per 1,000 residents here: | 1.80 |
| Texas average: | 1.95 |
Full-time law enforcement employees in 2011, including police officers: 173 (149 officers - 134 male; 15 female).
| Officers per 1,000 residents here: | 1.85 |
| Texas average: | 2.17 |
Full-time law enforcement employees in 2010, including police officers: 171 (146 officers - 132 male; 14 female).
| Officers per 1,000 residents here: | 1.85 |
| Texas average: | 2.20 |
Full-time law enforcement employees in 2009, including police officers: 179 (139 officers - 126 male; 13 female).
| Officers per 1,000 residents here: | 1.68 |
| Texas average: | 2.23 |
Full-time law enforcement employees in 2008, including police officers: 182 (135 officers - 123 male; 12 female).
| Officers per 1,000 residents here: | 1.65 |
| Texas average: | 2.17 |
Full-time law enforcement employees in 2007, including police officers: 165 (119 officers - 106 male; 13 female).
| Officers per 1,000 residents here: | 1.44 |
| Texas average: | 2.18 |
Full-time law enforcement employees in 2006, including police officers: 176 (126 officers - 111 male; 15 female).
| Officers per 1,000 residents here: | 1.62 |
| Texas average: | 2.13 |
Full-time law enforcement employees in 2005, including police officers: 159 (113 officers - 100 male; 13 female).
| Officers per 1,000 residents here: | 1.51 |
| Texas average: | 2.18 |
Full-time law enforcement employees in 2004, including police officers: 144 (109 officers - 96 male; 13 female).
| Officers per 1,000 residents here: | 1.51 |
| Texas average: | 2.19 |
Full-time law enforcement employees in 2003, including police officers: 137 (107 officers - 94 male; 13 female).
| Officers per 1,000 residents here: | 1.54 |
| Texas average: | 2.17 |

Zip codes: 77478.