Crime rate in Tempe, Arizona (AZ): murders, rapes, robberies, assaults, burglaries, thefts, auto thefts, arson, law enforcement employees, police officers, crime map
Crime rate in Tempe, AZ
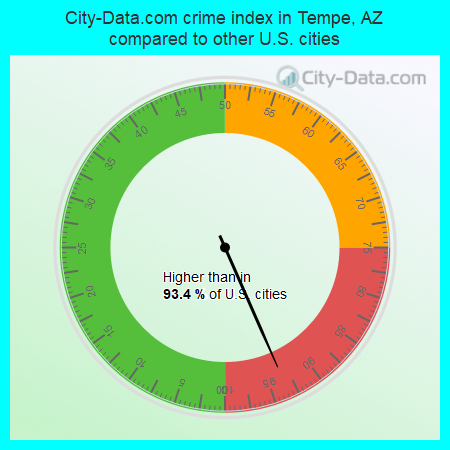
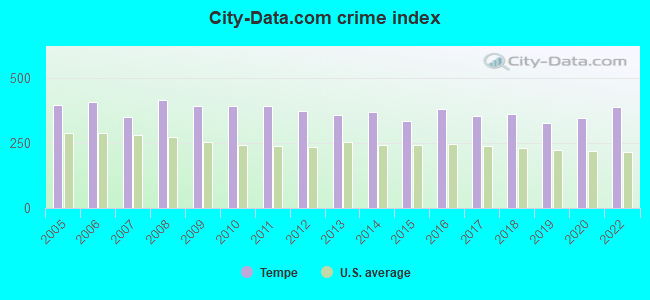
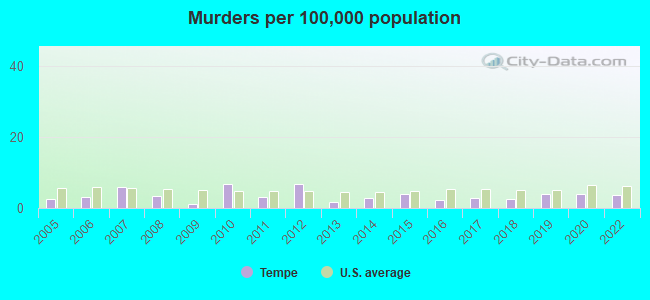
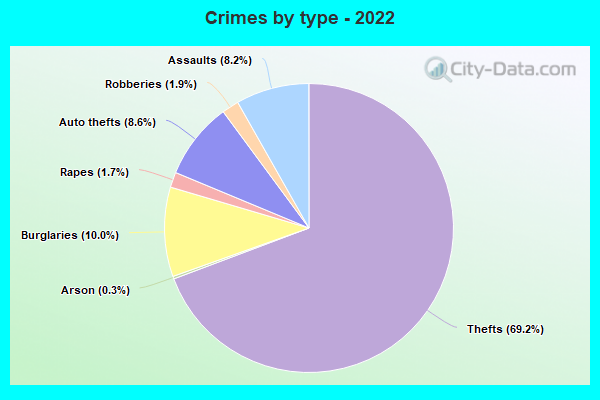
The 2022 crime rate in Tempe, AZ is 388 (City-Data.com crime index), which is 1.6 times higher than the U.S. average. It was higher than in 93.4% U.S. cities. The 2022 Tempe crime rate rose by 12% compared to 2020. The number of homicides stood at 7 - a decrease of 1 compared to 2020. In the last 5 years Tempe has seen increasing violent crime and increasing property crime.See how dangerous Tempe, AZ is compared to the nearest cities:
(Note: Higher means more crime)
(Note: Higher means more crime)
| Tempe: | 388.1 |
| Chandler: | 150.0 |
| Gilbert: | 88.4 |
| Mesa: | 215.2 |
| Paradise Valley: | 117.8 |
| Phoenix: | 395.1 |
| Scottsdale: | 146.3 |
| Tolleson: | 248.1 |
| Queen Creek: | 87.4 |
The City-Data.com crime index weighs serious crimes and violent crimes more heavily. Higher means more crime, U.S. average is 246.1. It adjusts for the number of visitors and daily workers commuting into cities.
- means the value is smaller than the state average.- means the value is about the same as the state average.
- means the value is bigger than the state average.
- means the value is much bigger than the state average.
According to our research of Arizona and other state lists, there were 71 registered sex offenders living in Tempe, Arizona as of May 19, 2024.
The ratio of all residents to sex offenders in Tempe is 2,570 to 1.
The ratio of registered sex offenders to all residents in this city is much lower than the state average.
Violent crime rate in 2022
| Tempe: | 339.2 |
| U.S. Average: | 219.8 |
Violent crime rate in 2020
| Tempe: | 319.9 |
| U.S. Average: | 228.2 |
Violent crime rate in 2019
| Tempe: | 268.2 |
| U.S. Average: | 219.9 |
Violent crime rate in 2018
| Tempe: | 292.8 |
| U.S. Average: | 221.2 |
Violent crime rate in 2017
| Tempe: | 281.9 |
| U.S. Average: | 226.2 |
Violent crime rate in 2016
| Tempe: | 299.2 |
| U.S. Average: | 227.3 |
Violent crime rate in 2015
| Tempe: | 240.1 |
| U.S. Average: | 219.3 |
Violent crime rate in 2014
| Tempe: | 270.0 |
| U.S. Average: | 211.1 |
Violent crime rate in 2013
| Tempe: | 267.7 |
| U.S. Average: | 214.2 |
Violent crime rate in 2012
| Tempe: | 287.5 |
| U.S. Average: | 187.4 |
Violent crime rate in 2011
| Tempe: | 258.2 |
| U.S. Average: | 187.1 |
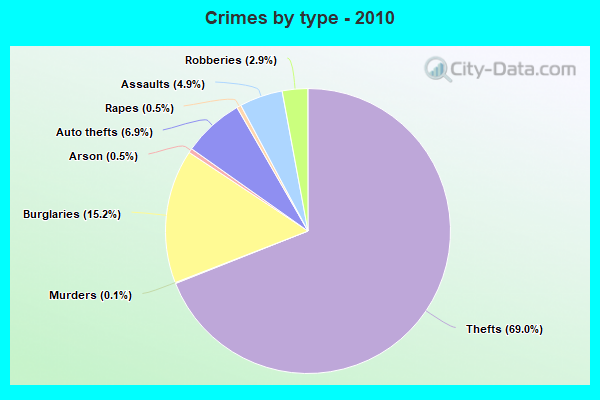
Violent crime rate in 2010
| Tempe: | 264.3 |
| U.S. Average: | 195.7 |
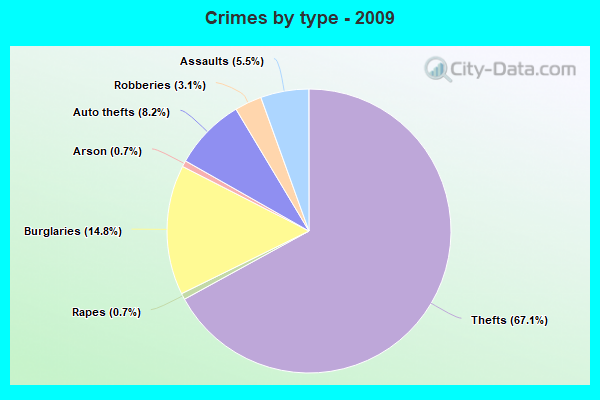
Violent crime rate in 2009
| Tempe: | 280.0 |
| U.S. Average: | 208.9 |
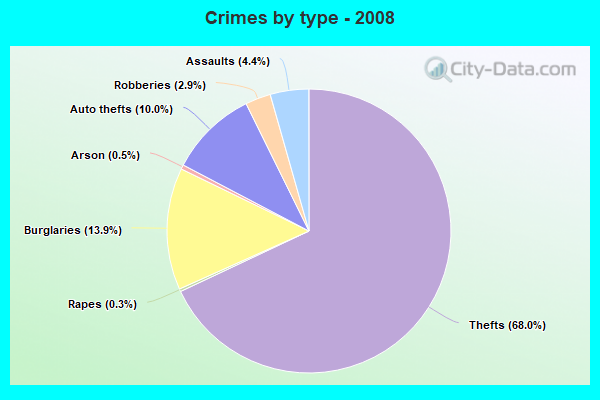
Violent crime rate in 2008
| Tempe: | 257.4 |
| U.S. Average: | 222.5 |
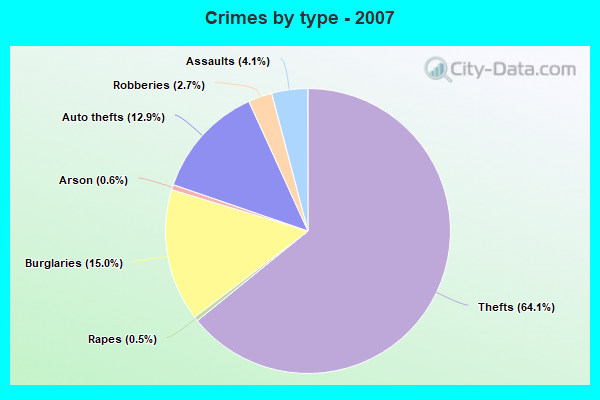
Violent crime rate in 2007
| Tempe: | 207.6 |
| U.S. Average: | 229.1 |
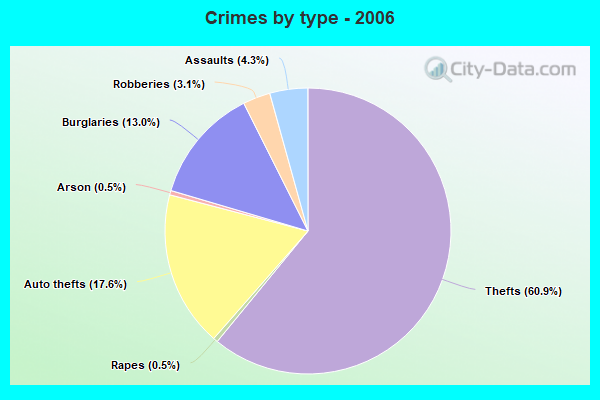
Violent crime rate in 2006
| Tempe: | 248.7 |
| U.S. Average: | 232.6 |
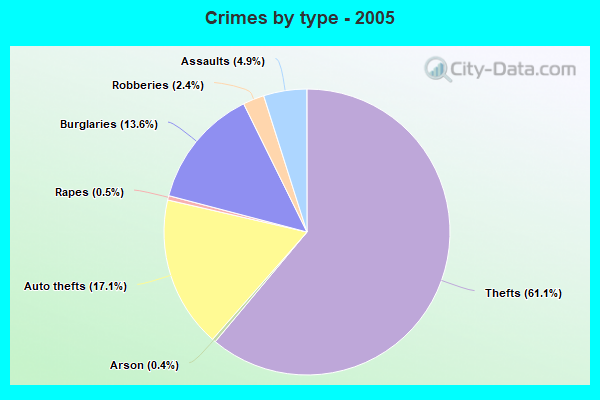
Violent crime rate in 2005
| Tempe: | 242.8 |
| U.S. Average: | 227.0 |
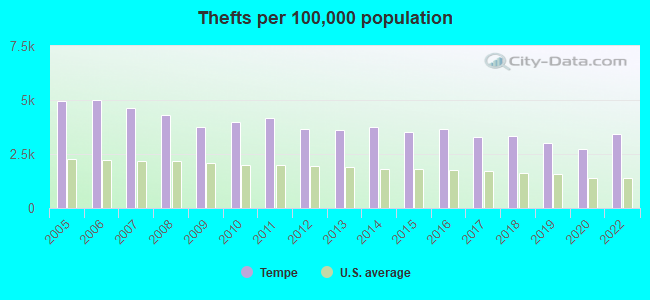
Property crime rate in 2022
| Tempe: | 333.3 |
| U.S. Average: | 166.5 |
Property crime rate in 2020
| Tempe: | 285.2 |
| U.S. Average: | 169.6 |
Property crime rate in 2019
| Tempe: | 290.1 |
| U.S. Average: | 179.7 |
Property crime rate in 2018
| Tempe: | 316.3 |
| U.S. Average: | 190.2 |
Property crime rate in 2017
| Tempe: | 318.2 |
| U.S. Average: | 206.4 |
Property crime rate in 2016
| Tempe: | 353.9 |
| U.S. Average: | 216.6 |
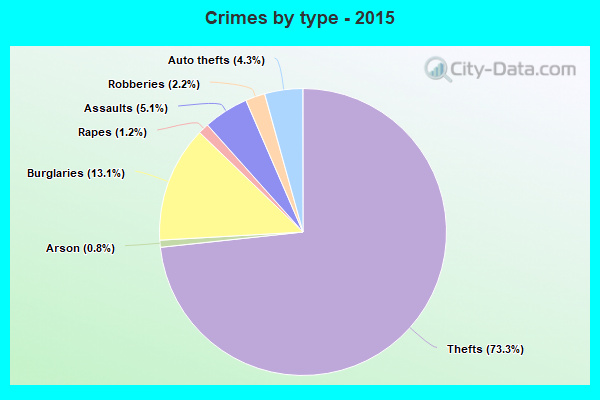
Property crime rate in 2015
| Tempe: | 332.8 |
| U.S. Average: | 221.5 |
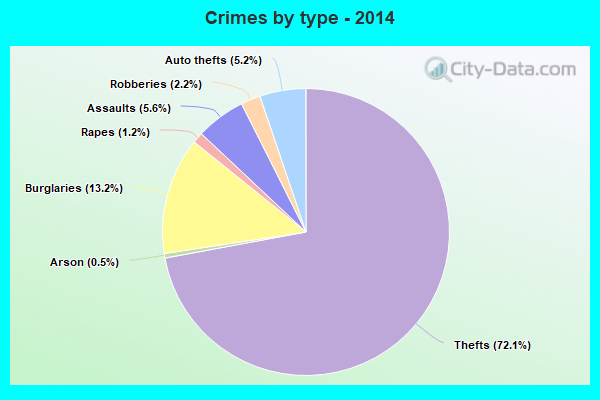
Property crime rate in 2014
| Tempe: | 368.0 |
| U.S. Average: | 230.8 |
Property crime rate in 2013
| Tempe: | 376.2 |
| U.S. Average: | 250.4 |
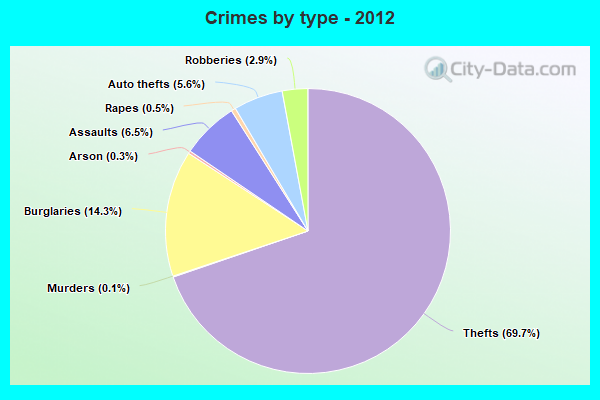
Property crime rate in 2012
| Tempe: | 377.9 |
| U.S. Average: | 267.3 |
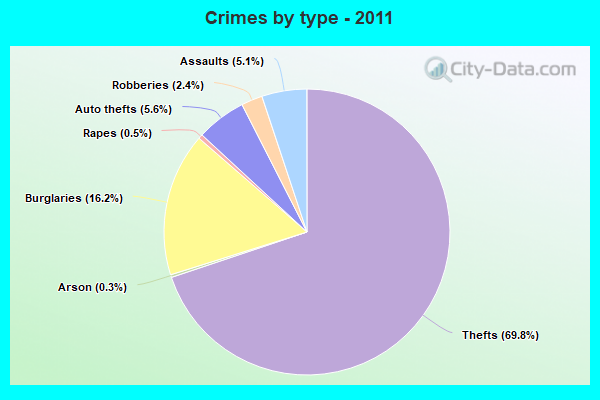
Property crime rate in 2011
| Tempe: | 450.3 |
| U.S. Average: | 273.5 |
Property crime rate in 2010
| Tempe: | 433.1 |
| U.S. Average: | 276.4 |
Property crime rate in 2009
| Tempe: | 424.0 |
| U.S. Average: | 285.6 |
Property crime rate in 2008
| Tempe: | 484.8 |
| U.S. Average: | 302.2 |
Property crime rate in 2007
| Tempe: | 416.1 |
| U.S. Average: | 309.2 |
Property crime rate in 2006
| Tempe: | 480.8 |
| U.S. Average: | 317.3 |
Property crime rate in 2005
| Tempe: | 477.8 |
| U.S. Average: | 322.3 |
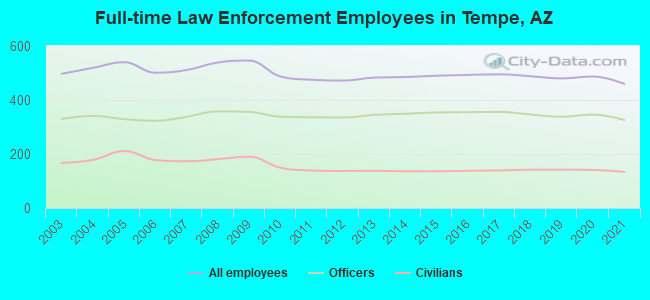
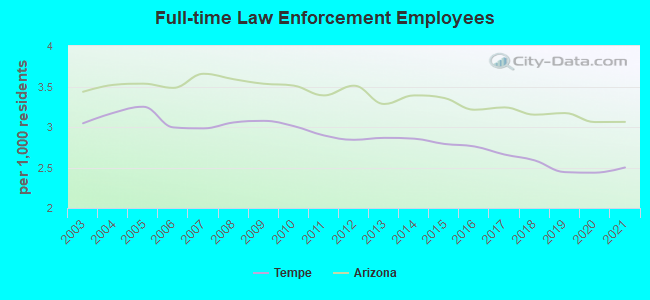
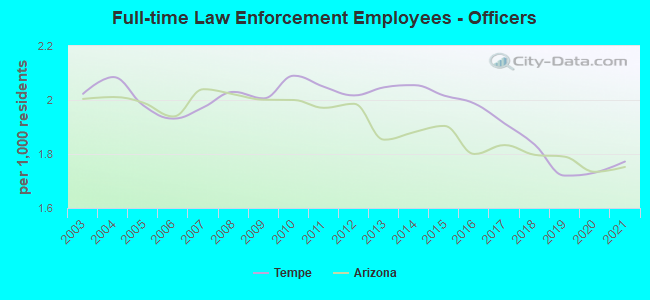
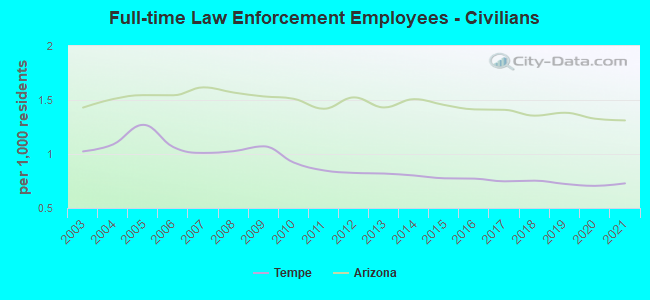
Full-time law enforcement employees in 2021, including police officers: 460 (326 officers - 272 male; 54 female).
| Officers per 1,000 residents here: | 1.77 |
| Arizona average: | 1.75 |
Full-time law enforcement employees in 2020, including police officers: 487 (346 officers - 286 male; 60 female).
| Officers per 1,000 residents here: | 1.73 |
| Arizona average: | 1.73 |
Full-time law enforcement employees in 2019, including police officers: 480 (338 officers - 283 male; 55 female).
| Officers per 1,000 residents here: | 1.72 |
| Arizona average: | 1.79 |
Full-time law enforcement employees in 2018, including police officers: 488 (346 officers - 289 male; 57 female).
| Officers per 1,000 residents here: | 1.84 |
| Arizona average: | 1.80 |
Full-time law enforcement employees in 2017, including police officers: 495 (356 officers - 298 male; 58 female).
| Officers per 1,000 residents here: | 1.91 |
| Arizona average: | 1.83 |
Full-time law enforcement employees in 2016, including police officers: 493 (355 officers - 297 male; 58 female).
| Officers per 1,000 residents here: | 1.99 |
| Arizona average: | 1.80 |
Full-time law enforcement employees in 2015, including police officers: 490 (354 officers - 297 male; 57 female).
| Officers per 1,000 residents here: | 2.02 |
| Arizona average: | 1.90 |
Full-time law enforcement employees in 2014, including police officers: 485 (349 officers - 293 male; 56 female).
| Officers per 1,000 residents here: | 2.06 |
| Arizona average: | 1.88 |
Full-time law enforcement employees in 2013, including police officers: 483 (345 officers - 295 male; 50 female).
| Officers per 1,000 residents here: | 2.05 |
| Arizona average: | 1.85 |
Full-time law enforcement employees in 2012, including police officers: 472 (335 officers - 290 male; 45 female).
| Officers per 1,000 residents here: | 2.02 |
| Arizona average: | 1.99 |
Full-time law enforcement employees in 2011, including police officers: 475 (336 officers - 292 male; 44 female).
| Officers per 1,000 residents here: | 2.05 |
| Arizona average: | 1.97 |
Full-time law enforcement employees in 2010, including police officers: 487 (338 officers - 292 male; 46 female).
| Officers per 1,000 residents here: | 2.09 |
| Arizona average: | 2.00 |
Full-time law enforcement employees in 2009, including police officers: 546 (356 officers - 308 male; 48 female).
| Officers per 1,000 residents here: | 2.01 |
| Arizona average: | 2.00 |
Full-time law enforcement employees in 2008, including police officers: 539 (358 officers - 310 male; 48 female).
| Officers per 1,000 residents here: | 2.03 |
| Arizona average: | 2.02 |
Full-time law enforcement employees in 2007, including police officers: 511 (338 officers - 286 male; 52 female).
| Officers per 1,000 residents here: | 1.97 |
| Arizona average: | 2.04 |
Full-time law enforcement employees in 2006, including police officers: 501 (323 officers - 272 male; 51 female).
| Officers per 1,000 residents here: | 1.93 |
| Arizona average: | 1.94 |
Full-time law enforcement employees in 2005, including police officers: 540 (329 officers - 283 male; 46 female).
| Officers per 1,000 residents here: | 1.98 |
| Arizona average: | 1.99 |
Full-time law enforcement employees in 2004, including police officers: 519 (341 officers - 290 male; 51 female).
| Officers per 1,000 residents here: | 2.09 |
| Arizona average: | 2.01 |
Full-time law enforcement employees in 2003, including police officers: 497 (330 officers - 281 male; 49 female).
| Officers per 1,000 residents here: | 2.02 |
| Arizona average: | 2.00 |


Zip codes: 85282.