Crime rate in Trafalgar, Indiana (IN): murders, rapes, robberies, assaults, burglaries, thefts, auto thefts, arson, crime map
Crime rate in Trafalgar, IN
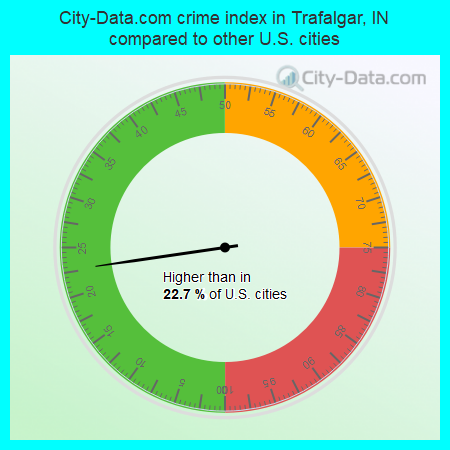
The 2022 crime rate in Trafalgar, IN is 36 (City-Data.com crime index), which is 6.8 times smaller than the U.S. average. It was higher than in 22.7% U.S. cities. The 2022 Trafalgar crime rate rose by 72% compared to 2021. In the last 5 years Trafalgar has seen decline of violent crime and decline of property crime.See how dangerous Trafalgar, IN is compared to the nearest cities:
(Note: Higher means more crime)
(Note: Higher means more crime)
| Trafalgar: | 36.3 |
| Princes Lakes: | 59.0 |
| Franklin: | 89.5 |
| Bargersville: | 55.1 |
| Whiteland: | 41.8 |
| New Whiteland: | 36.1 |
| Edinburgh: | 73.3 |
| Greenwood: | 120.5 |
| Martinsville: | 84.0 |
Type |
2020 |
2021 |
2022 |
|---|---|---|---|
| Murders (per 100,000) | 0 (0.0) | 0 (0.0) | 0 (0.0) |
| Rapes (per 100,000) | 1 (72.8) | 0 (0.0) | 0 (0.0) |
| Robberies (per 100,000) | 0 (0.0) | 0 (0.0) | 1 (63.7) |
| Assaults (per 100,000) | 0 (0.0) | 0 (0.0) | 0 (0.0) |
| Burglaries (per 100,000) | 0 (0.0) | 1 (68.3) | 1 (63.7) |
| Thefts (per 100,000) | 10 (728.3) | 6 (409.6) | 5 (318.7) |
| Auto thefts (per 100,000) | 2 (145.7) | 0 (0.0) | 0 (0.0) |
| Arson (per 100,000) | 0 (0.0) | 0 (0.0) | 0 (0.0) |
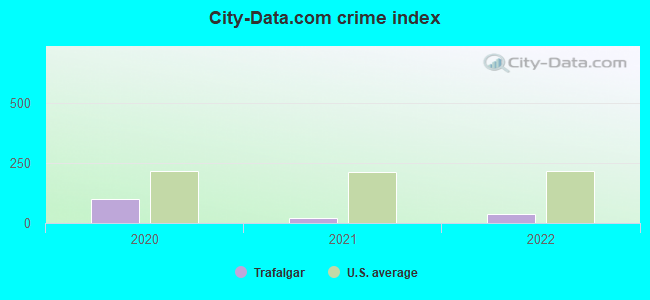
| City-Data.com crime index | 99.1 | 21.2 | 36.3 |
The City-Data.com crime index weighs serious crimes and violent crimes more heavily. Higher means more crime, U.S. average is 246.1. It adjusts for the number of visitors and daily workers commuting into cities.
Violent crime rate in 2022
| Trafalgar: | 31.9 |
| U.S. Average: | 219.8 |
Violent crime rate in 2021
| Trafalgar: | 0.0 |
| U.S. Average: | 224.8 |
Violent crime rate in 2020
| Trafalgar: | 72.8 |
| U.S. Average: | 228.2 |
Property crime rate in 2022
| Trafalgar: | 28.7 |
| U.S. Average: | 166.5 |
Property crime rate in 2021
| Trafalgar: | 34.1 |
| U.S. Average: | 157.8 |
Property crime rate in 2020
| Trafalgar: | 58.3 |
| U.S. Average: | 169.6 |


Zip codes: 46181.