Crime rate in Tuscaloosa, Alabama (AL): murders, rapes, robberies, assaults, burglaries, thefts, auto thefts, arson, law enforcement employees, police officers, crime map
Crime rate in Tuscaloosa, AL
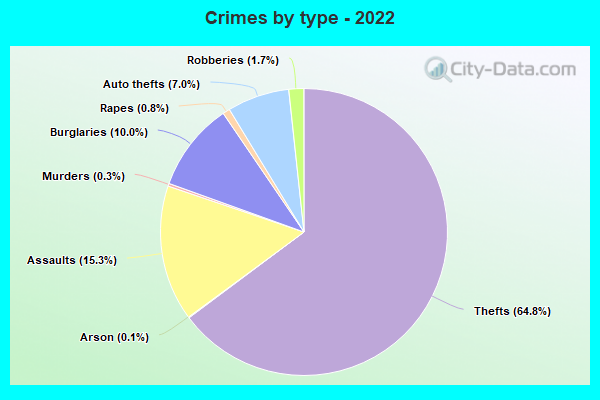
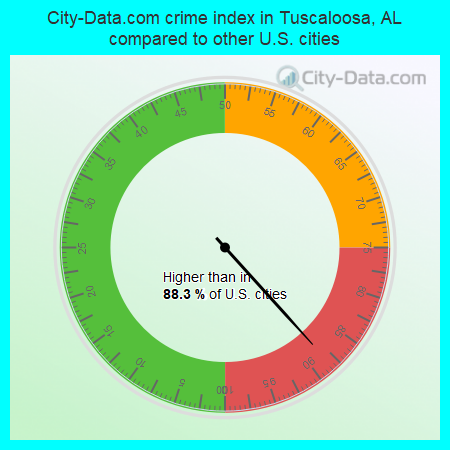
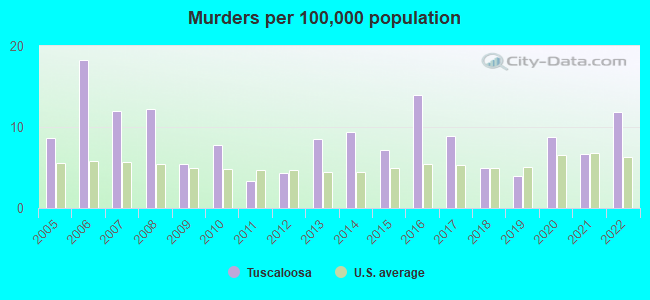
The 2022 crime rate in Tuscaloosa, AL is 307 (City-Data.com crime index), which is 1.2 times higher than the U.S. average. It was higher than in 88.3% U.S. cities. The 2022 Tuscaloosa crime rate rose by 188% compared to 2021. The number of homicides stood at 12 - an increase of 5 compared to 2021. In the last 5 years Tuscaloosa has seen rise of violent crime and decline of property crime.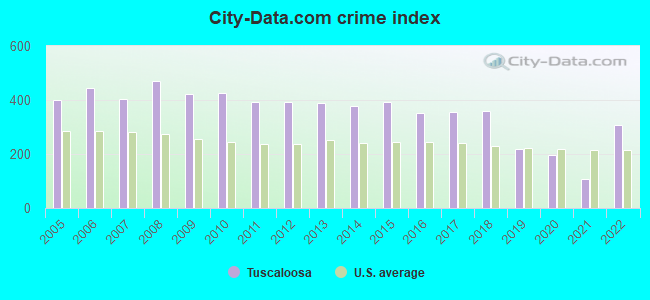
The City-Data.com crime index weighs serious crimes and violent crimes more heavily. Higher means more crime, U.S. average is 246.1. It adjusts for the number of visitors and daily workers commuting into cities.
- means the value is smaller than the state average.- means the value is about the same as the state average.
- means the value is bigger than the state average.
- means the value is much bigger than the state average.
According to our research of Alabama and other state lists, there were 120 registered sex offenders living in Tuscaloosa, Alabama as of May 22, 2024.
The ratio of all residents to sex offenders in Tuscaloosa is 807 to 1.
The ratio of registered sex offenders to all residents in this city is lower than the state average.
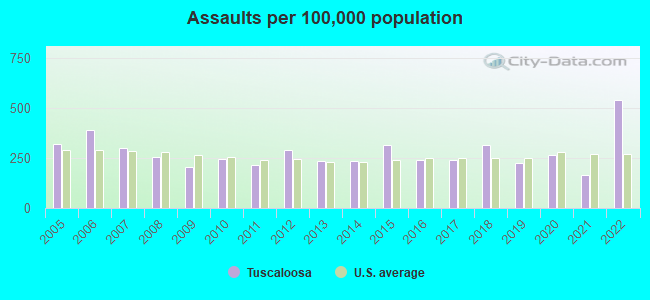
Violent crime rate in 2022
| Tuscaloosa: | 350.0 |
| U.S. Average: | 219.8 |
Violent crime rate in 2021
| Tuscaloosa: | 122.4 |
| U.S. Average: | 224.8 |
Violent crime rate in 2020
| Tuscaloosa: | 194.8 |
| U.S. Average: | 228.2 |
Violent crime rate in 2019
| Tuscaloosa: | 195.1 |
| U.S. Average: | 219.9 |
Violent crime rate in 2018
| Tuscaloosa: | 283.0 |
| U.S. Average: | 221.2 |
Violent crime rate in 2017
| Tuscaloosa: | 274.4 |
| U.S. Average: | 226.2 |
Violent crime rate in 2016
| Tuscaloosa: | 288.2 |
| U.S. Average: | 227.3 |
Violent crime rate in 2015
| Tuscaloosa: | 321.0 |
| U.S. Average: | 219.3 |
Violent crime rate in 2014
| Tuscaloosa: | 283.2 |
| U.S. Average: | 211.1 |
Violent crime rate in 2013
| Tuscaloosa: | 266.7 |
| U.S. Average: | 214.2 |
Violent crime rate in 2012
| Tuscaloosa: | 286.5 |
| U.S. Average: | 187.4 |
Violent crime rate in 2011
| Tuscaloosa: | 264.0 |
| U.S. Average: | 187.1 |
Violent crime rate in 2010
| Tuscaloosa: | 276.9 |
| U.S. Average: | 195.7 |
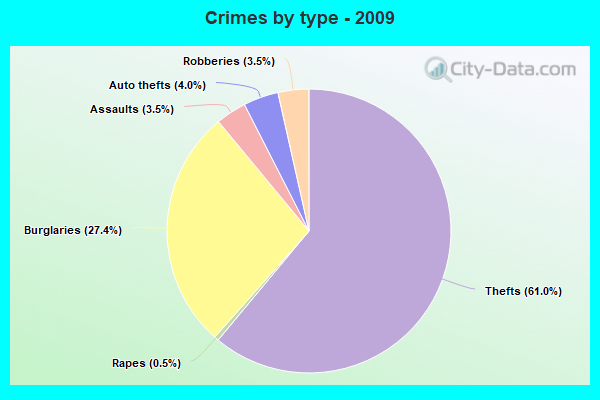
Violent crime rate in 2009
| Tuscaloosa: | 251.4 |
| U.S. Average: | 208.9 |
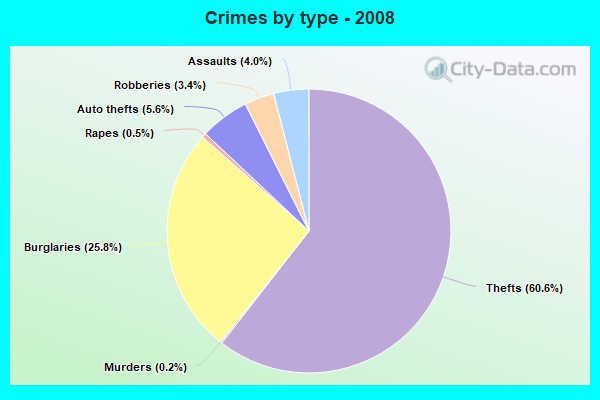
Violent crime rate in 2008
| Tuscaloosa: | 294.5 |
| U.S. Average: | 222.5 |
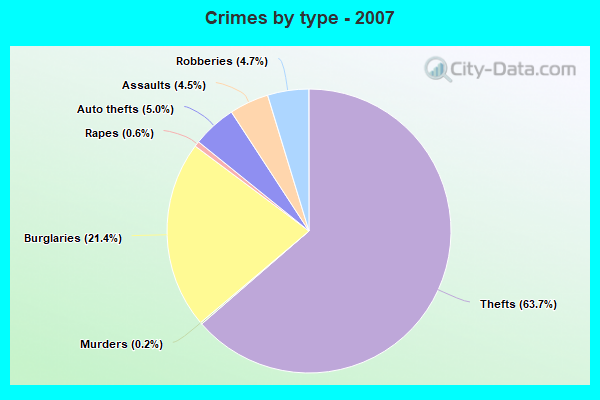
Violent crime rate in 2007
| Tuscaloosa: | 295.3 |
| U.S. Average: | 229.1 |
Violent crime rate in 2006
| Tuscaloosa: | 338.9 |
| U.S. Average: | 232.6 |
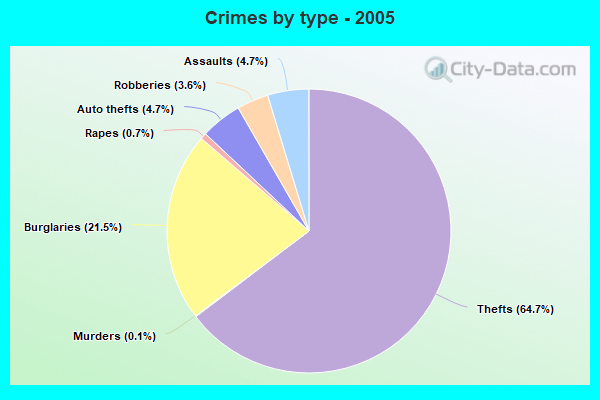
Violent crime rate in 2005
| Tuscaloosa: | 279.5 |
| U.S. Average: | 227.0 |
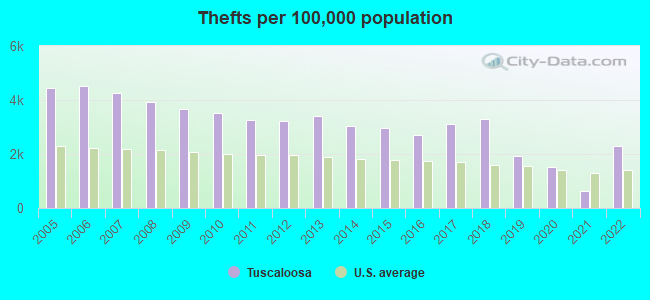
Property crime rate in 2022
| Tuscaloosa: | 221.6 |
| U.S. Average: | 166.5 |
Property crime rate in 2021
| Tuscaloosa: | 69.6 |
| U.S. Average: | 157.8 |
Property crime rate in 2020
| Tuscaloosa: | 163.4 |
| U.S. Average: | 169.6 |
Property crime rate in 2019
| Tuscaloosa: | 201.7 |
| U.S. Average: | 179.7 |
Property crime rate in 2018
| Tuscaloosa: | 358.9 |
| U.S. Average: | 190.2 |
Property crime rate in 2017
| Tuscaloosa: | 346.8 |
| U.S. Average: | 206.4 |
Property crime rate in 2016
| Tuscaloosa: | 328.9 |
| U.S. Average: | 216.6 |
Property crime rate in 2015
| Tuscaloosa: | 409.1 |
| U.S. Average: | 221.5 |
Property crime rate in 2014
| Tuscaloosa: | 395.7 |
| U.S. Average: | 230.8 |
Property crime rate in 2013
| Tuscaloosa: | 441.4 |
| U.S. Average: | 250.4 |
Property crime rate in 2012
| Tuscaloosa: | 451.2 |
| U.S. Average: | 267.3 |
Property crime rate in 2011
| Tuscaloosa: | 469.1 |
| U.S. Average: | 273.5 |
Property crime rate in 2010
| Tuscaloosa: | 528.9 |
| U.S. Average: | 276.4 |
Property crime rate in 2009
| Tuscaloosa: | 547.7 |
| U.S. Average: | 285.6 |
Property crime rate in 2008
| Tuscaloosa: | 587.6 |
| U.S. Average: | 302.2 |
Property crime rate in 2007
| Tuscaloosa: | 438.9 |
| U.S. Average: | 309.2 |
Property crime rate in 2006
| Tuscaloosa: | 464.6 |
| U.S. Average: | 317.3 |
Property crime rate in 2005
| Tuscaloosa: | 452.3 |
| U.S. Average: | 322.3 |
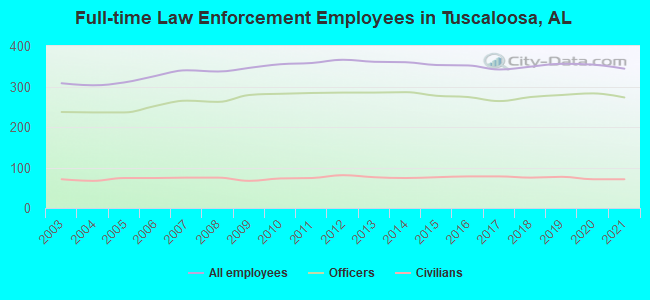
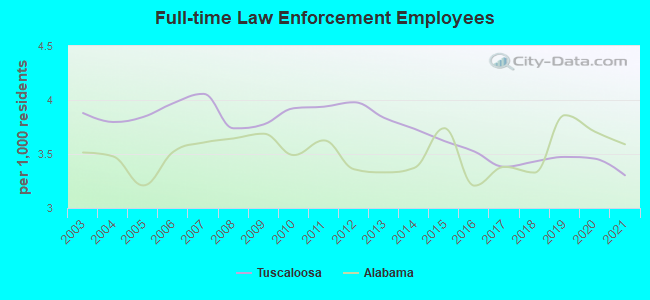
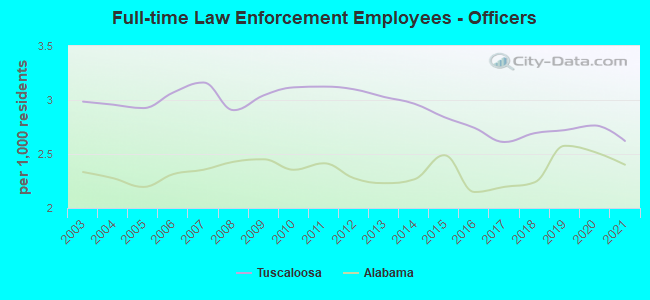
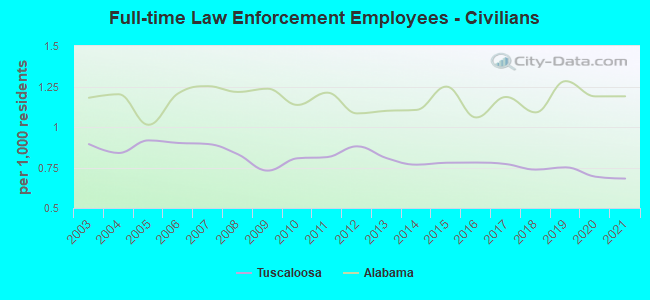
Full-time law enforcement employees in 2021, including police officers: 344 (273 officers - 254 male; 19 female).
| Officers per 1,000 residents here: | 2.62 |
| Alabama average: | 2.40 |
Full-time law enforcement employees in 2020, including police officers: 354 (283 officers - 263 male; 20 female).
| Officers per 1,000 residents here: | 2.76 |
| Alabama average: | 2.52 |
Full-time law enforcement employees in 2019, including police officers: 356 (279 officers - 260 male; 19 female).
| Officers per 1,000 residents here: | 2.72 |
| Alabama average: | 2.58 |
Full-time law enforcement employees in 2018, including police officers: 349 (274 officers - 248 male; 26 female).
| Officers per 1,000 residents here: | 2.69 |
| Alabama average: | 2.24 |
Full-time law enforcement employees in 2017, including police officers: 342 (264 officers - 242 male; 22 female).
| Officers per 1,000 residents here: | 2.61 |
| Alabama average: | 2.20 |
Full-time law enforcement employees in 2016, including police officers: 352 (274 officers - 253 male; 21 female).
| Officers per 1,000 residents here: | 2.74 |
| Alabama average: | 2.15 |
Full-time law enforcement employees in 2015, including police officers: 353 (277 officers - 258 male; 19 female).
| Officers per 1,000 residents here: | 2.84 |
| Alabama average: | 2.49 |
Full-time law enforcement employees in 2014, including police officers: 360 (286 officers - 266 male; 20 female).
| Officers per 1,000 residents here: | 2.97 |
| Alabama average: | 2.27 |
Full-time law enforcement employees in 2013, including police officers: 361 (285 officers - 264 male; 21 female).
| Officers per 1,000 residents here: | 3.03 |
| Alabama average: | 2.23 |
Full-time law enforcement employees in 2012, including police officers: 366 (285 officers - 265 male; 20 female).
| Officers per 1,000 residents here: | 3.10 |
| Alabama average: | 2.28 |
Full-time law enforcement employees in 2011, including police officers: 358 (284 officers - 266 male; 18 female).
| Officers per 1,000 residents here: | 3.12 |
| Alabama average: | 2.41 |
Full-time law enforcement employees in 2010, including police officers: 355 (282 officers - 264 male; 18 female).
| Officers per 1,000 residents here: | 3.12 |
| Alabama average: | 2.35 |
Full-time law enforcement employees in 2009, including police officers: 346 (279 officers - 263 male; 16 female).
| Officers per 1,000 residents here: | 3.04 |
| Alabama average: | 2.45 |
Full-time law enforcement employees in 2008, including police officers: 337 (262 officers - 247 male; 15 female).
| Officers per 1,000 residents here: | 2.91 |
| Alabama average: | 2.43 |
Full-time law enforcement employees in 2007, including police officers: 340 (265 officers - 251 male; 14 female).
| Officers per 1,000 residents here: | 3.16 |
| Alabama average: | 2.35 |
Full-time law enforcement employees in 2006, including police officers: 326 (252 officers - 239 male; 13 female).
| Officers per 1,000 residents here: | 3.07 |
| Alabama average: | 2.31 |
Full-time law enforcement employees in 2005, including police officers: 310 (236 officers - 222 male; 14 female).
| Officers per 1,000 residents here: | 2.93 |
| Alabama average: | 2.20 |
Full-time law enforcement employees in 2004, including police officers: 303 (236 officers - 220 male; 16 female).
| Officers per 1,000 residents here: | 2.96 |
| Alabama average: | 2.28 |
Full-time law enforcement employees in 2003, including police officers: 308 (237 officers - 221 male; 16 female).
| Officers per 1,000 residents here: | 2.98 |
| Alabama average: | 2.33 |