Crime rate in Waterbury, Connecticut (CT): murders, rapes, robberies, assaults, burglaries, thefts, auto thefts, arson, law enforcement employees, police officers, crime map
Crime rate in Waterbury, CT
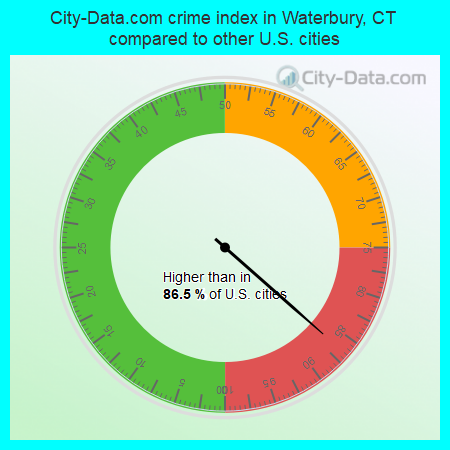
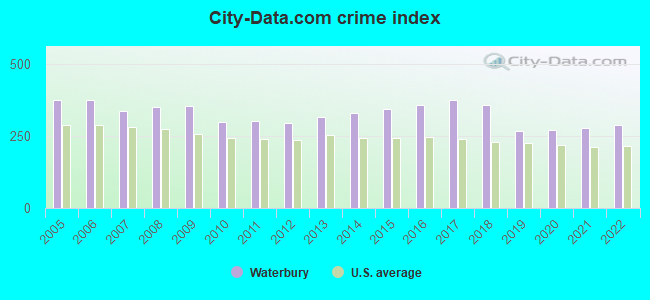
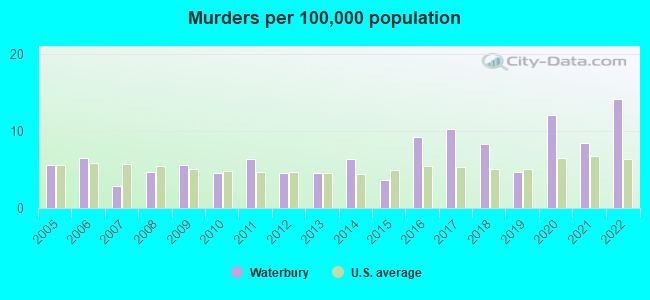
The 2022 crime rate in Waterbury, CT is 287 (City-Data.com crime index), which is about the average for the U.S. cities. It was higher than in 86.5% U.S. cities. The 2022 Waterbury crime rate rose by 4% compared to 2021. The number of homicides stood at 16 - an increase of 7 compared to 2021. In the last 5 years Waterbury has seen decreasing violent crime and decreasing property crime.See how dangerous Waterbury, CT is compared to the nearest cities:
(Note: Higher means more crime)
(Note: Higher means more crime)
| Waterbury: | 287.4 |
| Wolcott: | 63.2 |
| Middlebury: | 31.1 |
| Naugatuck: | 91.2 |
| Watertown: | 86.2 |
| Cheshire: | 38.7 |
| Plymouth: | 32.5 |
| Thomaston: | 43.5 |
| Southington: | 116.1 |
The City-Data.com crime index weighs serious crimes and violent crimes more heavily. Higher means more crime, U.S. average is 246.1. It adjusts for the number of visitors and daily workers commuting into cities.
- means the value is smaller than the state average.- means the value is about the same as the state average.
- means the value is bigger than the state average.
- means the value is much bigger than the state average.
According to our research of Connecticut and other state lists, there were 387 registered sex offenders living in Waterbury, Connecticut as of May 15, 2024.
The ratio of all residents to sex offenders in Waterbury is 280 to 1.
Violent crime rate in 2022
| Waterbury: | 236.2 |
| U.S. Average: | 219.8 |
Violent crime rate in 2021
| Waterbury: | 204.7 |
| U.S. Average: | 224.8 |
Violent crime rate in 2020
| Waterbury: | 227.0 |
| U.S. Average: | 228.2 |
Violent crime rate in 2019
| Waterbury: | 186.4 |
| U.S. Average: | 219.9 |
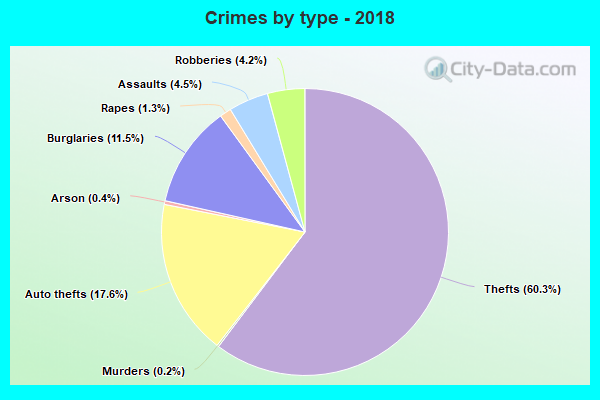
Violent crime rate in 2018
| Waterbury: | 263.0 |
| U.S. Average: | 221.2 |
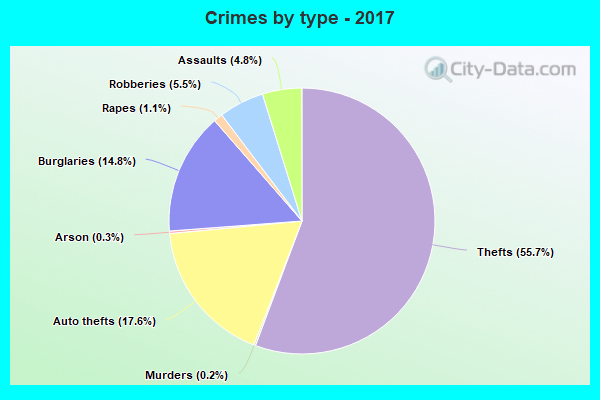
Violent crime rate in 2017
| Waterbury: | 290.9 |
| U.S. Average: | 226.2 |
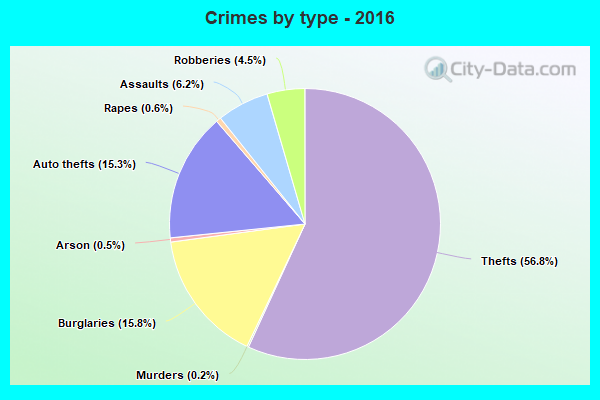
Violent crime rate in 2016
| Waterbury: | 283.0 |
| U.S. Average: | 227.3 |
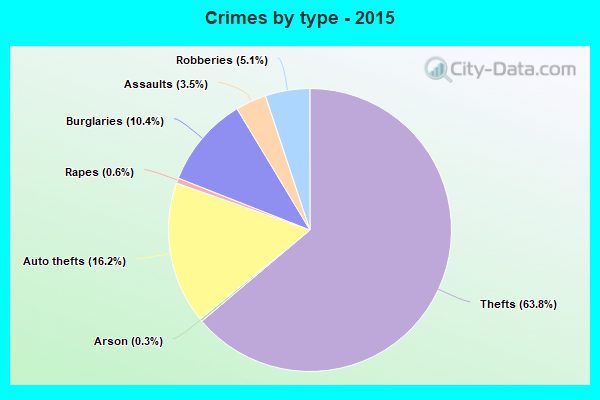
Violent crime rate in 2015
| Waterbury: | 234.3 |
| U.S. Average: | 219.3 |
Violent crime rate in 2014
| Waterbury: | 211.4 |
| U.S. Average: | 211.1 |
Violent crime rate in 2013
| Waterbury: | 194.5 |
| U.S. Average: | 214.2 |
Violent crime rate in 2012
| Waterbury: | 158.4 |
| U.S. Average: | 187.4 |
Violent crime rate in 2011
| Waterbury: | 175.9 |
| U.S. Average: | 187.1 |
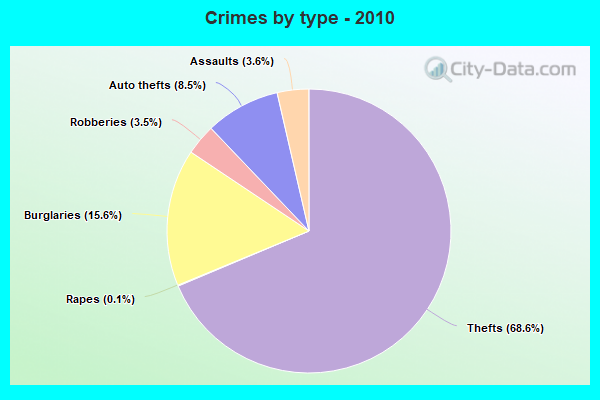
Violent crime rate in 2010
| Waterbury: | 175.3 |
| U.S. Average: | 195.7 |
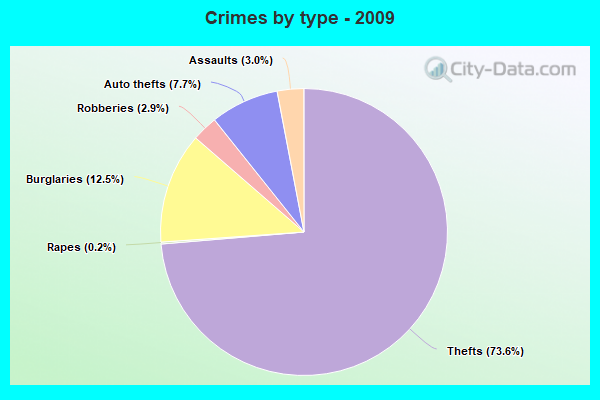
Violent crime rate in 2009
| Waterbury: | 190.6 |
| U.S. Average: | 208.9 |
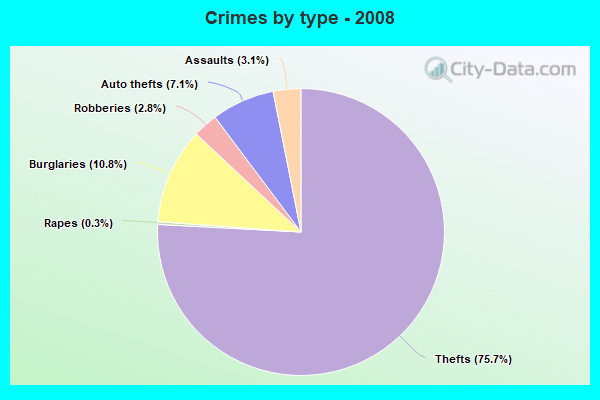
Violent crime rate in 2008
| Waterbury: | 195.0 |
| U.S. Average: | 222.5 |
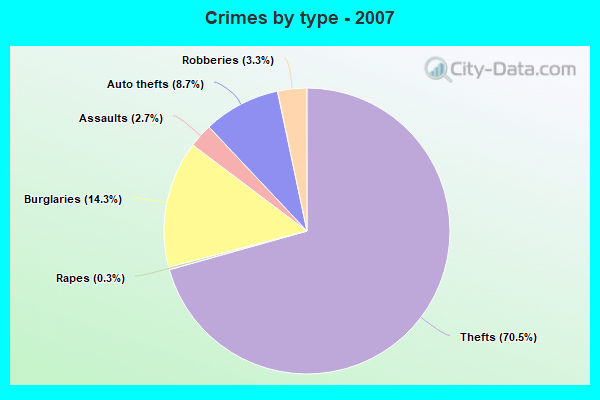
Violent crime rate in 2007
| Waterbury: | 180.2 |
| U.S. Average: | 229.1 |
Violent crime rate in 2006
| Waterbury: | 201.3 |
| U.S. Average: | 232.6 |
Violent crime rate in 2005
| Waterbury: | 206.5 |
| U.S. Average: | 227.0 |
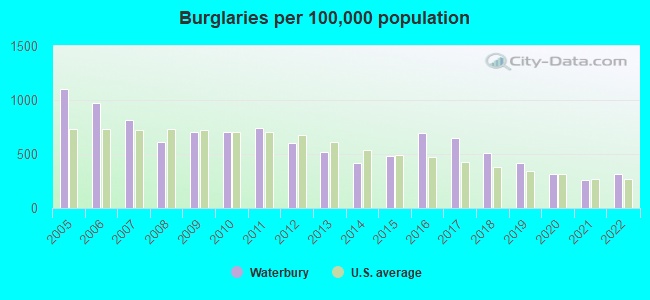
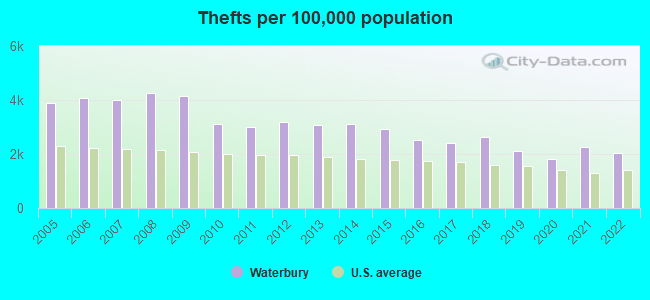
Property crime rate in 2022
| Waterbury: | 243.9 |
| U.S. Average: | 166.5 |
Property crime rate in 2021
| Waterbury: | 256.4 |
| U.S. Average: | 157.8 |
Property crime rate in 2020
| Waterbury: | 231.7 |
| U.S. Average: | 169.6 |
Property crime rate in 2019
| Waterbury: | 264.7 |
| U.S. Average: | 179.7 |
Property crime rate in 2018
| Waterbury: | 349.7 |
| U.S. Average: | 190.2 |
Property crime rate in 2017
| Waterbury: | 364.8 |
| U.S. Average: | 206.4 |
Property crime rate in 2016
| Waterbury: | 366.0 |
| U.S. Average: | 216.6 |
Property crime rate in 2015
| Waterbury: | 353.4 |
| U.S. Average: | 221.5 |
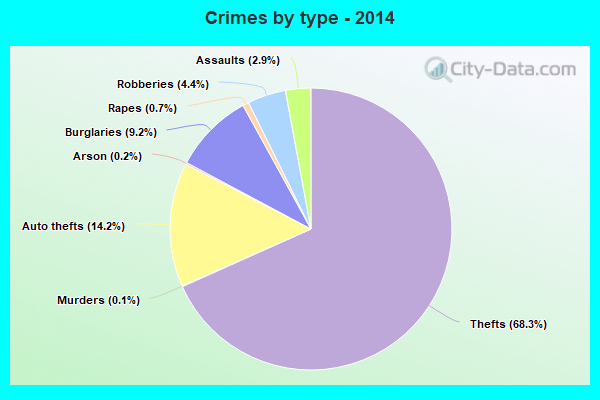
Property crime rate in 2014
| Waterbury: | 337.4 |
| U.S. Average: | 230.8 |
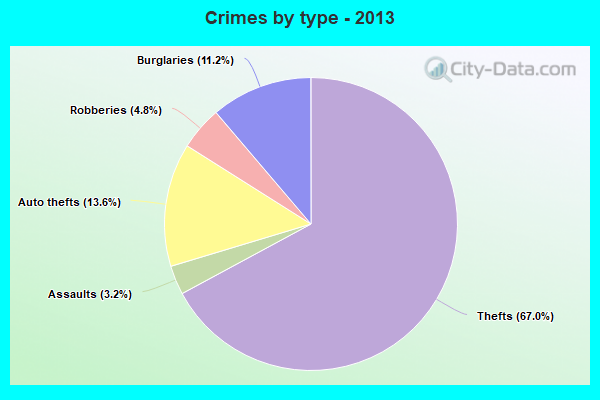
Property crime rate in 2013
| Waterbury: | 351.3 |
| U.S. Average: | 250.4 |
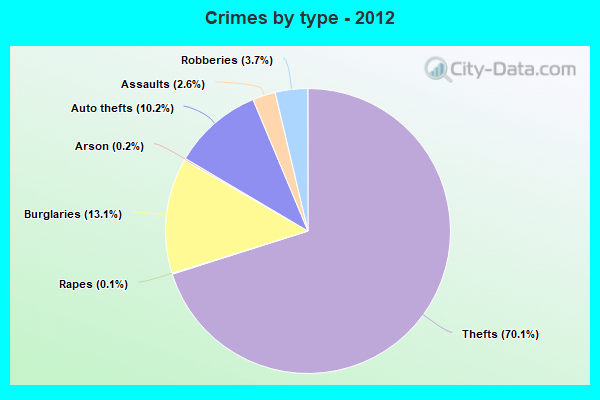
Property crime rate in 2012
| Waterbury: | 349.6 |
| U.S. Average: | 267.3 |
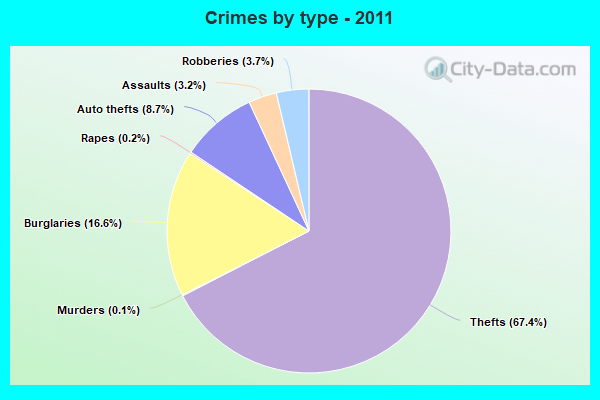
Property crime rate in 2011
| Waterbury: | 356.3 |
| U.S. Average: | 273.5 |
Property crime rate in 2010
| Waterbury: | 355.0 |
| U.S. Average: | 276.4 |
Property crime rate in 2009
| Waterbury: | 411.7 |
| U.S. Average: | 285.6 |
Property crime rate in 2008
| Waterbury: | 395.4 |
| U.S. Average: | 302.2 |
Property crime rate in 2007
| Waterbury: | 405.5 |
| U.S. Average: | 309.2 |
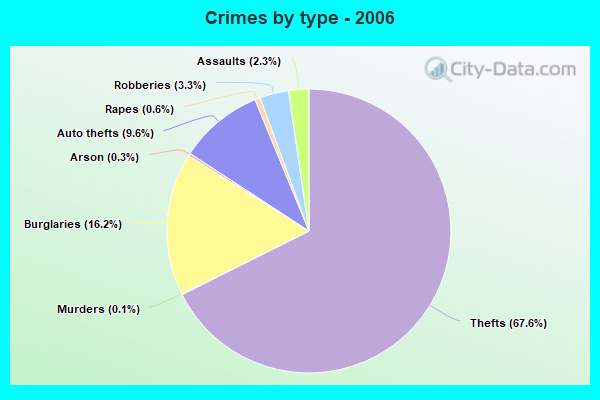
Property crime rate in 2006
| Waterbury: | 448.0 |
| U.S. Average: | 317.3 |
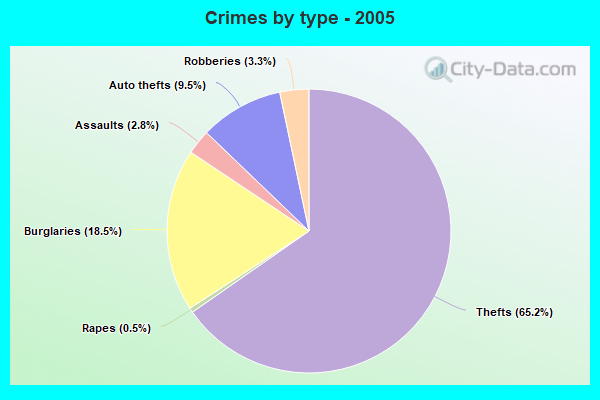
Property crime rate in 2005
| Waterbury: | 463.1 |
| U.S. Average: | 322.3 |
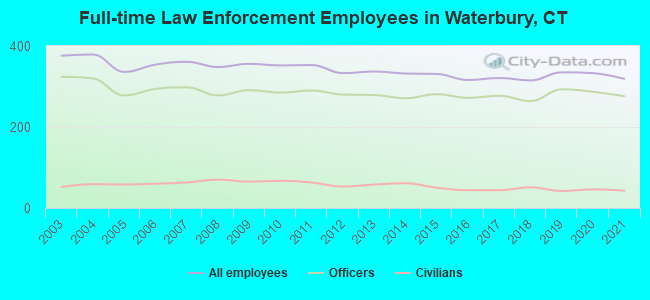
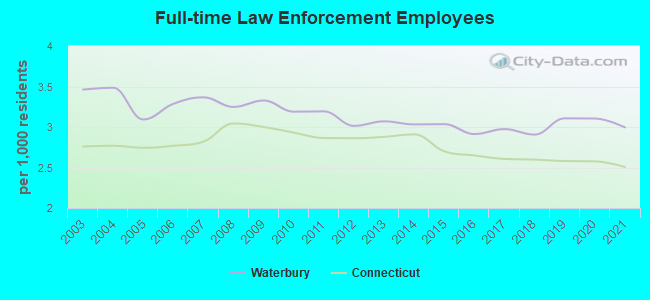
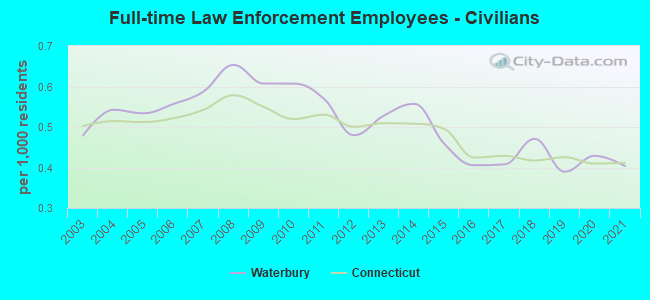
Full-time law enforcement employees in 2021, including police officers: 319 (276 officers - 255 male; 21 female).
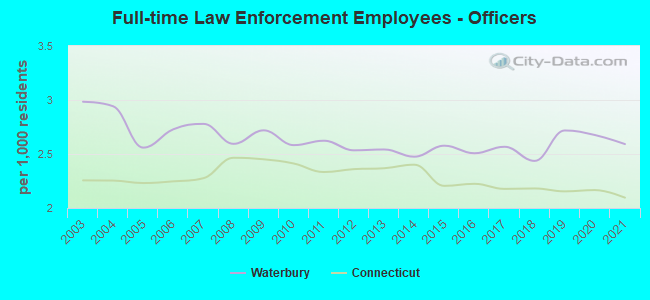
| Officers per 1,000 residents here: | 2.59 |
| Connecticut average: | 2.10 |
Full-time law enforcement employees in 2020, including police officers: 333 (287 officers - 264 male; 23 female).
| Officers per 1,000 residents here: | 2.68 |
| Connecticut average: | 2.17 |
Full-time law enforcement employees in 2019, including police officers: 335 (293 officers - 270 male; 23 female).
| Officers per 1,000 residents here: | 2.72 |
| Connecticut average: | 2.15 |
Full-time law enforcement employees in 2018, including police officers: 315 (264 officers - 245 male; 19 female).
| Officers per 1,000 residents here: | 2.44 |
| Connecticut average: | 2.18 |
Full-time law enforcement employees in 2017, including police officers: 321 (277 officers - 254 male; 23 female).
| Officers per 1,000 residents here: | 2.57 |
| Connecticut average: | 2.18 |
Full-time law enforcement employees in 2016, including police officers: 316 (272 officers - 252 male; 20 female).
| Officers per 1,000 residents here: | 2.51 |
| Connecticut average: | 2.22 |
Full-time law enforcement employees in 2015, including police officers: 331 (281 officers - 261 male; 20 female).
| Officers per 1,000 residents here: | 2.58 |
| Connecticut average: | 2.21 |
Full-time law enforcement employees in 2014, including police officers: 332 (271 officers - 252 male; 19 female).
| Officers per 1,000 residents here: | 2.47 |
| Connecticut average: | 2.40 |
Full-time law enforcement employees in 2013, including police officers: 337 (279 officers - 257 male; 22 female).
| Officers per 1,000 residents here: | 2.54 |
| Connecticut average: | 2.37 |
Full-time law enforcement employees in 2012, including police officers: 333 (280 officers - 255 male; 25 female).
| Officers per 1,000 residents here: | 2.53 |
| Connecticut average: | 2.36 |
Full-time law enforcement employees in 2011, including police officers: 353 (290 officers - 265 male; 25 female).
| Officers per 1,000 residents here: | 2.62 |
| Connecticut average: | 2.33 |
Full-time law enforcement employees in 2010, including police officers: 352 (285 officers - 261 male; 24 female).
| Officers per 1,000 residents here: | 2.58 |
| Connecticut average: | 2.41 |
Full-time law enforcement employees in 2009, including police officers: 356 (291 officers - 267 male; 24 female).
| Officers per 1,000 residents here: | 2.72 |
| Connecticut average: | 2.45 |
Full-time law enforcement employees in 2008, including police officers: 348 (278 officers - 256 male; 22 female).
| Officers per 1,000 residents here: | 2.59 |
| Connecticut average: | 2.47 |
Full-time law enforcement employees in 2007, including police officers: 361 (298 officers - 273 male; 25 female).
| Officers per 1,000 residents here: | 2.78 |
| Connecticut average: | 2.28 |
Full-time law enforcement employees in 2006, including police officers: 354 (294 officers - 267 male; 27 female).
| Officers per 1,000 residents here: | 2.73 |
| Connecticut average: | 2.25 |
Full-time law enforcement employees in 2005, including police officers: 336 (278 officers - 257 male; 21 female).
| Officers per 1,000 residents here: | 2.56 |
| Connecticut average: | 2.23 |
Full-time law enforcement employees in 2004, including police officers: 379 (320 officers - 295 male; 25 female).
| Officers per 1,000 residents here: | 2.94 |
| Connecticut average: | 2.25 |
Full-time law enforcement employees in 2003, including police officers: 376 (324 officers - 302 male; 22 female).
| Officers per 1,000 residents here: | 2.98 |
| Connecticut average: | 2.26 |