Crime rate in Waukegan, Illinois (IL): murders, rapes, robberies, assaults, burglaries, thefts, auto thefts, arson, law enforcement employees, police officers, crime map
Crime rate in Waukegan, IL
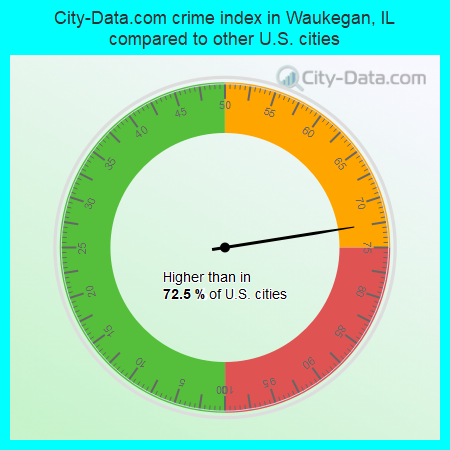
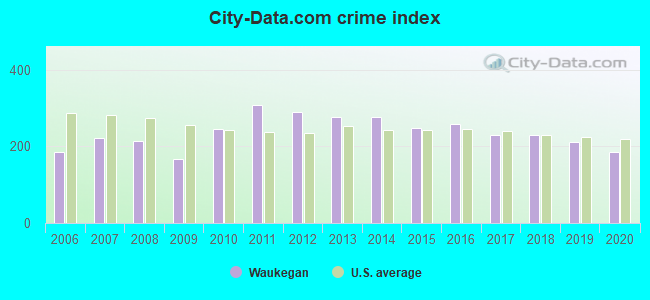
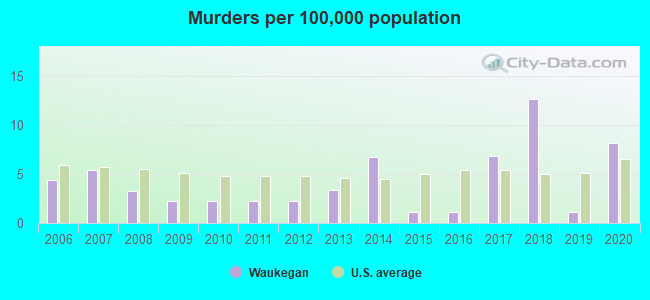
The 2020 crime rate in Waukegan, IL is 186 (City-Data.com crime index), which is 1.3 times smaller than the U.S. average. It was higher than in 72.5% U.S. cities. The 2020 Waukegan crime rate fell by 12% compared to 2019. The number of homicides stood at 7 - an increase of 6 compared to 2019. In the last 5 years Waukegan has seen decline of violent crime and decreasing property crime.See how dangerous Waukegan, IL is compared to the nearest cities:
(Note: Higher means more crime)
(Note: Higher means more crime)
| Waukegan: | 186.3 |
| Park City: | 113.4 |
| North Chicago: | 35.0 |
| Gurnee: | 159.7 |
| Zion: | 301.6 |
| Lake Bluff: | 102.4 |
| Winthrop Harbor: | 26.7 |
| Libertyville: | 19.9 |
| Grayslake: | 132.3 |
The City-Data.com crime index weighs serious crimes and violent crimes more heavily. Higher means more crime, U.S. average is 246.1. It adjusts for the number of visitors and daily workers commuting into cities.
- means the value is smaller than the state average.- means the value is about the same as the state average.
- means the value is bigger than the state average.
- means the value is much bigger than the state average.
According to our research of Illinois and other state lists, there were 213 registered sex offenders living in Waukegan, Illinois as of May 18, 2024.
The ratio of all residents to sex offenders in Waukegan is 414 to 1.
Violent crime rate in 2020
| Waukegan: | 204.1 |
| U.S. Average: | 228.2 |
Violent crime rate in 2019
| Waukegan: | 204.6 |
| U.S. Average: | 219.9 |
Violent crime rate in 2018
| Waukegan: | 233.1 |
| U.S. Average: | 221.2 |
Violent crime rate in 2017
| Waukegan: | 225.5 |
| U.S. Average: | 226.2 |
Violent crime rate in 2016
| Waukegan: | 260.9 |
| U.S. Average: | 227.3 |
Violent crime rate in 2015
| Waukegan: | 228.5 |
| U.S. Average: | 219.3 |
Violent crime rate in 2014
| Waukegan: | 245.1 |
| U.S. Average: | 211.1 |
Violent crime rate in 2013
| Waukegan: | 250.7 |
| U.S. Average: | 214.2 |
Violent crime rate in 2012
| Waukegan: | 264.3 |
| U.S. Average: | 187.4 |
Violent crime rate in 2011
| Waukegan: | 271.4 |
| U.S. Average: | 187.1 |
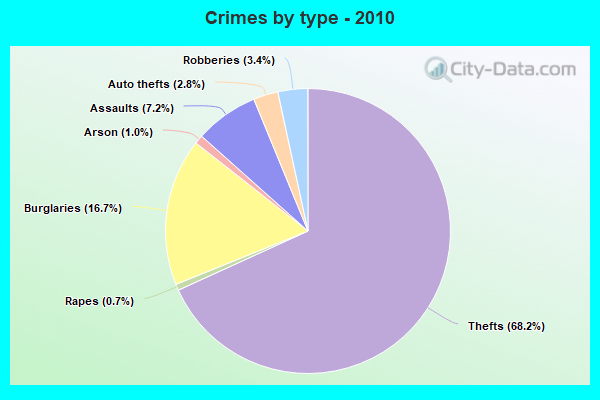
Violent crime rate in 2010
| Waukegan: | 206.6 |
| U.S. Average: | 195.7 |
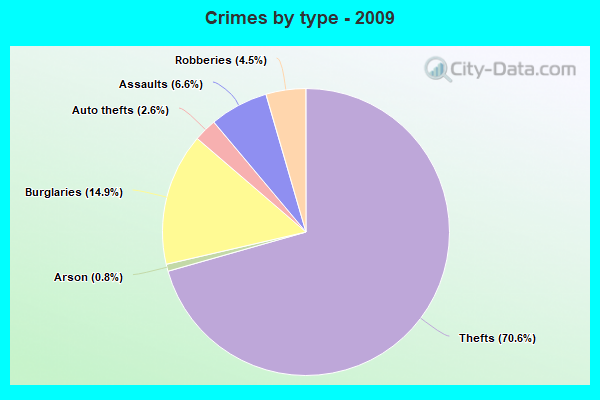
Violent crime rate in 2009
| Waukegan: | 138.4 |
| U.S. Average: | 208.9 |
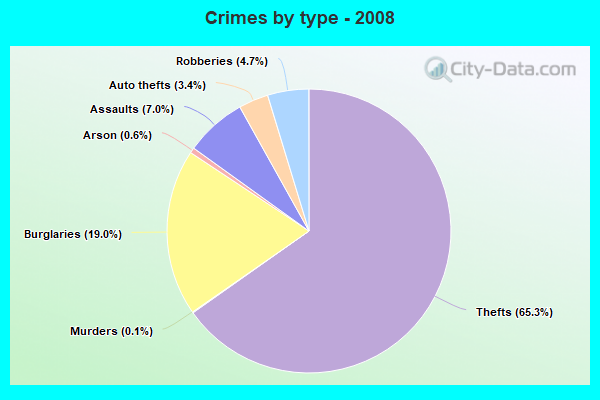
Violent crime rate in 2008
| Waukegan: | 180.4 |
| U.S. Average: | 222.5 |
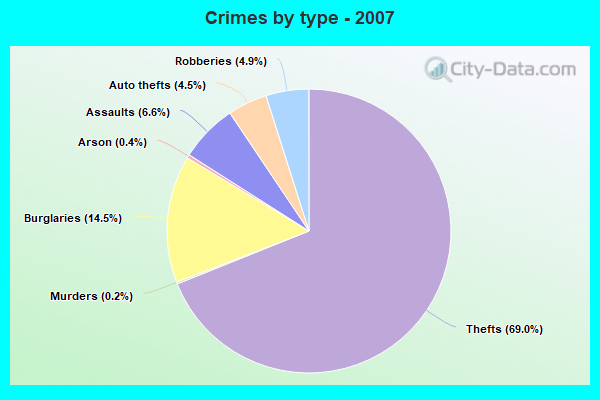
Violent crime rate in 2007
| Waukegan: | 185.7 |
| U.S. Average: | 229.1 |
Violent crime rate in 2006
| Waukegan: | 169.9 |
| U.S. Average: | 232.6 |
Property crime rate in 2020
| Waukegan: | 127.0 |
| U.S. Average: | 169.6 |
Property crime rate in 2019
| Waukegan: | 181.6 |
| U.S. Average: | 179.7 |
Property crime rate in 2018
| Waukegan: | 159.0 |
| U.S. Average: | 190.2 |
Property crime rate in 2017
| Waukegan: | 195.0 |
| U.S. Average: | 206.4 |
Property crime rate in 2016
| Waukegan: | 228.1 |
| U.S. Average: | 216.6 |
Property crime rate in 2015
| Waukegan: | 233.1 |
| U.S. Average: | 221.5 |
Property crime rate in 2014
| Waukegan: | 265.2 |
| U.S. Average: | 230.8 |
Property crime rate in 2013
| Waukegan: | 263.4 |
| U.S. Average: | 250.4 |
Property crime rate in 2012
| Waukegan: | 262.2 |
| U.S. Average: | 267.3 |
Property crime rate in 2011
| Waukegan: | 287.4 |
| U.S. Average: | 273.5 |
Property crime rate in 2010
| Waukegan: | 241.9 |
| U.S. Average: | 276.4 |
Property crime rate in 2009
| Waukegan: | 165.8 |
| U.S. Average: | 285.6 |
Property crime rate in 2008
| Waukegan: | 225.4 |
| U.S. Average: | 302.2 |
Property crime rate in 2007
| Waukegan: | 214.6 |
| U.S. Average: | 309.2 |
Property crime rate in 2006
| Waukegan: | 172.0 |
| U.S. Average: | 317.3 |
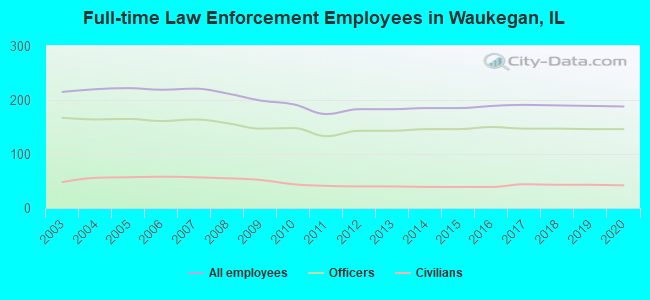
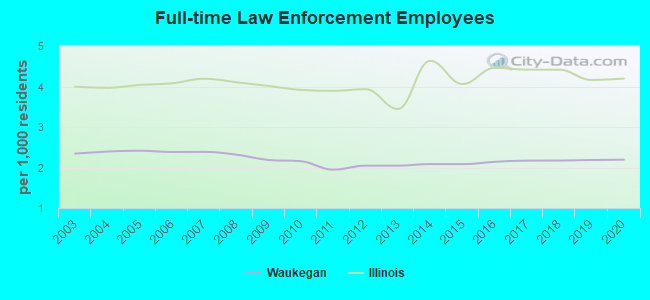
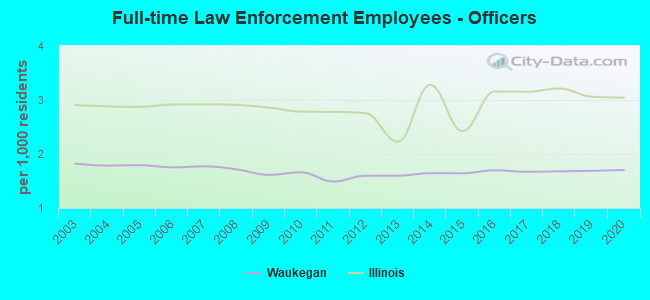
Full-time law enforcement employees in 2020, including police officers: 188 (146 officers - 126 male; 20 female).
| Officers per 1,000 residents here: | 1.70 |
| Illinois average: | 3.04 |
Full-time law enforcement employees in 2019, including police officers: 189 (146 officers - 129 male; 17 female).
| Officers per 1,000 residents here: | 1.69 |
| Illinois average: | 3.06 |
Full-time law enforcement employees in 2018, including police officers: 190 (147 officers - 130 male; 17 female).
| Officers per 1,000 residents here: | 1.68 |
| Illinois average: | 3.21 |
Full-time law enforcement employees in 2017, including police officers: 191 (147 officers - 130 male; 17 female).
| Officers per 1,000 residents here: | 1.67 |
| Illinois average: | 3.15 |
Full-time law enforcement employees in 2016, including police officers: 189 (150 officers - 133 male; 17 female).
| Officers per 1,000 residents here: | 1.70 |
| Illinois average: | 3.16 |
Full-time law enforcement employees in 2015, including police officers: 185 (146 officers - 129 male; 17 female).
| Officers per 1,000 residents here: | 1.64 |
| Illinois average: | 2.42 |
Full-time law enforcement employees in 2014, including police officers: 185 (146 officers - 129 male; 17 female).
| Officers per 1,000 residents here: | 1.65 |
| Illinois average: | 3.28 |
Full-time law enforcement employees in 2012, including police officers: 183 (143 officers - 130 male; 13 female).
| Officers per 1,000 residents here: | 1.60 |
| Illinois average: | 2.76 |
Full-time law enforcement employees in 2011, including police officers: 174 (133 officers - 119 male; 14 female).
| Officers per 1,000 residents here: | 1.49 |
| Illinois average: | 2.78 |
Full-time law enforcement employees in 2010, including police officers: 192 (148 officers - 132 male; 16 female).
| Officers per 1,000 residents here: | 1.66 |
| Illinois average: | 2.78 |
Full-time law enforcement employees in 2009, including police officers: 199 (147 officers - 132 male; 15 female).
| Officers per 1,000 residents here: | 1.61 |
| Illinois average: | 2.86 |
Full-time law enforcement employees in 2008, including police officers: 212 (157 officers - 142 male; 15 female).
| Officers per 1,000 residents here: | 1.72 |
| Illinois average: | 2.91 |
Full-time law enforcement employees in 2007, including police officers: 221 (164 officers - 148 male; 16 female).
| Officers per 1,000 residents here: | 1.77 |
| Illinois average: | 2.92 |
Full-time law enforcement employees in 2006, including police officers: 219 (161 officers - 145 male; 16 female).
| Officers per 1,000 residents here: | 1.75 |
| Illinois average: | 2.92 |
Full-time law enforcement employees in 2005, including police officers: 222 (165 officers - 151 male; 14 female).
| Officers per 1,000 residents here: | 1.79 |
| Illinois average: | 2.87 |
Full-time law enforcement employees in 2004, including police officers: 220 (164 officers - 152 male; 12 female).
| Officers per 1,000 residents here: | 1.78 |
| Illinois average: | 2.88 |
Full-time law enforcement employees in 2003, including police officers: 215 (167 officers - 155 male; 12 female).
| Officers per 1,000 residents here: | 1.82 |
| Illinois average: | 2.90 |

Zip codes: 60085.